 |
Hydrologic model with landscape dynamics for drought monitoring |
 |
1Energy and Wetlands Research Group, Centre for Ecological Sciences [CES],
2Centre for Sustainable Technologies, 3Centre for infrastructure, Sustainable Transportation and Urban Planning (CiSTUP),
Indian Institute of Science, Bangalore – 560012, India.
*Corresponding author: cestvr@ces.iisc.ac.in
|
RESULTS AND DISCUSSIONS
Figure 6 depicts the land use based on the classification of remote sensing data of 2010 and land use statistics are listed in table 3. Sharavathi river basin has a total forest cover of 33.7% followed by forest plantations (22%), and agriculture (14 %). The overall classification accuracy is 91.51% with kappa of 0.90. Figure 7 depicts sub basin wise hydro-meteorological parameters such as net rainfall, runoff, infiltration, ground water recharge, and evapotranspiration.
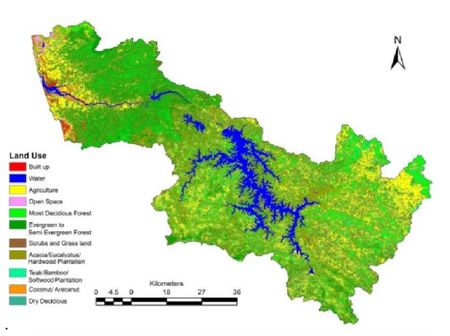
Figure 6: Land use 2010
Table 3: Land use 2010
| Land use |
Area Ha |
Percent |
| Urban |
2937.248 |
0.97% |
| Water |
21017.41 |
6.91% |
| Agriculture |
42803.92 |
14.07% |
| Open lands |
3443.096 |
1.13% |
| Moist Deciduous Forest |
42954.99 |
14.12% |
| Evergreen to
Semi Evergreen forest |
59711.55 |
19.62% |
| Scrub/Grassland |
27592.47 |
9.07% |
| Acacia/Eucalyptus |
41290.43 |
13.57% |
| Teak/Bamboo |
25922.35 |
8.52% |
| Coconut/Arecanut |
36595.8 |
12.03% |
| Dry Deciduous |
0 |
0.00% |
| Total Area |
304269.3 |
|
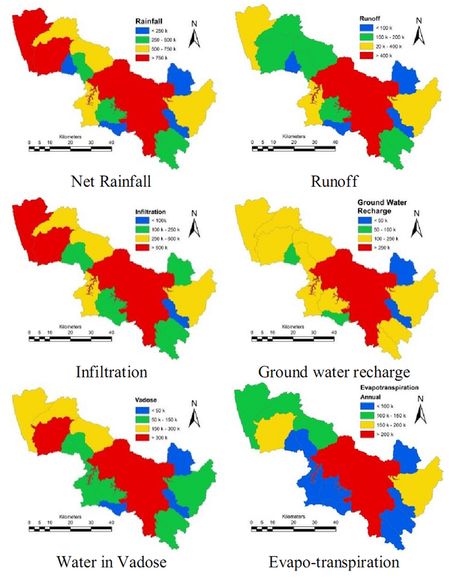
Figure7: Hydro-meteorological parameters (all units in Million litres)
The hydrological parameters together contribute to the water supply. The demand given in Figure 8 is estimated as a function of crop water, domestic and livestock water demand, and losses such as evapotranspiration. Water demand is higher in sub-basins with higher human population coupled with agriculture and horticultural activities.

Figure 8: Parameters contributing to the demand
Figure 9 illustrates the water balance in each basin considering water availability and the requirement in each basin. The coastal sub basins experiences water stress, due to higher water demand

Figure 9: Water Balance
Figure 10 groups the basins depending on the availability of water in streams as A, B, C or D. This also highlight the linkages of water availability with the land use as basins with higher cover of forests with native vegetation have water availability all 12 months or A type streams catering all demand (agriculture, domestic, horticulture and livestock), while the basins where large scale landuse changes also witness water scarcity evident from the presence of C or D type streams.
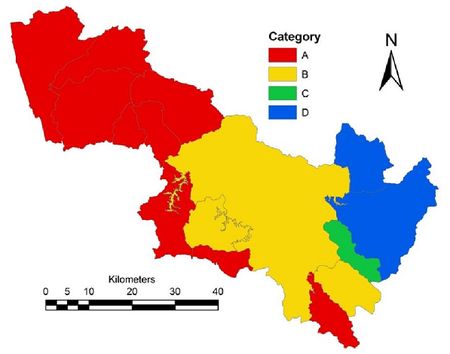
Figure 10: Flow regime
|
|
Citation : Vinay S, Bharath S, Bharath H Aithal, and Ramachandra T V, Hydrologic model with landscape dynamics for drought monitoring, Joint International Workshop of ISPRS VIII/1 and WG IV/4 on Geospatial Data for Disaster and Risk Reduction, November 21-22, 2013.
|