|
METHOD
Figure 5 outlines the procedure followed for assessing the land use and hydrologic dynamics and the analysis of drought episodes. Remote sensing data procured from NRSC, Hyderabad (http://nrsc.gov.in) were rectified using the ground control points (GCP’s) acquired from field using GPS and other ancillary sources (like SOI Topographic maps, etc.). River catchment and sub-basins are delineated using topographic maps (of the Survey of India, 1:50000 scale) along with DEM. Training data to classify remote sensing data and validate classified data were acquired from field using GPS in addition to online resources such as Google Earth (http://earth.google.com) and Bhuvan (http:/bhuvan.nrsc.gov.in). Classification of remote sensing data was done using the Gaussian Maximum likelihood algorithm which is proved to perform better than other classification algorithms (Duda et al., 2002; Bharath et al., 2012; Ramachandra et al., 2013). Of the field data, 60% of the data was used to classify and the rest 40% of the data was used for accuracy assessment of the classified database. The classified land use data was used to estimate the water balance using the other hydro meteorological parameters such as rainfall, temperature, solar radiation, etc. The Net rainfall based on the land use was estimated to eliminate the loss of water due to interception of water by the vegetation during the down pour.
The net rainfall, along with the land use was used to estimate the runoff in each of the river sub basins using the rational formula (equation 1), where R in the surface runoff, Pnet is the net rainfall in mm, C is the land use runoff coefficient and A is the area of the catchment. The amount of water in-filtered (Inf) into the subsurface is calculated as the difference between the Net Rainfall and Runoff, based on equation 2 for Western Ghats, where GR is the Ground water recharge, RC is the Ground water recharge coefficient (listed in table 1), K is the rainfall coefficient. The water in-filtered flows to the stream as either base flow (equation 3) or as ground water discharge (equation 4), where BF is thebase flow, KP is the base flow coefficient, GD is the ground water discharge into the stream, YS is the specific yield.
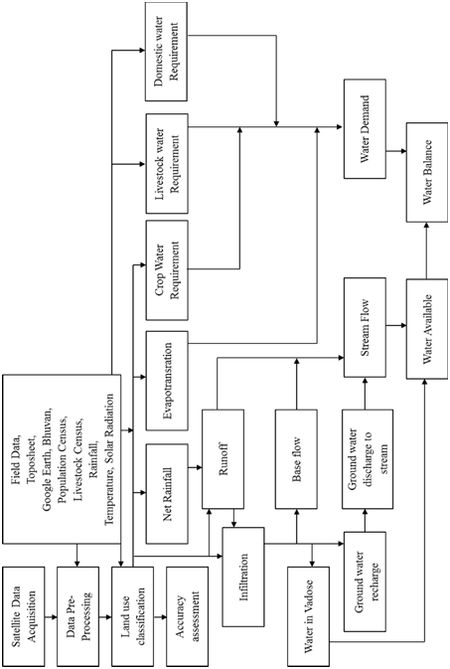
Figure 5: Method involved
Based on the land use, the coefficient of base flow and ground water discharge varies in each sub-basin. Table 2 lists coefficients of base flow and water discharge for each sub-basin based on land uses in the respective basin. All these factors such as R, BF and GD contribute to the flow in the stream during different seasons in a year through satisfying the demands and losses. The water available in the basin is estimated as function of flow in the stream, and other stored water sources such as soil water/ water in vadose zone.
R = Pnet * C * A (1)
GR = RC * (Pnet – K) * A (2)
BF = (Inf – GR) * KP (3)
GD = GR* YS (4)
Table 1: Ground water recharge coefficient
| Annual Rainfall |
RC |
C |
| 400 to 600mm |
0.20 |
400 |
| 600 to 1000 mm |
0.25 |
400 |
| > 2000 mm |
0.35 |
600 |
Table 2*: Baseflow and ground water discharge coefficients
* Based on field data
| Sub basins |
KP % |
YS % |
| Yennehole |
10 |
15 |
| Hurlihole |
10 |
15 |
| Nagodihole |
10 |
27 |
| Hilkunji |
10 |
15 |
| Sharavathi |
10 |
15 |
| Mavinahole |
30 |
3 |
The demand of water is calculated as function of evapotranspiration, crop water, household (domestic water) and livestock water requirements. Evapotranspiration is calculated using the Hargreevs equation (equation 5) based on the average monthly maximum and minimum temperature (Tmax, Tmin), solar radiation (Sr) and the evapotranspiration coefficient (Ec) which varies from land use to land use. The crop coefficient was calculated for different time frames based on individual crop water need based on various growth phases of the crop, and cropping pattern in the year based on the annual crop calendar. The water required for livestock or for the domestic purpose varies from season to season, in case of livestock, the water required varies on type of animal.
 (5) (5)
Sub-basin wise water balance is estimated as a function of water supply to that of demand in the respective month. The flow in the basin is estimated as function of water available as stream flow in sub basins. Based on the filed investigations, depending on the flow, streams are categorized under four categories: A) Perennial (12 months), B) Seasonal (9 month) C) Seasonal (6 Months) D) Seasonal (less than 4 Months). The basin experiences water stress if availability of water is lower than the demand, creating water deficit in that basin.
|
