RESULTS AND DISCUSSION
The volume of water held is computed to be 2.42 X 10⁹ liters at an average water depth of 1.1 m with a water-spread area of 220 ha. The sewage received by this lake is about 5.00X10⁸ l/d (500 MLD). Based on these data, the retention time would be 4.84 days. However, as the flow is not uniform and the presence of macrophytes impedes uniform flow, the actual residence time would be lower than the estimated 4.84 d. From an open pan evaporation value of 10 mm in summer and 5mm in the rainy season, the daily evaporation loss for open surface water is estimated to be 2.2X10⁷ l/d in summer and half that for the rainy months. This, in turn, works out to 4.4% of influent for the summer. It is, therefore, envisaged that any changes in the composition of the wastewater between the inlet and the outlet are not likely to be affected by evaporation losses to any significant extent.
The inlet area is quite narrow and shallow (0.5-0.75m deep, Figure 2) and has a surface flow rate ranging between 0.16 (Siddapur, VN) and 0.38 (inlet) m/sec. This zone is generally covered with floating as well as rooted macrophytes round the year (Figure 3a and 3b). As a result, water flow occurs in a narrow and open channel. Algal species found in water are listed in Table 1 (genus level), while Table 2 lists macrophytes. Algae are dominated by Microcystis sp. which is indicative of a stressed lake followed by Chlorella sp. and Nitzschia sp. It has been observed that the primary colonizer of this zone is the water hyacinth. When the plant density becomes high, these detach themselves from the main body of floating water hyacinth, and form small floating islands which later become infected by disease and pests. Significant water hyacinth mortality leads to succession by other species such as Alternanthera sp., local grasses, etc. growing on the floating debris of the decaying water hyacinth. Some water hyacinth, however, still grows between these otherwise luxuriant growths of floating terrestrial weeds, especially during the summer months. A large part of this Alternanthera sp. and grass biomass is also harvested manually and used as green fodder. However, the biomass growth rates far outstrip the harvest rates. As a result, during the months of April and May, nearly 70-80% of the water-spread area is covered by these macrophytes. This completely changes the way the lake functions in purifying the wastewater of the lake, which is discussed in detail later.
Table 1. Algae communities (identified up to genus level) in Varthur lake
| Algal Family |
Chlorophyceae |
Cyanophyceae |
Bacillariophyceae |
Euglenophyceae |
Chlamydomonas sp. Chlorogonium sp. Scenedesmus sp. Ankistrodermus sp.
Chlorella sp. |
Cylindrospermopsis sp. Arthrospira sp.
Microcystis sp.
Oscillatoria sp.
Anabaena sp. Merismopedia sp. Lyngbya sp. |
Gomphonema sp. Cymbella sp. Navicula sp. Pinnularia sp. Nitzschia sp.
Synedra sp. Fragillaria sp. Cocconeis sp.
Melosira sp. |
Phacus sp.
Euglena sp. Trachelomonas sp.
Lepocinclis sp. |
Table 2. Macrophytes in Varthur lake (includes riparian vegetation)
| Plant species |
Common Name |
| Typha augustifolia |
cat tail |
| Colocasia essculanta |
taro |
| Cyperus haspans |
dwarf papyrus sedge |
| Alternanthera phyloxiriodes |
alligator weed |
| Eichhorniacrassipes |
water hyacinth |
| Lemna gibba |
duckweed |
| Lemna minor |
lesser duckweed |
| Pistia stratiotes |
water lettuce |
The diurnal (January and April 2009) changes of DO levels in water given in Figure 4 seems to be influenced by the macrophytes covering the lake. Figure 4 a) shows DO measured at the south outlet when it is free of macrophytes cover; while Figure 4 b) shows lower DO values when the lake is infested with macrophytes. Higher levels of nutrients during the summer (due to lack of dilution in the absence of rain and higher evaporation) have resulted in the profuse growth and dense spread of macrophytes hindering the light penetration and hence algal photosynthesis. Reduction of algal population coupled with poor photosynthesis has lowered DO in April month. Also, persistent stagnation of water due to blockage of north outlet has resulted in the consistent lower DO values at north outlet throughout the year.
Figure 4. Diurnal changes of DO levels during January and April 2009 at
a) south outlets and b) north outlets

Note: VNO represents Varthur North Outlet and VSO represents Varthur South Outlet.
The inlet region is predominantly anaerobic throughout the year as the channel connecting Varthur lake from the Belandur lake receives raw sewage from the immediate vicinity (~100 MLD) apart from partially treated sewage (~400 MLD) from Belandur lake. The samples at these locations are characterized by organic sludge under anaerobic conditions which is evident from dark grey colour, higher turbidity, lower DO (zero mg/l), negative ORP i.e. Oxidation Reduction Potential (-220 to -180 mV). These conditions have aided the spread of macrophyte mats, which has reduced the flow of water. However, there few distinguishable zones of rapid flow of incoming wastewater in the inlet channel. Spatial analysis of macrophytes spread in the lake using remote sensing data (Figure 3a and 3b) highlights that the anaerobic zone occupies a third of the distance from the inlet (water hyacinth cover is about 74 ha.) during the rainy and winter months (July to January) and extend two-thirds of the water-spread area (148 ha.) during February to June. During rainy season, the runoff and high velocity wind (17kmph, westerly wind) play a major role in the spread and dispersal of floating macrophytes across the water-spread area apart from transporting to downstream regions. In the absence of floating macrophytes, the water rapidly turns green to indicate the presence of microalgae and their role in treating water evident from higher DO and lower BOD during these months. However at northern outlet, compaction of macrophytes happens due to wind and blockage.
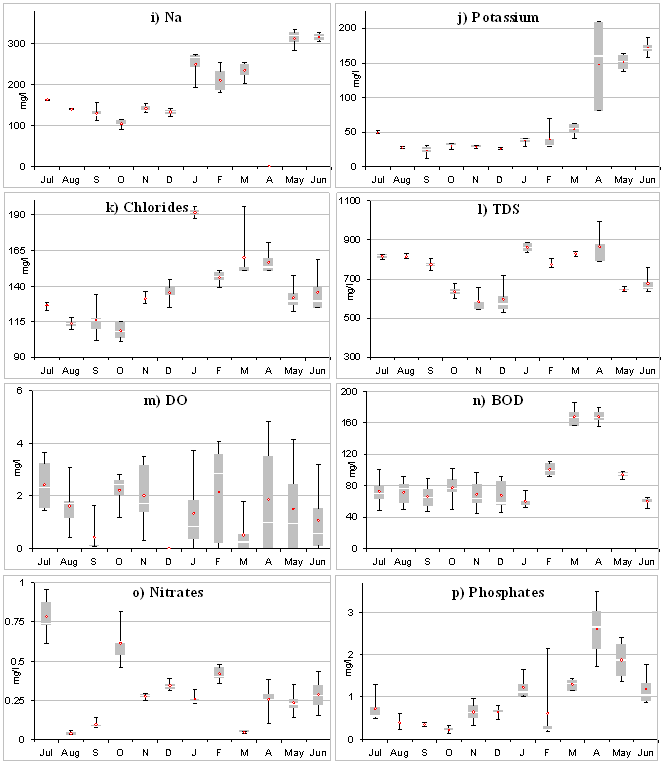
Water quality monitoring was carried out covering all seasons to understand the variations in water quality across space due to seasons. The analysis was carried out as discussed in the methods section. Figure 5 depicts monthly variations at inlet and outlets, while Figure 6 portrays water quality across all sampling locations. Parameters such as DO, BOD, PO4 and hardness exhibit seasonal variations across the lake. Figure 7 further highlights the extent of variations across space and time through Whisker plots. Parameter- wise variations are discussed next.
Figure 5. Comparison of inlet and outlet characteristics, VN-Inlet and VSO-Outlet.
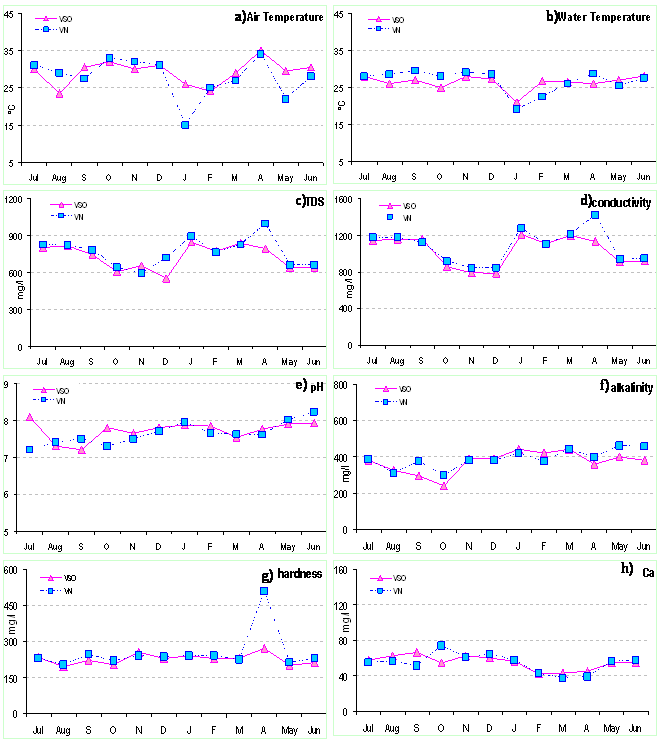
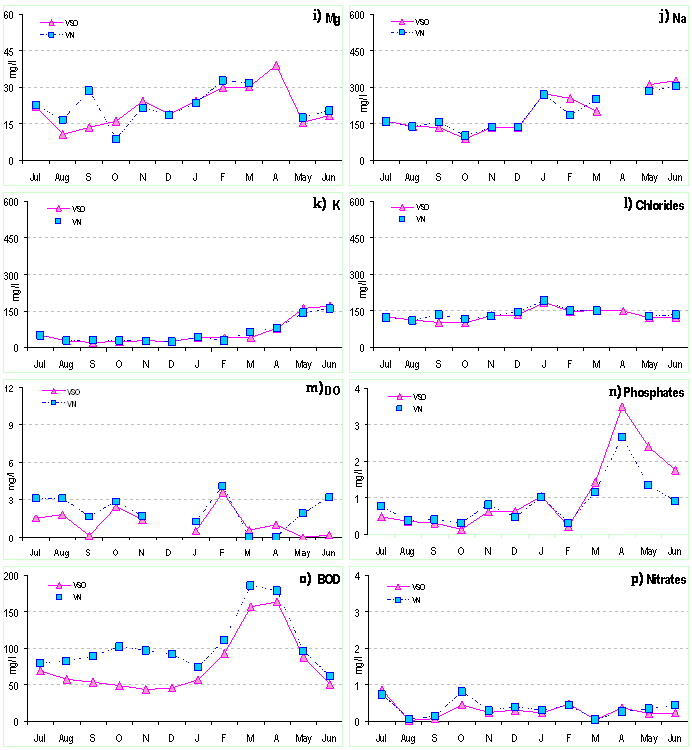
Figure 6. Overall variation of water quality at different sites in different seasons
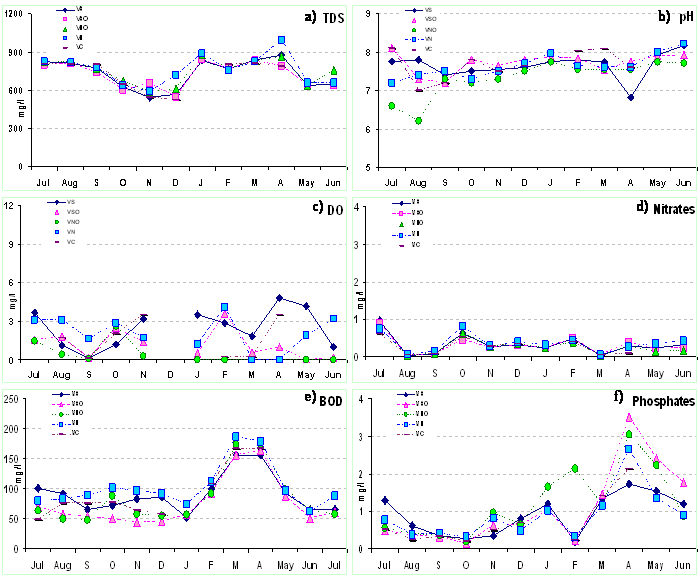
The ambient air temperature was found to be in the range of 15 (winter) – 35°C (summer) at the time of sampling (Figure 7a). Water temperature influences the rate of various biochemical reactions, and enhances BOD removal rates. The water temperature showed the variation of 18°C (winter) to 32°C (summer) (Figure 7b).
Figure 7. Whisker plots showing the extent of variations across space and time
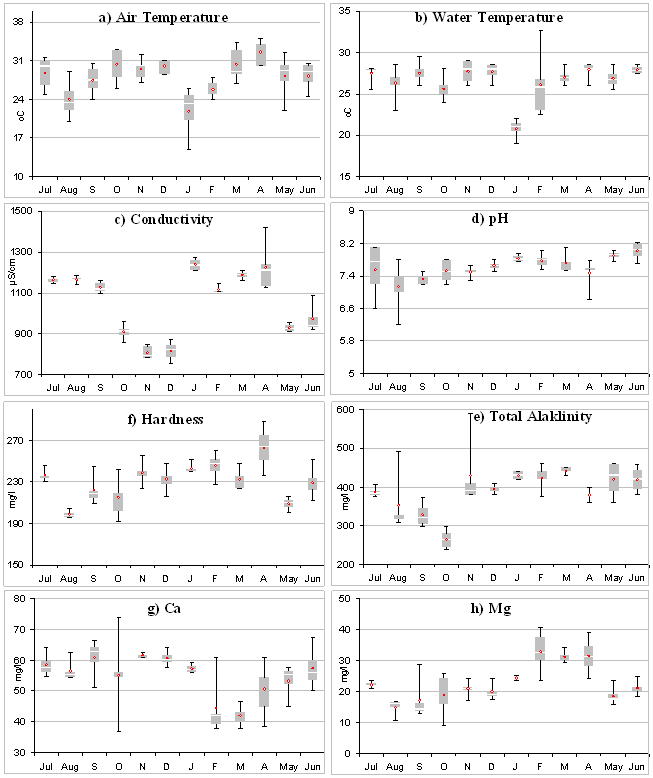
Total Dissolved Solids (TDS) comprise mobile charged ions, including minerals, salts or metals dissolved in water. TDS value (Figure 7c) ranged from 528 (December) – 994 mg/l (April) and are in agreement with earlier studies (Ramachandra et al., 2006). Higher values of TDS are due to the reduced flow rates, an influx of concentrated sewage and an enhanced water retention period. Electrical conductivity is an indirect measurement of the salt concentration. It varies (Figure 7c) from 751 (December) – 1420 µS/cm (April). EC is positively correlated with TDS (r=0.93, p<0.05) as reported earlier (Kataria et al., 1995; Bharali et al., 2008).
Transparency indicates the extent of turbidity and also measures the light penetration through the water. It ranged from 24 (summer) - 28cm (monsoon). Reduced transparency during summer is due to increase of suspended particles on account of organic debris’s decomposition with higher water temperature and reduced flow.
pH is largely governed by carbon dioxide, carbonates and bicarbonate equilibrium (Chapman, 1996). pH ranged from 6.82 (August - October) to 8.2 (July), which coincides with increased cations found in the water (r = 0.8791, Mg; r = 0.8823, Na; r = 8817, K; at p < 0.05) (Figure 7d). A sudden decrease in pH (during June to September) comparable to other studies (Bindiya et al., 2008; Raveen et al., 2008) may be attributed to the dilution on account of the inflow of the run off. Slightly alkaline conditions are favorable for the growth of primary producers (Bellum, 1956) and a low pH is a consequence of macrophytes cover (Parinet et al., 2004).
Total alkalinity ranged from 240 (October) – 460 mg/l (May), as in Figure 6. Higher values during summer are due to reduced microalgal photosynthetic activities resulting in higher respiration (and higher total CO2) and anaerobic decomposition by bacteria on account of profuse spread of macrophytes (Figure 3b). Total alkalinity is higher at inlet (Figure 5f) due to high concentration of carbon-based mineral molecules suspended in the solution at the inlet region and prevailing anoxic conditions. This is comparable to earlier similar studies (Sinada and Abdel Karim, 1984; Hujare, 2008) but higher (Ramachandra et al., 2006).
The total Hardness (Figure 7f) ranged from 192 (October) to 288 mg/l (April). Relatively lower value during monsoon is due to dilution (similar with other parameters), while higher value in summer can be attributed to a decreased flow rate and stagnation due to the blockage of one of the outlets, apart from the profuse macrophyte cover. There is no significant difference (p= 0.307 > 0.05) between the inlet and the outlet values (Figure 5g).
Calcium varies (Figure 7g) between 37.6 (March) - 73.75 (October) mg/l without marked differences between inlet and outlets (Figure 5h). Magnesium ranged (Figure 7h) from 8.7 (October) - 40.5 (February) mg/l. Higher value of 40.5 mg/l (February; Figure 7g), can be attributed to higher dependency of groundwater during non-monsoon seasons in the catchment. Sodium (Figure 7i) ranged from 90 (October) – 810 mg/l (April). Higher values during summer are due to higher evaporation and consequent concentrations in summer apart from higher dependency on groundwater. This higher value (of Mg, Na, K, etc.) has also contributed to higher TS. However, this is much higher in comparison to earlier studies (Ramachandra et al., 2006). Potassium is one of the essential nutrients for plant growth and it ranged (Figure 7j) from 11 (September) – 210 (April) mg/l. There is no considerable difference between inlet and outlet K concentrations (p=0.9>0.05) (Figure 5k) due to anoxic conditions (at inlet) and dense macrophyte cover (at outlet).
Chlorides vary from 100 (October) – 195 (January) mg/l (Figure 7k). These values are in conformity with earlier studies in the range of 120 mg/l for sewage fed aquatic systems (Garg, 2007; Toshiniwal, 2006).
Dissolved oxygen decides the prevailing conditions of the water. Higher DO in the middle and south outlet regions (Figure 6c) is indicative of better algal photosynthetic activities and oxidative decomposition of dissolved organic matter. . Low DO at inlet and at North outlet has been discussed earlier (Macrophytes bloom hindering algal photosynthesis). Dissolved oxygen (DO) ranged from 0 mg/l (post monsoon) - 4.83 mg/l (pre monsoon) (Figure 7m). Hypoxic conditions prevailed at inlet, due to raw sewage inflow and stagnant conditions at north outlet (due to the blockage). Hypoxic and anoxic conditions can be correlated with a higher demand for oxygen for bacterial decomposition, which results in higher decomposition rates of organic matter, and consequently creates an anaerobic environment.
Biochemical Oxygen Demand (BOD) is indicative of the quantum of biodegradable organic matter in a lake. BOD values ranged from 44 (November) – 186 (March) mg/l (Figure 7m). A considerable reduction in BOD up to 50% (from 100 mg/l to 50 mg/l) was observed between the inlet and the outlets (Figure 5o) during August-January. However, the extensive coverage of macrophytes during February to May lowered the organic decomposition, and hence the BOD removal. BOD at the inlet was found to be higher in comparison to the outlet BOD throughout the study period (Figure 5o), which shows a gradual reduction of BOD with space and residence time of 5 days. Similar results were reported - 96 mg/l (July- September) in three freshwater bodies at Chennai (Raveen et al., 2008), 49.0 mg/l, in Coimbatore, Tamil Nadu (Dhanalakshmi et al. 2008), 13.8 to 96.8. in two freshwater lakes of Bodan, Andhra Pradesh (Solanki et al., 2007).
Quantum and distribution of the nutrients (such as N and P) are decisive factors for biota in an aquatic ecosystem. Nitrogen, generally found as nitrate, is essential to all algal and aerobic microflora and goes predominantly into the proteins, etc. The extent of N (generally as NO-3) is also used as an indicator of the trophic state of the waterbodies. Higher concentrations of nitrate primarily contribute to the eutrophication of water bodies. Nitrate values (Figure 7p) ranged from 0.03 (March) – 0.96 (July) mg/l. There were no considerable differences between the inlet and the outlet nitrate concentrations (Figure 5p). The overall nitrate levels were below 1 mg/l (mostly due to uptake by macrophytes or by algae/bacteria) and did not vary temporally or spatially in any significant manner comparable to Kapil et al. (2009), Ramachandra et al. (2006), Kumara and Belagali (2008). However, higher values of NO3 N were reported due to agriculture runoff (Bharali et al. 2008), 7.9 mg/l (Srivastava et al. 2007; Edokpayi et al. 2008) 62.85 mg/l, due to enrichment through domestic sewage (Dhanalakshmi et al. 2008). Lower concentration of nitrates during monsoon is due to dilution apart from algal and bacterial uptake (Sharma et al. 1981).
Ammonical N (4 mg/l – 21 mg/l during April) substantiates hypoxic and anoxic conditions prevailing in the lake which is very toxic to biotic components.This is in agreement with the study of Belandur Lake, Bangalore. (Chanakya et al. 2006). Varthur lake behaves like a highly anoxic system mostly at the initial reaches, which makes ammonia the predominant N form with low nitrification and ultimately results in very low nitrate values. Anoxic conditions do not favour NH4 to be nitrified to a large extent. On the other hand, low DO (0 mg/l) and negative redox (-220 to -180 mV) conditions favour denitrification. Similar values were reported for urban lakes in Hosurs 16.25 to 30 mg/l (Karibasappa et al. 2009), Varthur lake (>3 mg/l October) (Ramachandra et al., 2006), 31 mg/l (November) at the inlets and outlets of Bellandur Lake (Chanakya et al. 2006)
Phosphorus an essential part of the biological system is present mostly in the form of inorganic phosphates, which is taken up by the biota (Martin 1987) and also constitutes a limiting factor to eutrophication (Vollenweider et al. 1980). Phosphate values ranged from 0.14 (October) – 3.51 (April) mg/l (Figure 7q). Appreciable differences were found in the inlet and outlet P concentrations (Figure 5n), during the summer months. Higher values during dry seasons may be attributed to lower algal activities (due to macrophyte cover) and to resuspension of sediment phosphorus leading to release of mineral phosphate accumulated in sediments (Ryding and Rast 1994) Lower levels of phosphate are reported in lakes with higher phytoplanktonic biomass (Parinet et al., 2004).
Lower P concentrations during the monsoon could be attributed to dilution (due to runoff), enhanced algal activities in the absence of macrophyte cover. Higher P values in July may be due to runoff in addition to. Higher values of phosphates were observed during the premonsoon (Bharali et al. 2008; Kapil et al. 2009), implicating evaporation losses coupled with the release of P from sediments (Hujare, 2008) and decayed plankton (phyto and zoo) wastes (Heron, 1961). Higher values were reported in Madivala lake (Ramachandra et al. 2001) and urban lakes in Hosur (0.2 mg/l – 3 mg/l - (Karibasappa et al. 2009)).
BOD decreased from the inlet to the outlet (Figure 5o) in the monsoon and post monsoon period (6 months) highlighting the decline of organic content as. This coincides with the low macrophyte coverage, availability of large oxic zone (evident from DO at mid day as well as in the evening). Also, aerobic decomposition coupled with functioning of algal photosynthetic activities enhanced DO levels while lowering BOD. On the other hand, BOD reduction is very poor with dense macrophyte cover (late winter and summer months), with higher anaerobic conditions. This illustrates that lake would function as an anaerobic (upper reaches) – aerobic (lower reaches) lagoon system while bringing the desirable utility of sewage treatment to an appreciable level. Attempts, therefore, need to be made to increase the efficacy of conversion as well as water purification, leading finally to a sustainable technology that is applicable to a large part of India and the developing world.
It may be estimated that at about 100 g TS of waste/capita/day entering the sewage system, the loading rate may be estimated to be 0.125 g TS/l/d and about 0.2 g BOD/l/d at the inlet, which is close to the functional limit for typical lagoons. On the other hand, when one considers the maximum potential of the anaerobic/aerobic systems, higher loading rates and higher conversion rates are possible. There is thus a need to further examine the potential for higher quality of water at the outlet to enable the recycling and reuse of water in the future. In order to make this more sustainable, the extent of the harvest and the reuse of plant nutrients for the system need to be examined. The macrophytes and the algae together with wetland vegetation have an important role in regulating the amount of nutrients. The contribution of macrophytes and phytoplankton in removing nutrients in these sewage enriched systems varies with the nature of the effluent and the age of the wetland in addition to other environmental factors like sunlight.