MATERIALS AND METHODS
Study area and its characteristics
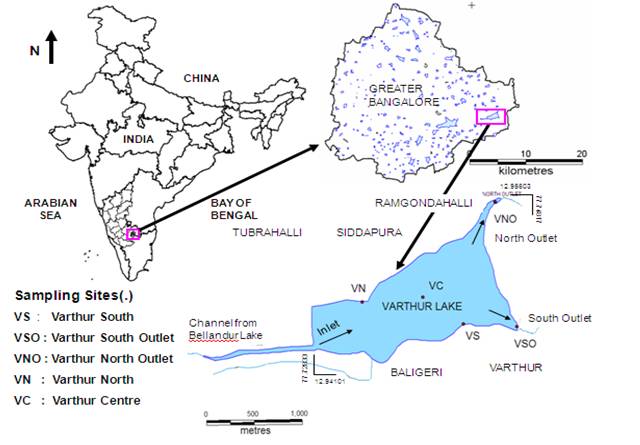
Varthur Lake (12°57’24.98” - 12°56’31.24” N, 77°43’03.02” - 77°44’51.1”E), is the second largest fresh water body in Bangalore built by the Ganga Kings over a thousand years ago (Figure 1) for domestic and agricultural uses. It covers a water-spread area of 220 ha (mean depth 1.1m, Figure 2). It is part of a series of connected and cascading water bodies. The Varthur lake catchment has seen large scale land use changes after 2000, consequent to the rapid urbanization process in the region. Now the lake receives inadequately treated sewage of about 500 million liters per day (MLD). The average annual rainfall of Bangalore is 859 mm and temperatures vary from 14°C (December to January) to 33°C (Maximum during March to May). There are two rainy periods i.e. from June to September (South-West Monsoon) and November to December (North-East Monsoon). During the rainy periods, fresh water also enters the lake as runoff. Water samples were collected regularly on a monthly basis from five predetermined sampling points to represent inlets, outlets and midpoints (Figure 1).
These locations were confirmed by using a hand-held GPS (Garmin 48), which was mapped on to the earlier spatial map (of 2002). From a hand-held GPS survey carried out as part of the study, it was confirmed that the shape and water-spread area has not changed drastically (Figure 2). The lake had a varying extent of floating macrophytes during different seasons. The presence of water hyacinth impeded the use of boats for sampling water quality all over the lake in all seasons. Only a sample closer to shore could be reliably sampled at specific times of day during the year-long study as the wind-induced drift of floating macrophytes on the lake made time-specific sampling of all the points unfeasible. Figure 3 illustrates the spatial extent of macrophytes in March as compared to December. A false colour composite (FCC) was generated using geo-referenced LANDSAT data (of 30 m spatial resolution) for December, and LISS III - IRS data (of 23 m) for March. The lake had less of a macrophyte cover during November – December due to the north east monsoon run off with human interventions (pushing macrophytes downstream). Macrophytes cover about 70-80% of the water-spread area during summer, as is evident from the March FCC.
Figure 1. Varthur lake, Greater Bangalore, India with sampling locations

Figure 2. Depth profile of Varthur lake

Figure 3a). FCC of LANDSAT (30 m) Figure 3b). LISS III-IRS (23 m)

Water sampling and analysis
Water samples were collected in the last week of every month during July08 - June09 from five sampling sites (Figure 1) to examine the influent and the effluent water quality. Care was exercised to ensure that the sampling bottles were free of any contaminants. These bottles were treated with 10% HNO3 and subsequently washed with distilled water. Grab sampling was followed at all points. On site measurements include estimation of pH (pH probe), water and ambient temperature (lab thermometer), TDS (TDS probe), conductivity (conductivity probe), dissolved Oxygen (Iodometry), and transparency (Secchi disc). The samples were then carried to the lab and were analyzed for various parameters according to Standard Methods(APHA AWWA WEF,
1998). Water samples were analyzed for total alkalinity (titrimetry), total hardness, Ca, Mg (complexometric titration), Na, K (flame photometer), chlorides (argentometric method), nitrates (phenol disulphonic acid method), phosphates (stannous chloride method), chemical oxygen demand (dichromate oxidation with open reflux), and biochemical oxygen demand (5 day BOD) day BOD).