|
RESULTS AND DISCUSSION
Land use Land Cover analysis:
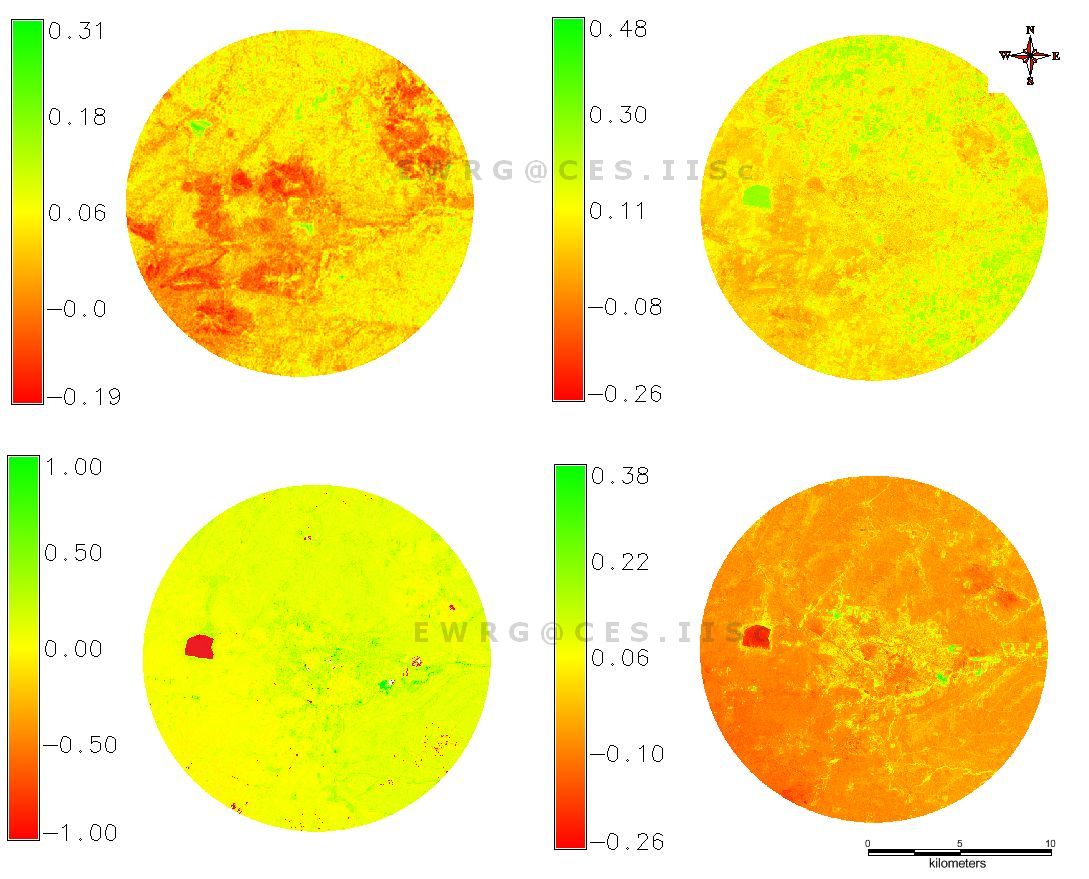
Land cover analysis: Vegetation cover of the study area assessed with the temporal remote sensing data through NDVI is given in Figure 4. NDVI values indicate the spatial extent of vegetation and non-vegetation in the region. This is based on the reflectances of earth features (such as trees, agriculture, and scrub vegetation) which have higher values in Near IR region. The area under vegetation in 1973 is 57.53% mainly composed of cultivated vegetative area and the balance are open soil. During 1973-2001 there was an increase in the area under cultivation and some increments in urban pockets evident from the land cover of 2001, 2005 and 2010. Land use investigation was carried out to understand the dynamics under respective land use categories. Temporal NDVI values are listed in Table 4.
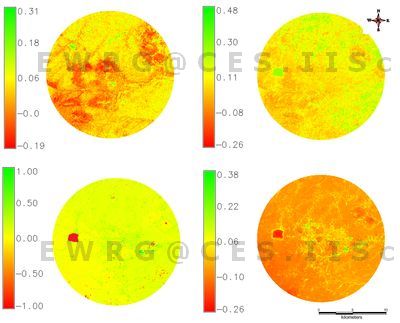
Figure 4: Temporal Land cover changes during Past three Decades
Table 4: Temporal Land cover details
| Year |
Vegetation (%) |
Non-Vegetation (%) |
| 1973 |
57.51 |
42.47 |
| 2001 |
94.87 |
5.13 |
| 2005 |
94.8 |
5.2 |
| 2010 |
93.7 |
6.27 |
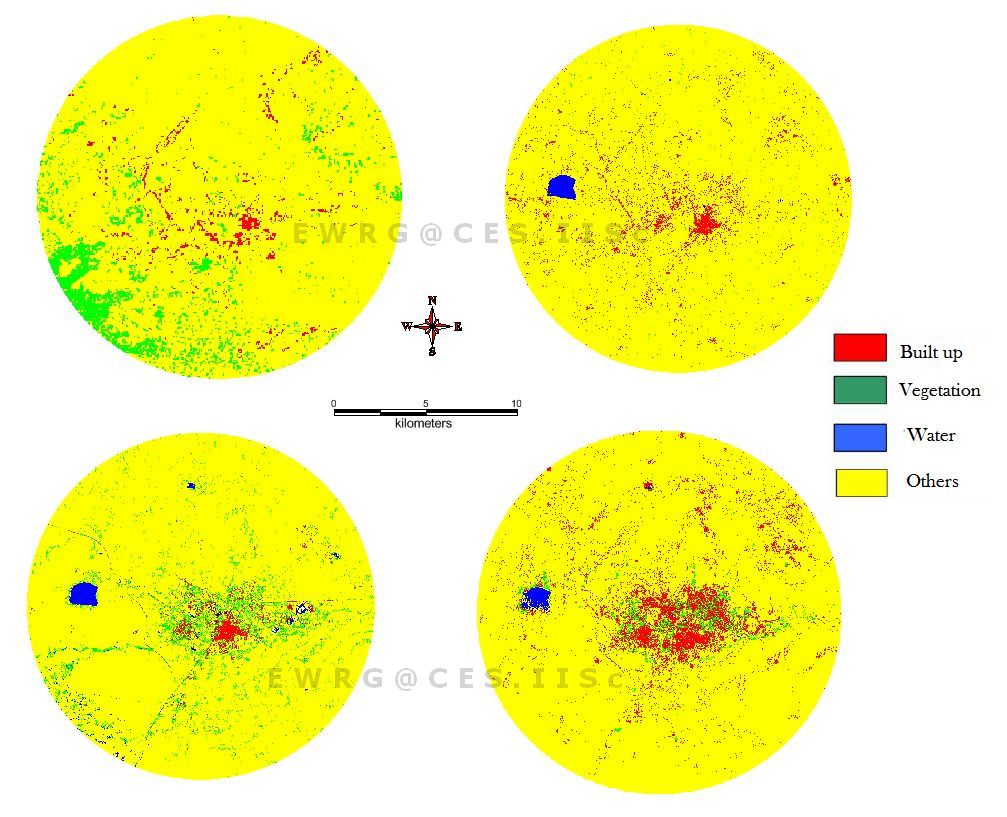
Land use analysis: Land uses assessed for the period 1973 to 2010 using Gaussian maximum likelihood classifier are listed Table 5 and in figure 5. The overall accuracy of the classification ranges from 78% (1973), 86% (2001), 84% (2005) to 89% (2010) respectively. Kappa statistics and overall accuracy was calculated and is as listed in Table 6. There has been a significant increase in built-up area during the last decade evident from table 5. There has been a decrease in tree vegetation cover in the region during the past four decades. Significant increase in other land use categories including urban class was observed.
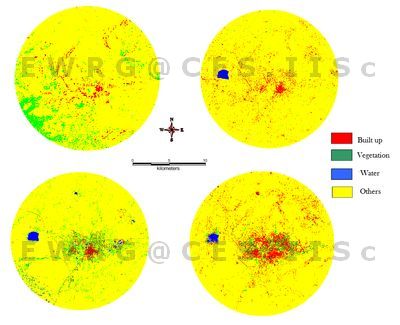
Figure 5:Classification output of Bellary
Table 5: Temporal land use details for Bellary
| Land use |
Urban |
Vegetation |
Water |
Cultivation and others |
| Year |
| 2010 |
7.42 |
0.48 |
2.04 |
90.07 |
| 2005 |
4.23 |
0.92 |
4.73 |
90.12 |
| 2001 |
2.64 |
0.41 |
2.01 |
94.94 |
| 1973 |
2.12 |
4.61 |
2.35 |
90.92 |
Table 6: Kappa statistics and overall accuracy
| Year |
Kappa coefficient |
Overall accuracy (%) |
| 1973 |
0.69 |
78.32 |
| 2001 |
0.84 |
86.94 |
| 2005 |
0.82 |
84.53 |
| 2010 |
0.86 |
89.69 |
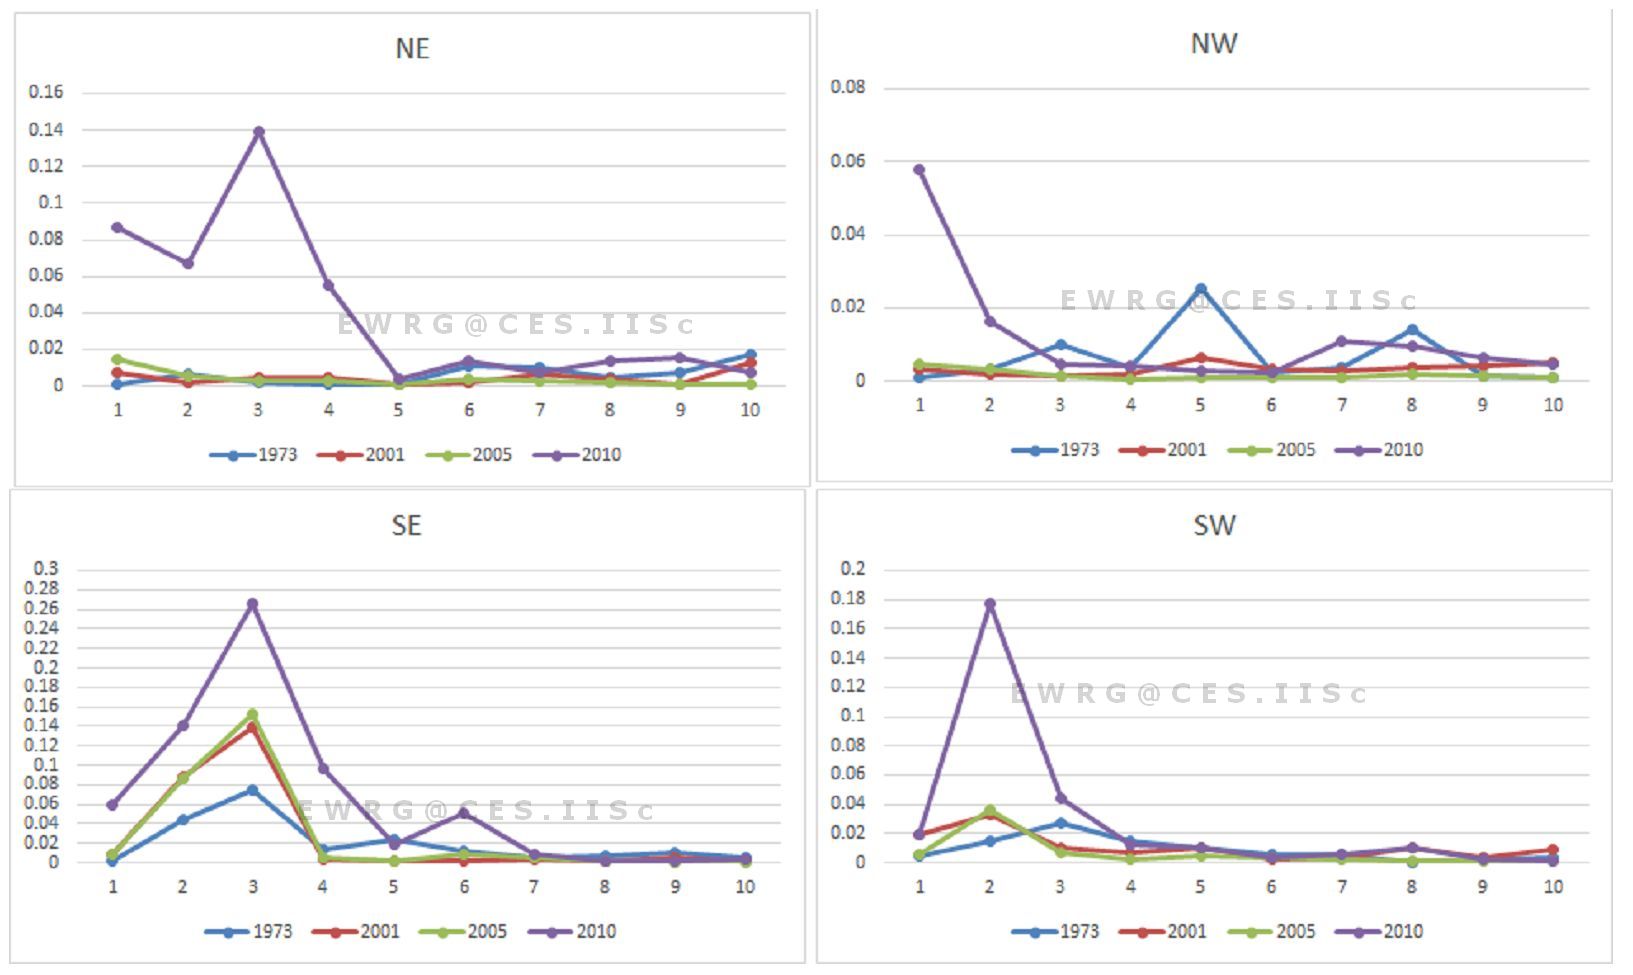
Shannon’s entropy: The entropy is calculated considering 10 gradients in 4 directions and are listed in table 7. The reference value is taken as Log (10) which is 1 and the computed Shannon’s entropy values are inching closer to the threshold value, indicating tendency of sprawl. Consistently increasing entropy values from 1973 to 2010 shows the tendency of dispersed growth of built-up area in the city with respect to 4 directions as we move towards the outskirts and this phenomenon is most prominent in SE and NE directions.
Table 7: Shannon Entropy Index
|
NE |
NW |
SE |
SW |
| 2010 |
0.37 |
0.32 |
0.389 |
0.33 |
| 2005 |
0.23 |
0.25 |
0.26 |
0.24 |
| 2001 |
0.1 |
0.09 |
0.12 |
0.14 |
| 1973 |
0.04 |
0.03 |
0.08 |
0.06 |
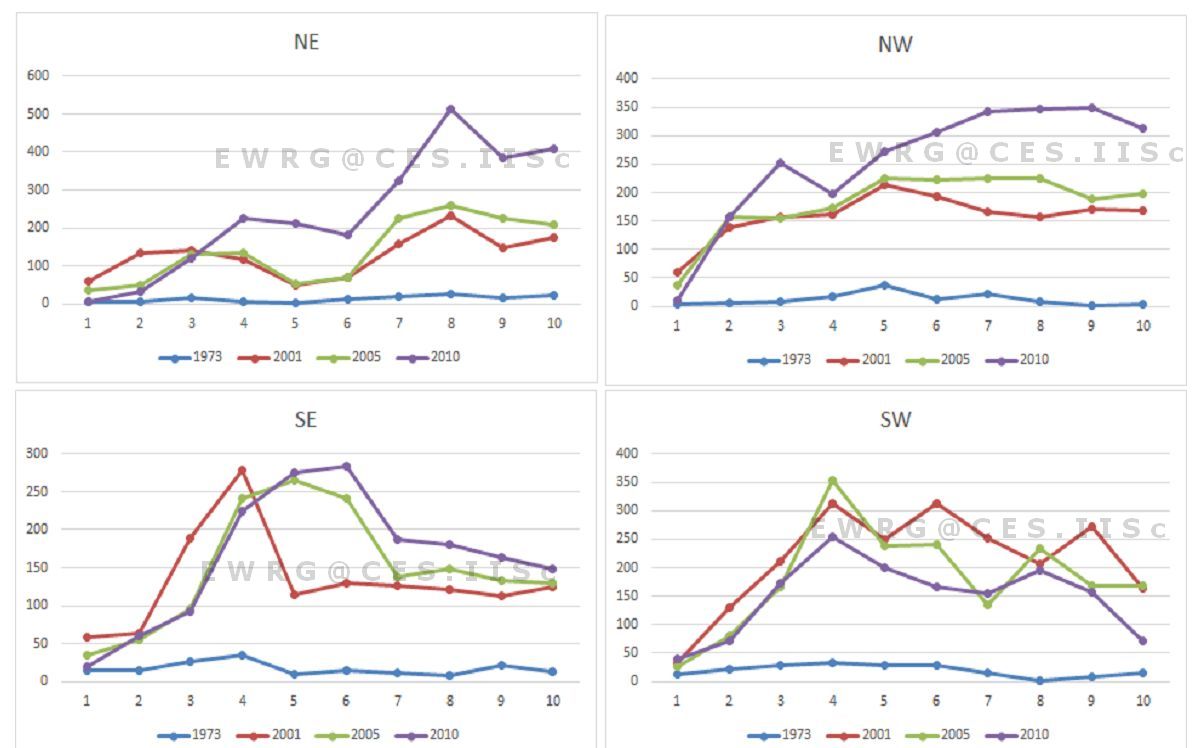
Spatial patterns of urbanisation: Spatial dynamic pattern of urban growth was analysed for 4 decades using eight landscape level metrics that were computed zone wise for each circle of 1 km radius. These metrics are discussed below:
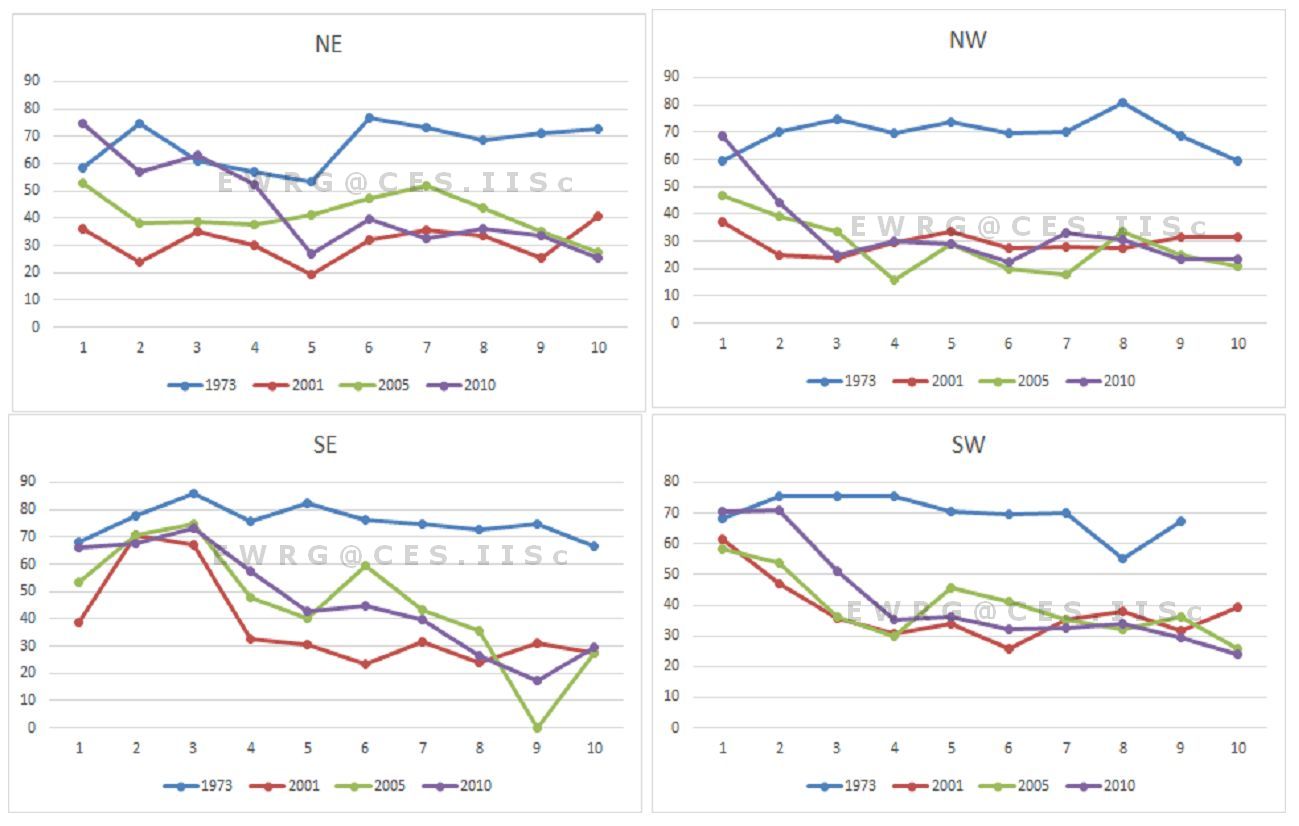
Number of Urban Patch (Np) is a landscape metric indicates the level of fragmentation and ranges from 0 (fragment) to 100 (clumpiness). Figure 6a illustrates the temporal dynamics of number of patches. Increase in number of patches indicates the land fragmentation, while decline in patches indicates the fragmented landscape forming a single land use patch. As observed from the figure, urban patches are least in the landscape in 1970’s as the growth was concentrated on at the city center. In 2000’s Bellary city saw a gradual increase in the number of patches, which can be understood as features of fragmented landscape, further in 2010, these patches are increasingly forming a single patch at the center during 2010 indicative that the urban area forming a single clump patch destroying all other land uses, but the case in the buffer regions has been indicative of higher fragmentation during the latter years. Clumped patches at center are more prominent in NE and SE directions and patches are agglomerating to a single urban patch.
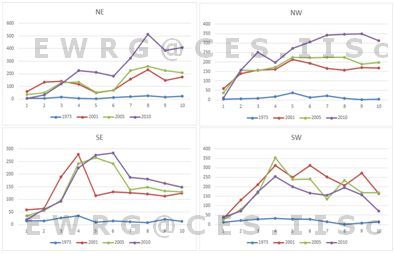
Figure 6a: Number of urban patches (zonewise, circlewise)
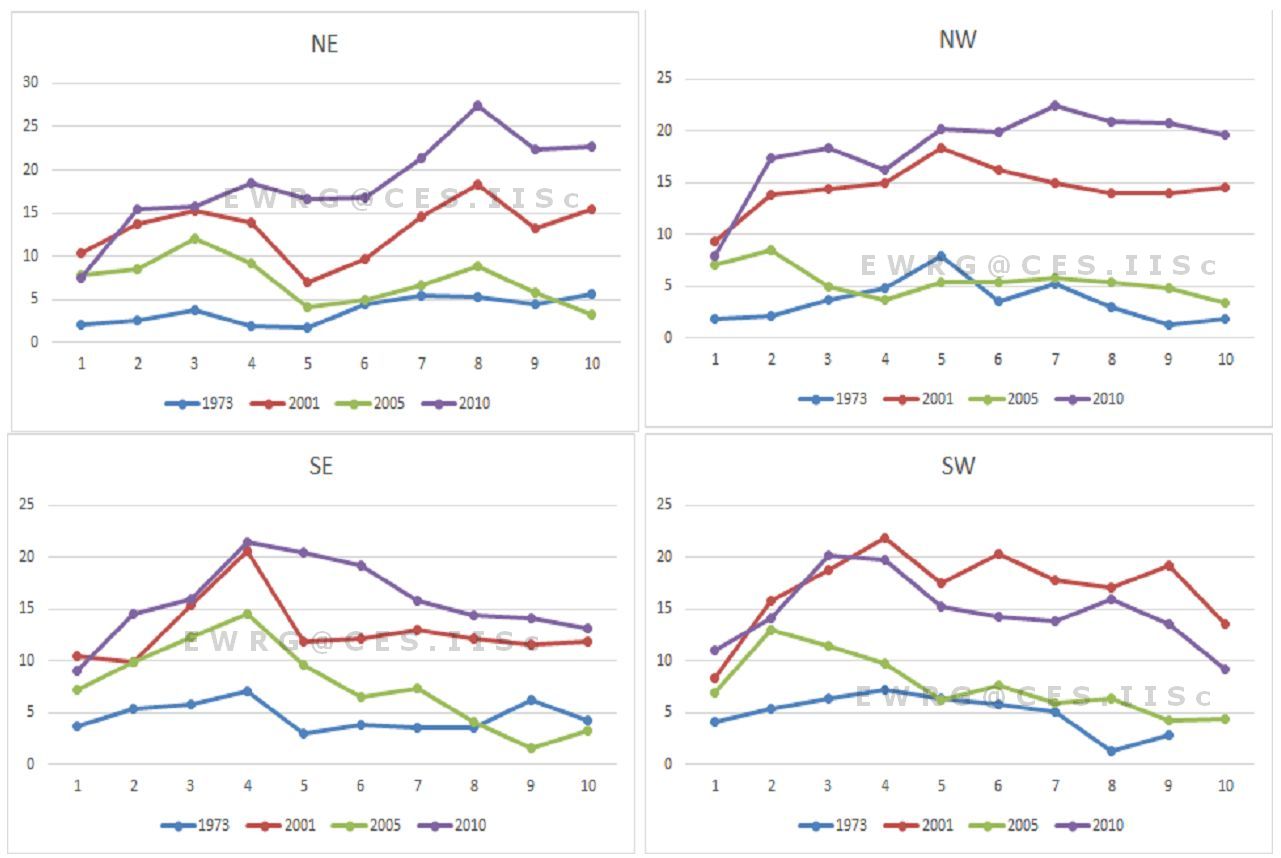
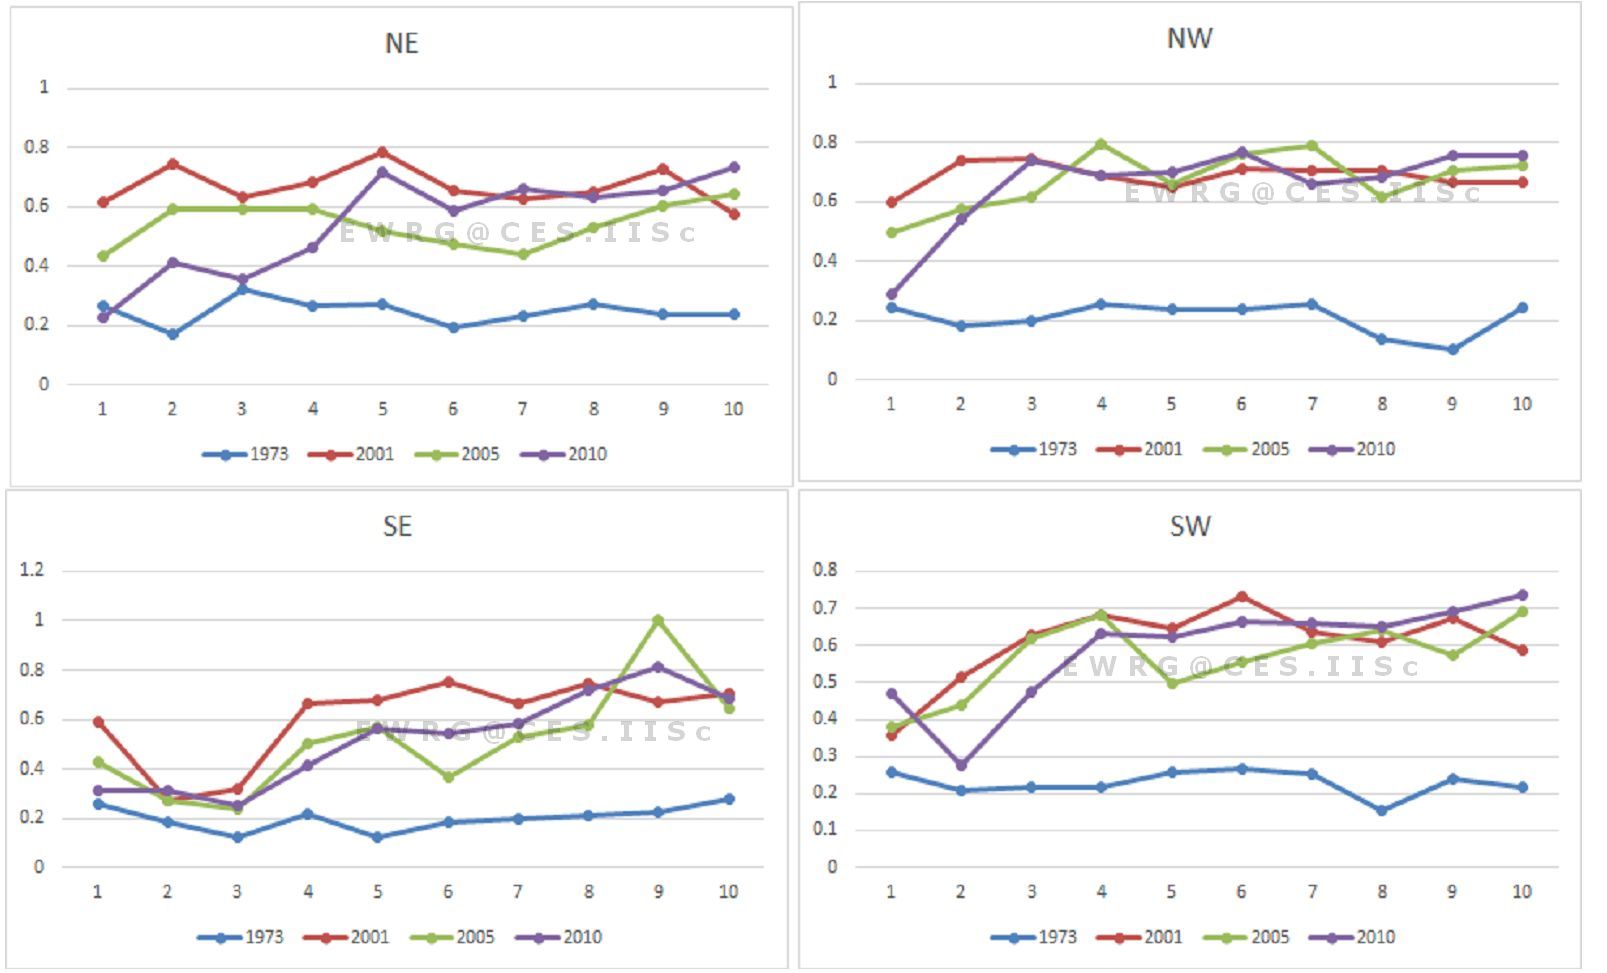
Landscape Shape Index (LSI): LSI equals to 1 when the landscape consists of a single square or maximally compact (i.e., almost square) patch of the corresponding type and LSI increases without limit as the patch type becomes more disaggregated. Results (Fig 6b) indicate that there were low LSI values in 1973 as there were minimal urban areas and were concentrated in the center. The city since 2001 has been experiencing dispersed growth in all direction and in every gradient, towards 2010 it shows aggregating urban land use at the center forming a simple shaped single patch as the value is close to 1, whereas, the values of LSI are very high in the outskirts indicating a complex shaped growth with also is indicative of fragmented landscape in the buffer zone.
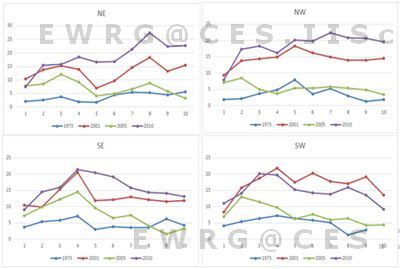
Fig 6b: Landscape Shape index – zonewise, circlewise
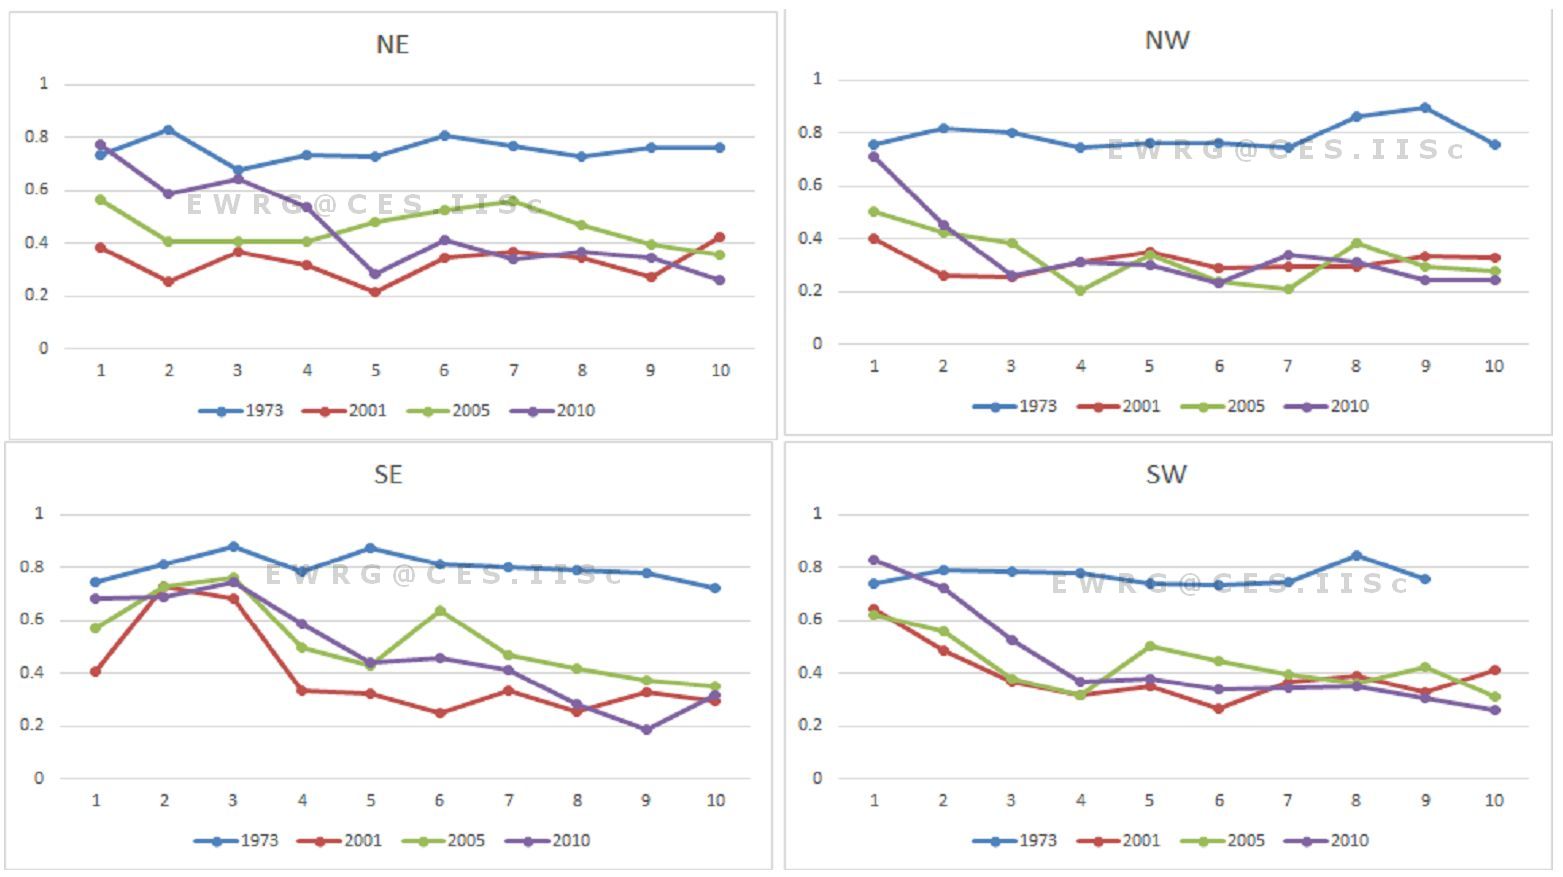
Normalized Landscape Shape Index (NLSI): NLSI is 0 when the landscape consists of single square or maximally compact almost square, it increases as patch types becomes increasingly disaggregated and is 1 when the patch type is maximally disaggregated. Results (Fig 6c) indicate that the landscape post 2000 is fragmented and in 2010, the landscape has a highly fragmented urban class in the buffer region and is aggregated class in the center, conforming to the other landscape metrics. Clumpiness index equals 0 when patches are distributed randomly, and approaches 1 when the patch type is maximally aggregated. Clumpiness exhibit similar temporal trends and highlights that the center of the city is more compact in 2010 with more clumpiness and aggregation in NW and NE directions. In 1973 the results indicate that there were a small number of urban patches existing in all direction and in every circle. Post 2000’s and in 2010 large number of urban patches are close to each other almost forming a single patch especially at the center and in NW and NE direction in different gradients (Fig 6d). Lower values of these metrics in the outer circles indicate that there is a tendency of sprawl in the outskirts since non clumped patches exist in this region.
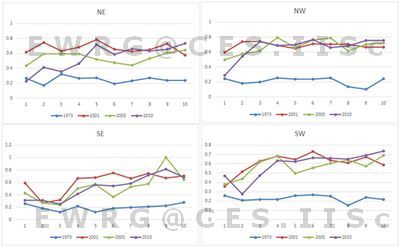
Fig 6c: Normalised Landscape Shape index – zonewise, circlewise
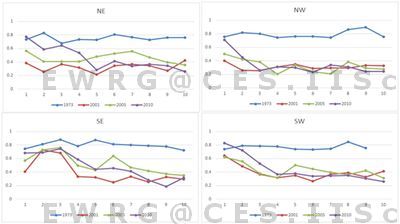
Figure 6d: Clumpiness – zonewise, circle wise
Percentage of like adjacencies (Pladj) is the percentage of cell adjacencies involving the corresponding similar patch type those are adjacent. The analysis of results of this metrics also indicates (Figure 6e) clumped urban single land use growth at the city center in 2010, adjacent patches of urban are much closer and are forming a single patch in 2010 and outskirts are relatively sharing different internal adjacencies with patches not immediately adjacent but have since these have a relatively small adjacency value it can be understood as a trend to become adjacent to each other, which is also indicative of sprawl.
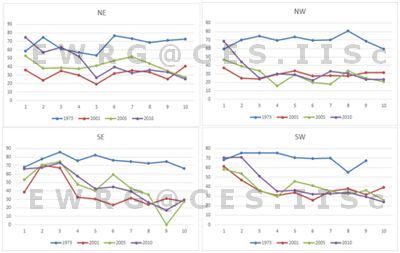
Figure 6e: Zone and circle wise: Pladj
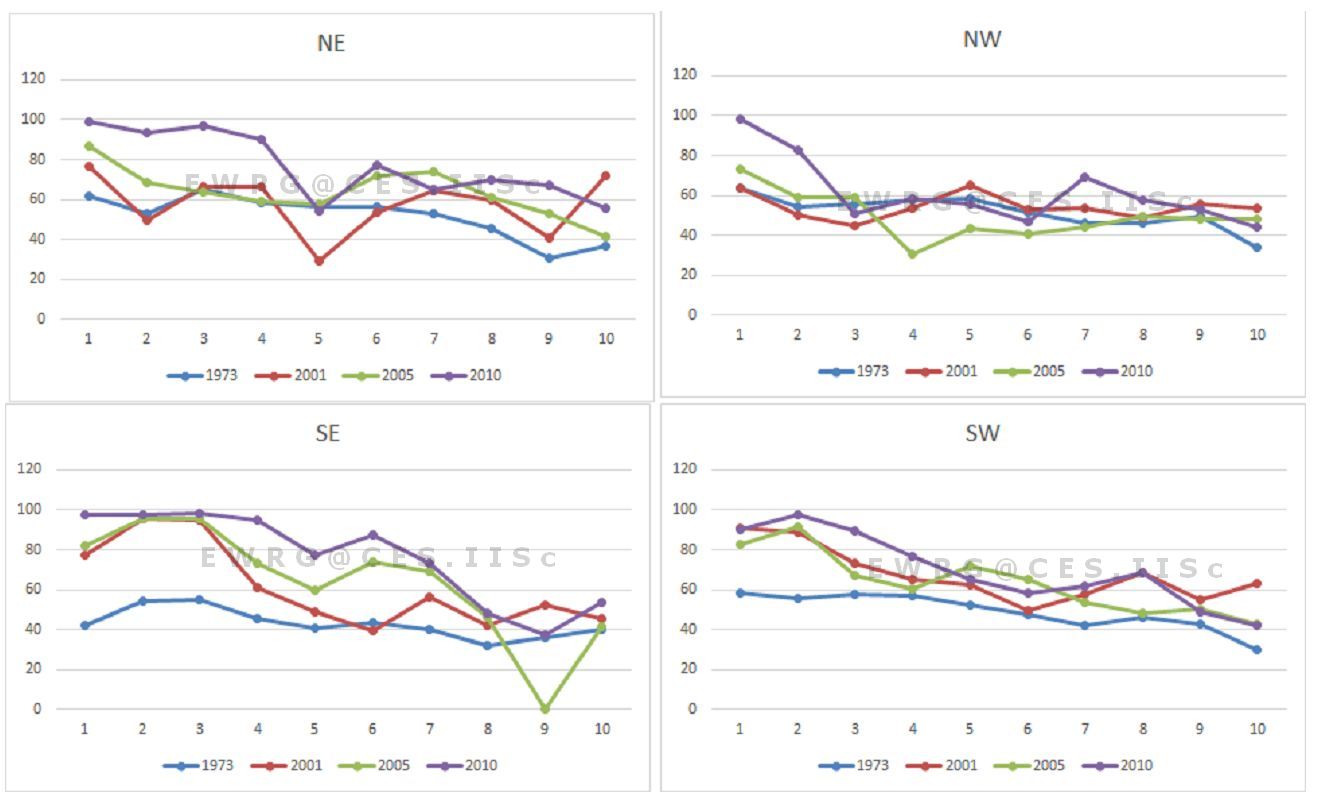
Patch cohesion index measures the physical connectedness of the corresponding patch type. Figure 6f describes the results of the analysis of physical connectedness of the urban patch with the higher cohesion value (in 2010) indicating that the urban count is higher in the considered study region. Lower values in 1973 illustrate that the urban patches were rare in the landscape.
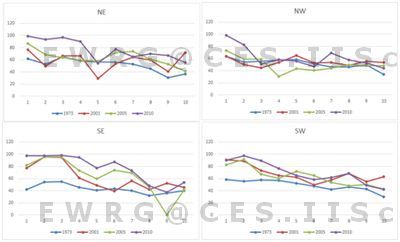
Figure 6f: Cohesion Index
Largest Patch Index (LPI): This metric reveals information about the largest patches in the Landscape and its native existence. Urban patch again counted as a largest patch in 2010 in the central area of Bellary, whereas the buffer zones had a mixture of other patches. Figure 6g is illustrative of results of this analysis.
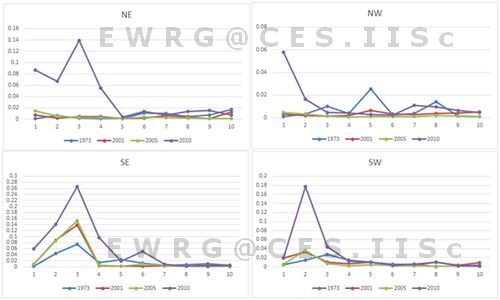
Figure 6g: Largest patch index
The trends of landscape metrics aided in quantifying the density and the shape of the urban growth, which is useful in the regional planning for provision of basic amenities and infrastructure in the region.
|