|
RESULTS AND DISCUSSION
Physico-chemical Analysis
Table 2 lists the physico - chemical parameters of water samples and Table 3 gives the maximum permissible limits (MPL) and the samples which deviate from MPL.
Table 2: Physico - chemical analysis of collected water samples
| Sampling code |
DO
ppm |
Water temp
°C |
pH |
Turbidity
NTU |
TDS
ppm |
Chlorides (Cl-)
ppm |
Sodium (Na+)
ppm |
Potassium ( K+)
ppm |
Alkalinity
ppm |
Total hardness
ppm |
Ca
ppm |
Mg
ppm |
Nitrate
ppm |
Phosphate
ppm |
| 1 |
1.73 |
28.7 |
4.5 |
1.65 |
51 |
19.9 |
13.1 |
1.3 |
0.8 |
20 |
3.21 |
0.97 |
0.09 |
0.02 |
| 2 |
1.06 |
28.6 |
4.4 |
0.72 |
465 |
258 |
169 |
7 |
0.4 |
80 |
14.4 |
10.7 |
0.06 |
0.03 |
| 3 |
5.01 |
27 |
3.8 |
2.2 |
1200 |
593 |
542 |
4 |
0.8 |
168 |
40.08 |
16.57 |
0.11 |
0.13 |
| 4 |
3.24 |
28.4 |
4.1 |
3.61 |
947 |
557 |
26 |
6 |
0.4 |
132 |
19.24 |
20.47 |
0.1 |
0.01 |
| 5 |
3.04 |
28.3 |
4.6 |
1.26 |
78 |
36.9 |
31.6 |
1.2 |
0.8 |
32 |
3.21 |
5.85 |
0.05 |
0.01 |
| 6 |
1.18 |
29.8 |
4.9 |
2.49 |
167 |
90.9 |
60.4 |
1.7 |
0.8 |
44 |
12.83 |
2.92 |
0.11 |
0.02 |
| 7 |
2.96 |
28.5 |
4.7 |
0.89 |
142 |
73.8 |
47.5 |
1.7 |
0.8 |
36 |
8.02 |
3.9 |
0.14 |
0.01 |
| 8 |
2.68 |
27.4 |
5.1 |
4.69 |
197 |
105 |
64.2 |
1.4 |
1.2 |
44 |
9.62 |
4.87 |
0.11 |
0.02 |
| 9 |
5.38 |
27.1 |
5.4 |
0.65 |
96 |
28.4 |
27.8 |
1.4 |
0.8 |
12 |
3.21 |
0.97 |
0.22 |
0.01 |
| 10 |
7.4 |
27 |
5.7 |
21.4 |
56 |
11.4 |
7.7 |
1.7 |
0.8 |
16 |
4.81 |
0.97 |
0.22 |
0.04 |
| 11 |
3.93 |
28 |
4.3 |
0.46 |
43 |
5.68 |
2.8 |
0.4 |
0.8 |
24 |
1.6 |
4.87 |
0.15 |
0.01 |
| 12 |
3.9 |
28 |
5.4 |
104 |
454 |
1385 |
595 |
10 |
0.8 |
516 |
59.3 |
89.7 |
0.1 |
0.03 |
| 13 |
3.3 |
27.7 |
5.6 |
9.81 |
352 |
193 |
96 |
3 |
0.8 |
76 |
4.81 |
15.6 |
0.07 |
0.21 |
| 14 |
0.74 |
29.6 |
6.1 |
176 |
2304 |
1747 |
1755 |
32.5 |
2 |
636 |
81.76 |
105.3 |
0.13 |
0.02 |
| 15 |
7.6 |
26.7 |
5.4 |
36.2 |
4928 |
3862 |
915 |
30 |
0.04 |
580 |
72.14 |
97.46 |
5.8 |
2.37 |
| 16 |
4.34 |
28..6 |
4.1 |
3.44 |
540 |
483 |
299 |
2 |
0.5 |
86 |
15.23 |
11.69 |
0.2 |
1.77 |
| 17 |
7.9 |
27.6 |
2.9 |
43 |
8976 |
4672 |
380 |
30 |
0 |
1520 |
160.3 |
282.6 |
9.3 |
1.18 |
| 18 |
5.88 |
27.6 |
3.6 |
26 |
4120 |
3238 |
300 |
25 |
0.07 |
580 |
88.18 |
141.3 |
7 |
1.69 |
| 19 |
3.71 |
28 |
5.8 |
4.79 |
116 |
36.9 |
35.1 |
6.4 |
0.5 |
60 |
23.25 |
0.49 |
4.5 |
1.7 |
| 20 |
2.94 |
28.4 |
6.6 |
65.6 |
156 |
5.68 |
25 |
0 |
3.2 |
88 |
3.21 |
19.49 |
0.26 |
0.02 |
| 21 |
3.42 |
28.8 |
4.1 |
1.45 |
81 |
11.4 |
7.6 |
0.9 |
0.8 |
16 |
3.21 |
1.95 |
0.15 |
0.14 |
| 22 |
8.81 |
26.1 |
5.7 |
22 |
118 |
28.4 |
27.2 |
18.1 |
1.6 |
40 |
14.43 |
0.97 |
0.13 |
0.03 |
| 23 |
3.4 |
27.6 |
5.3 |
0.65 |
78 |
17 |
25.7 |
1.5 |
1.2 |
44 |
8.02 |
5.85 |
0.16 |
0.02 |
| 24 |
4.24 |
28.6 |
4.8 |
2.74 |
53 |
14.2 |
7.2 |
1 |
0.8 |
16 |
4.81 |
0.97 |
0.18 |
0.07 |
| 25 |
2.37 |
30.6 |
4.8 |
0.52 |
41 |
17 |
7.2 |
1.7 |
1.2 |
20 |
6.41 |
0.97 |
0.14 |
0.02 |
| 26 |
2.83 |
28.5 |
3.9 |
0.35 |
63 |
14.2 |
9.5 |
1.1 |
0.4 |
12 |
3.21 |
0.97 |
0.15 |
0.01 |
| 27 |
4.8 |
28 |
4.9 |
0.77 |
37 |
8.52 |
2.2 |
0.9 |
0.6 |
20 |
6.41 |
0.97 |
0.15 |
0.01 |
| 28 |
3.73 |
27.7 |
5.9 |
1.35 |
145 |
28.4 |
14.8 |
4.8 |
1.6 |
60 |
19.24 |
2.92 |
0.14 |
0.04 |
| 29 |
4.2 |
27.9 |
6.8 |
4.3 |
289 |
93.7 |
13.4 |
12.9 |
1.8 |
68 |
20.04 |
5.36 |
0.3 |
2.3 |
Table 3: Various parameters analyzed and range of their values in the collected water samples of study region
| PARAMETERS |
RANGE |
Maximum permissible limits as per WHO |
No. of samples within permissible limits |
No. of samples above permissible limits |
| DO (ppm) |
0.74 to 8.81 |
>5 |
22 (75.9%) |
7 (24.1%) |
| pH |
2.9 to 6.8 |
6.5-9 |
2(6.9%) |
27 (93.1%) |
| TURBIDITY (NTU) |
0.35 to 176 |
10 |
21 (72.4%) |
8 (27.6%) |
| TDS (ppm) |
37 to 8976 |
1500 |
25 (86.2%) |
4 (13.8%) |
| CHLORIDES (ppm) |
5 to 4672 |
1000 |
24 (82.8%) |
5 (17.2%) |
| SODIUM (ppm) |
2.2 to 1755 |
200 |
22 (75.9%) |
7 (24.1%) |
| POTASSIUM (ppm) |
0 to 32.5 |
10 |
23 (79.3%) |
6 (20.7%) |
| ALKALINITY (ppm)) |
0 to 3.2 |
600 |
29 (100%) |
0 |
| TOTAL HARDNESS (ppm) |
12 to 1520 |
600 |
27 (93.1%) |
2 (6.9%) |
| CALCIUM- Ca (ppm) |
1.6 to 160 |
200 |
29 (100%) |
0 |
| MAGNESIUM- Mg (ppm) |
0.49 to 282 |
100 |
26 (89.7%) |
3 (10.3%) |
| COD (ppm) |
2 to 78 |
10 |
23 (79.3%) |
6 (20.7%) |
| NITRATE(ppm) |
0.05 to 9.3 |
45 |
29 (100%) |
0 |
| PHOSPHATE (ppm) |
0.01 to 2.4 |
5 |
29 (100%) |
0 |
Dissolved Oxygen: The amount of dissolved Oxygen (DO) in an aquatic system is an indicator of its health as DO helps in the respiration. The presence of organic wastes imposes a very high oxygen demand on the receiving water leading to oxygen depletion with severe impacts on the water ecosystem. The effluents also constitute heavy metals, organic toxins, oils, volatile organics, nutrients and solids. TPP effluents cause temperature difference in the water and reduce the available oxygen. The DO of the analyzed water samples varied between 0.74 to 8.81 ppm. Only 7 samples had DO more than 5ppm. It decreased with increasing temperature similar to earlier reports (Selvin et.al, 2010). Lower DO values are indicative of fast oxidizing chemicals in the immediate vicinity. DO in the surface waters were substantially low compared to the ground water systems, due to effluents discharge. Reduced aquatic biodiversity in the nearby streams and ponds further corroborates of lower DO, similar to Bholakpur (Rasheed et.al, 2011).
Turbidity: Turbidity in water is caused by suspended and colloidal matter such as clay, silts, finely divided organic and inorganic matter, plankton and other microscopic organisms, waste discharge and sediments from erosion. Turbidity values of the collected samples ranged from 0.35 to 176 NTU beyond permissible limit. Among the collected samples, 8 samples mostly found in the immediate vicinity of the TPP were above the acceptable range. The stream water (sample no 8) showed extremely high turbidity (176 NTU) due to direct disposal of black coal mix effluent. Sample 15 was observed to be a finely suspended red colour solution with turbidity values of 26 NTU while the nearby stream was having a turbidity value of 36 NTU. This is due to the direct discharge of effluents to streams and subsequent leaching to ground water resources. Turbidity decreased with increasing distance from the Power plant. The turbidity of well water sample (sample no 20) near to the ash pond was about 65 due to leaching of ions from ash pond and sediments from erosion caused due to improper lining of ash pond.
Total Dissolved Solids (TDS): TDS affect the water quality in myriad of ways impacting the domestic water usage for cleaning, bathing etc as well as drinking purposes (APHA, 1995). Surface as well as groundwater with high dissolved solids are of inferior flavor and induce an unfavorable physiological reaction to the dependent population. The TDS values in the samples analysed, ranged from 37 to 8970 ppm across all locations. Among them, 4 samples were above the desirable limit. The water samples 17 and 18 (well and pond) which is in core region has maximum values ranging from 4120 - 8976 ppm. The stream water sample (15) had high TDS of 4928 ppm due to effluents rich surface run off as well as salt deposits. This would eventually result in higher build up of total solids in surface and ground water making it more unpalatable and hard to be used for domestic purposes. The results are comparable to ground water samples from 13 stations around a distance of 10 km and closer to ash pond at Vijayawada Thermal Power station, Andhra Pradesh (Suresh et.al, 1998).
Chlorides: Chlorides are essentially potential anionic radical that imparts chlorosity to the waters and considered as a pollution indicator (Zafar, 1964 and Kumar 1995). An excess of chlorides leads to the formation of potentially carcinogenic and chloro-organic compounds like chloroform, etc. Chloride values in samples ranged from 5 to 4670 ppm. Among the collected samples, 5 samples exceeded the permissible limits. Samples from well (12), pond (17, 18) and streams (14, 15) from Yellur village (within 2 km from TPP) showed very high chloride values due to the discharge of hyper concentrated salt solutions and effluents from the TPP. High chloride content has deleterious effect on metallic pipes and agricultural crops. Certain areas within the core zone are affected by chloride contamination due to the discharge of effluents. Similar results were reported in Satpura reservoir due to the effluents discharged from Thermal Power Plant at Sarni, Madhya Pradesh (Sanhitha et.al, 1997) and within 10 km of Vijayawada Thermal Power Station (Suresh et.al, 1998). Chloride values showed decreasing trend as moved away from TPP.
Sodium: Sodium (Na) is one of the essential cations that stimulate various physiological processes and functioning of nervous system, excretory system and membrane transport in animals and humans. Increase of sodium ions has a negative impact on blood circulation, nervous coordination, thence affecting the hygiene and health of the nearby localities. According to WHO guidelines the maximum admissible limit is 200 ppm. In this study the concentration of sodium ranged from 2.2 - 1755 ppm (sample 14). Water Samples of wells (3 and 12) were exceeding permissible limits.
Potassium: Potassium (K) is an essential element for both plant and animal nutrition, and occurs in ground waters as a result of mineral dissolution, decomposing of plant materials and also from agricultural runoff. Potassium ions in the plant root systems helps in the cation exchange capacity to transfer essential cations like Ca and Mg from the soil systems into the vascular systems in the plants in replacement with the potassium ions. Incidence of higher potassium levels in soil system affects the solute transfer (active and passive) through the vascular conducting elements to the different parts of the plants. The potassium content in the water samples ranges between 0-32.5 ppm and about six samples were above the permissible limits.
Alkalinity: Alkalinity is a measure of the buffering capacity of water contributed by the dynamic equilibrium between carbonic acid, bicarbonates and carbonates in water. Sometimes excess of hydroxyl ions, phosphate, and organic acids in water causes alkalinity. High alkalinity imparts bitter taste. The acceptable limit of alkalinity is 600 ppm. The water samples analyzed were having lower alkalinities because of acidic environment in the soil systems.
Total hardness: Hardness is the measure of dissolved minerals that decides the utility of water for domestic purposes. Hardness is mainly due to the presence of carbonates and bicarbonates. It is also caused by variety of dissolved polyvalent metallic ions predominantly calcium and magnesium cation although, other cations like barium, iron, manganese, strontium and zinc also contribute. In the present study, the total hardness ranged between 12 to 1520 ppm. Throughout the analysis in the due course of the study, 2 samples were observed to have exceeded the permissible limits of 600 ppm. The pond water sample (17) and nearby stream (8) consistently showed higher values. Earlier studies also report of increased Total hardness values (Suresh et.al, 1998; Sanhitha et.al, 1997).
Calcium: Calcium (Ca) is one amongst the major macro nutrients which are needed for the growth, development and reproduction in case of both plants and animals. The presence of Ca in water is mainly due to its passage through deposits of limestone, dolomite, gypsum and other gypsiferous materials (Manivasakam.N, 1989). Ca concentration in all samples analyzed periodically ranged between 1.6 to 160 ppm.
Magnesium: Magnesium (Mg) in one of the most essential macro nutrients that helps as a co-factor in the enzyme systems and in the central metal ions that constitutes the chlorophyll molecule essential for plant photosynthesis. In this study the concentration of Magnesium ranged from 0.97– 282 ppm. Total 3 samples were above the maximum permissible limits of 50 ppm and are comparable to earlier reports in similar environment (Suresh et.al, 1998; Sanhitha et.al, 1997). This indicated Mg accumulation in the water systems resulting in the increase in overall hardness of water making it unpalatable and unsuitable for any domestic applications.
Nutrients (nitrates and phosphates): Nutrients essentially comprise of various forms of N and P which readily dissolve in solutions that are uptaken by microbes and plant root systems in the form of inorganic mineral ions. Accumulation of N as nitrates and P as inorganic P in aquatic ecosystems causes significant water quality problems due to higher net productivity. Together with phosphorus, nitrates in excess amounts in streams and other surface waters can accelerate aquatic plant growth causing rapid oxygen depletion or eutrophication in the water. Nitrates at high concentrations (10 mg/l or higher) in surface and groundwater used for human consumption are particularly toxic to young children affecting the oxygen carrying capacity of blood cells ( RBC) causing cyanosis (methemoglobinemia). In the present study, nitrate values ranged from 0.05 to 9.3 ppm and phosphate values ranged between 0.01 to 2.4 ppm.
 |
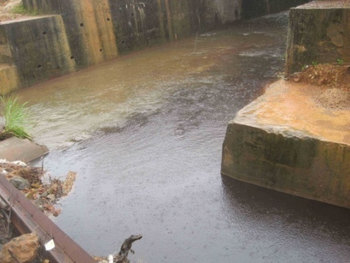 |
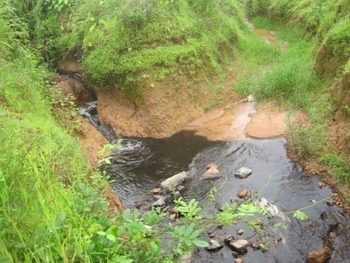
| Figure 3: Effluents from Thermal Power plant mixing with stream water |
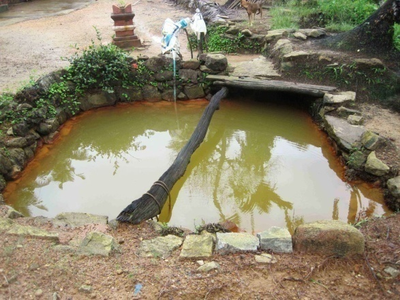
Figure 4: Contaminated open well water
Trace and Heavy metal Analysis
Table 4 gives the account of heavy metals of water samples analyzed from core region and the samples exceeding the maximum permissible limits.
Table 4: Heavy metal analysis of water samples collected from the study region (mg/l)
| Sample |
14 |
18 |
15 |
17 |
2 |
Range |
Maximum permissible limits as per WHO |
No. of samples within permissible limits |
No. of samples above permissible limits |
| Cd |
0.00 |
0.68 |
1.00 |
5.02 |
0.03 |
0-5.02 |
0.003 |
1(20%) |
4(80%) |
| Co |
0.01 |
0.02 |
0.06 |
0.09 |
0.00 |
0-0.09 |
0.01 |
2(40%) |
3(60%) |
| Cr |
0.08 |
0.09 |
0.19 |
0.28 |
0.09 |
0.08-0.28 |
0.05 |
0 |
5(100%) |
| Cu |
0.15 |
0.03 |
0.12 |
0.12 |
0.19 |
0.03-0.19 |
0.05 |
1(20%) |
4(80%) |
| Fe |
4.39 |
11.86 |
14.85 |
94.14 |
1.22 |
1.22-94.14 |
0.3 |
0 |
5(100%) |
| Mn |
0.27 |
3.53 |
3.73 |
8.49 |
0.20 |
0.2-8.49 |
0.5 |
0 |
5(100%) |
| Ni |
0.01 |
0.13 |
0.14 |
0.01 |
0.01 |
0.01-0.14 |
0.02 |
3(60%) |
2(40%) |
| Pb |
0.07 |
0.06 |
0.10 |
0.16 |
0.83 |
0.1-0.83 |
0.01 |
0 |
5(100%) |
| Zn |
7.42 |
0.37 |
0.26 |
0.15 |
4.27 |
0.15-7.42 |
3 |
4(80%) |
1(20%) |
Cadmium: Concentrations of Cadmium ranged from 0 to 5.02 mg/l and are above maximum permissible limits in most samples. Sample 17 (pond water) showed the maximum amount of Cadmium (5.02 mg/ml). These results are comparable to the earlier reports (Baba et.al, 2003, Prashant et.al, 2011, Ahmet et.al, 2004). Cadmium is extremely toxic and accumulates in the kidneys and liver, with prolonged intake at low levels sometimes leading to dysfunction of the kidneys (APHA 1995).
Cobalt: Concentration of Cobalt ranged from 0 to 0.09 mg/l and the sample 17 ( pond water) showed high value of 0.09 mg/l. Cobalt occurs only sparingly in ores usually as the sulfide or the arsenide. It is widely used in alloys of various steels in electroplating in fertilizers and in porcelain and glass. Toxic effect of Co includes loss of body weight and depressed appetite.
Chromium: Chromium is used in alloys in electroplating and in pigments. Chromate compounds frequently are added to cooling water for corrosion control. Hexavalent Chromium compounds have been shown to be carcinogenic by inhalation and are corrosive to tissue (APHA, 1995).The concentration of Chromium was between 0.08 and 0.28 mg/l exceeding the permissible limits illustrate contamination due to the direct discharge of effluents.
Copper: Copper salts are used in water supply systems to control biological growths in reservoirs and distribution pipes. In this study the concentration of Copper ranged between 0.03 and 0.19 mg/l exceeding permissible limits.
Iron: The concentration of Fe ranges from 1.22 to 94.14 mg/l exceeding the permissible limits. Iron may be present in drinking water as a result of the use of iron coagulants or the corrosion of steel and cast iron pipes during water distribution. Acute Fe toxicity causes vomiting, gastroenteritis, haemorrhage, cardiac depression, metabolic acidosis. Fe ingestion in large quantities results in a condition known as heamochromatosis (normal regulatory mechanism do not operate effectively), where in tissue damage results from iron accumulation (WHO 2011).
Manganese: It is a trace element. On exposure to air, groundwater containing Mn will precipitate black MnO2. The presence of manganese in drinking-water, like that of iron, may lead to the accumulation of deposits in the distribution system. At levels exceeding 0.1 mg/l, manganese in water supplies causes an undesirable taste in beverages and stains sanitary ware and laundry (WHO, 2011). The concentration of Mn exceeded the permissible limits in all the samples due to effluent discharge from TPP. Ahmet et.al 2004 reported higher Mn concentrations in ground waters near Yatagan TPP, Turkey.
Nickel: The concentration of Ni ranged between 0.01 and 14 mg/l and about 40% samples showed high Nickel. Possible sources of Nickel contamination in surface water include anthropogenic sources, combustion of fossil fuels, battery wastes, components of steel (Puttaih et.al, 2008; Prashant et.al, 2011).
Lead: Lead in a water supply may come from industrial mine, and smelter discharges or from the dissolution of plumbing and plumbing fixtures. It is toxic by ingestion and cumulative poison. The concentration of Pb ranged from 0.1 to 0.83 mg/l, exceeding permissible limits as reported earlier in well water samples near Yatagan Power Plant (Baba et.al, 2003) and drinking water resources near Anpara and Renusagar Thermal Power Plants (Prashant et.al, 2011).
Zinc: Zinc commonly enters domestic water from deterioration of galvanized iron, disinfection of brass and also from industrial pollution (APHA, 1995). The concentration of Zinc varied from 0.15 to 7.42mg/l. 20% of samples was above the permissible limits.
Analysis of water samples collected from the core region (2 km from TPP) illustrate the contamination of water resources in the surrounding villages Yellur, Nandikur and Padebetu, Santhur and Nadisal due to mismanagement of TPP effluents. The effluents containing heavy metals and trace metals are being released by Thermal Power Plant to the nearby streams, which leach contaminating the ground water resources. The leaching of heavy metals is very high near thermal Power Plants (Prashanth et.al, 2010, Sivakumar and Dutta, 1996, Querol et.al, 1993). Field investigations also revealed stunted growth of saplings (very evident in the TPP’s green belt), drying of leaves, corrosion of metals and resultant damage to tin roofs, dish antennas, transmission lines, railway tracks, fencing of TPP boundary, enhanced respiratory diseases, non-palatable grasses (livestock refrain from feeding on grasses), etc. This is due to deposition of supersaturated saline mist on soil and foliage. The saline mist gets released from the cooling towers, which is locally dispersed by the wind to the nearby localities even up to 2 km. The altitudinal gradient of the location has also enhanced the dispersion. Salt deposition on: 1) foliage has resulted in ‘leaf burn’ as leaf tissue is damaged due to contact with highly ionized salts, 2) crops, has attenuated the yield due to phyto-toxicity, 3) metal fixtures and accessories leading to corrosion due to the formation of metal oxides.
|
