http://www.iisc.ernet.in/
Spatio-temporal dynamics of Urbanising Landscape in twin cities in Karnataka, India
http://wgbis.ces.iisc.ernet.in/energy/
T.V. Ramachandra1,2,3,*                    Bharath H. Aithal1,2
1Energy & Wetlands Research Group, Centre for Ecological Sciences [CES], 2Centre for Sustainable Technologies (astra), 3Centre for infrastructure, Sustainable Transportation and Urban Planning [CiSTUP], Indian Institute of Science, Bangalore – 560012, India.
*Corresponding author:
cestvr@ces.iisc.ernet.in

RESULTS

  1. Land use Land Cover analysis:
    1. Vegetation cover analysis: Both Hubli and Dharwad being dominated by cultivable land area has a huge green area which includes both Green cover and cultivation. Temporal NDVI values are listed in Table IV. Vegetation cover of the study area assessed through NDVI (Figure 4), shows that area under vegetation has declined from 97% (1989) to 78% (2010) in Hubli and from 98% (1989) to 86% (2010) in Dharwad.

    2. Figure 4a: Temporal Land cover changes in Hubli during Past three Decades


      Figure 4b: Temporal Land cover changes in Dharwad during Past three Decades

    3. Land use analysis:  Land use assessed for the period 1973 to 2009 using Gaussian maximum likelihood classifier is listed Table V and the same is depicted in figure 5. The overall accuracy of the classification ranges from 76% (1989), 83% (2000), 81% (2005) to 94% (2010) respectively. Kappa statistics and overall accuracy was calculated and is as listed in Table VI. There has been a significant increase in built-up area during the last decade evident from table IV. Other category covers major portion of the land use. Consequent to these, there has been a slight decrease of vegetation cover especially in the Dharwad region during the past three decades.


Figure 5a: Classification output of Hubli


Figure 5b: Classification output of Dharwad

Table IV: Temporal Land cover details.

Year Hubli - Vegetation
%
Hubli - Non-Vegetation
%
Dharwad - vegetation
%
Dharwad - Non -vegetation
%
1989 97.0 3.0 98.12 1.88
2000 94.35 5.65 96.48 3.52
2005 89.73 10.27 92.21 7.79
2010 78.31 21.69 86.43 13.57

Table V (a):  Temporal land use details for Hubli

Land use -Hubli Urban Vegetation Water Others
Year
1989 1.08 0.22 0.64 98.06
2000 2.25 0.45 0.98 96.31
2005 9.85 0.71 0.74 88.70
2010 14.62 0.42 0.65 84.30

Table V (b):  Temporal land use details for Dharwad

Land use -Dharwad Urban Vegetation Water Others
Year
1989 0.62 1.43 0.51 97.45
2000 1.93 1.41 1.13 95.52
2005 3.75 1.29 0.25 94.71
2010 6.47 0.69 0.47 92.36

Table VI:  Kappa statistics and overall accuracy

Year Kappa coefficient Overall accuracy (%)
1989 0.82 76.34
2000 0.89 83.54
2005 0.83 81.62
2010 0.91 94.86
    1. Urban sprawl analysis: Shannon entropy computed using temporal data are listed in Table VII. Hubli-Dharwad is exhibiting the tendency of sprawl in all directions in recent times, as entropy values are inching closer to the threshold value (for Hubli: log (12) = 1.07. For Dharwad: log (7) = 0.845). Lower entropy values of 0.02 (NW), 0.011 (SW) during late 80’s shows an aggregated growth as most of urbanization were concentrated at city center.
    2. However, the region experienced dispersed growth in 90’s reaching higher values of 0.36 (NE), 0.49 (SE) in 2010 during post 2000’s. The entropy computed for the city (without buffer regions) shows the sprawl phenomenon at outskirts. However, entropy values are comparatively lower when buffer region is considered. Shannon's entropy values of recent time confirms of minimal fragmented dispersed urban growth in the city. This also illustrates and establishes the influence of drivers of urbanization in various directions.

Table VII:  Shannon Entropy Index

Hubli NE NW SE SW
1989 0.027 0.02 0.055 0.011
2000 0.029 0.053 0.102 0.042
2005 0.146 0.09 0.21 0.059
2010 0.369 0.134 0.49 0.128

Dharwad NE NW SE SW
1989 0.011 0.013 0.008 0.006
2000 0.016 0.023 0.014 0.018
2005 0.08 0.086 0.09 0.0745
2010 0.168 0.164 0.213 0.216
    1. Spatial patterns of urbanisation: In order to understand the spatial pattern of urbanization, ten landscape level metrics were computed zone wise for each circle. These metrics are discussed below:
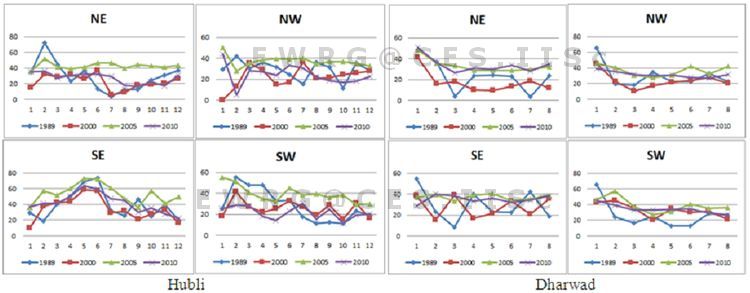
    2. Number of Urban Patch (Np) is a landscape metric indicates the level of fragmentation and ranges from 0 (fragment) to 100 (clumpiness).

      Figure 6a illustrates that the Hubli city is forming patched that are clumped at the center but is relatively disaggregated at the outskirts, but compared to the year 2005, 2010 results is indicative of clumped urban patch in the city and is directive of forming a single urban patch. Clumped patches are more prominent in NE and SW directions and patches is agglomerating to a single urban patch. The case with Dharwad is different as in case it has started to disaggregate in 2010, until 2010 there were less no of urban patches in the city, which have increased in 2010, which is indicative of sprawled growth in the city.


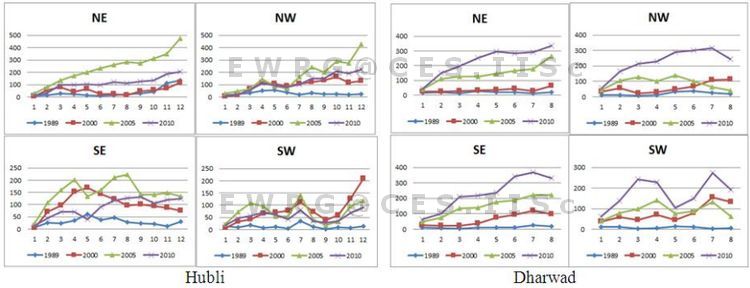
      Figure 6a: Number of urban patches (Directionwise, circlewise)

      The patch density (Figure 6b) is calculated on a raster map, using a 4 neighbor algorithm. Patch density increases with a greater number of patches within a reference area

      Patch density in Hubli and Dharwad was higher in 2005 as the number of patches is higher in all directions and gradients due to increase in the urban built area, which remarkably increased post 1989 (SW, NE) and subsequently reduced in 2010, indicating the sprawl in the region in in early 90’s and started to clump during 2010. The patch density is quite high in the outskirts also in both the cities.


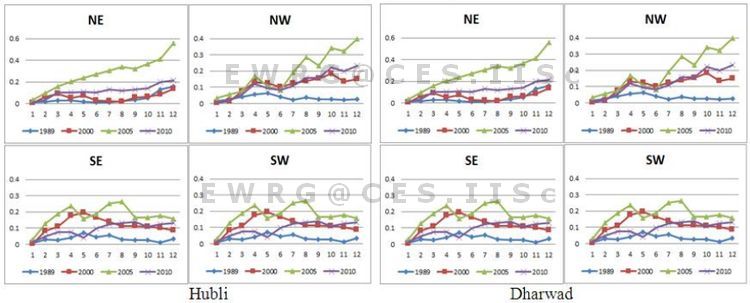
      Figure 6b: Patch Density (Directionwise, circlewise)

      Landscape Shape Index (LSI): LSI equals to 1 when the landscape consists of a single square or maximally compact (i.e., almost square) patch of the corresponding type and LSI increases without limit as the patch type becomes more disaggregated. Figure 6c indicate that there were low LSI values in 1989 as there was minimal urban areas in both Hubli and Dharwad which were mainly aggregated at the center.  Since late 1990’s both the city has been experiencing dispersed growth in all direction and circles and Hubli reached the peak of dispersed growth during 2005, towards 2010 it shows a aggregating trend in Hubli, whereas In Dharwad it is showing an dispersed growth.


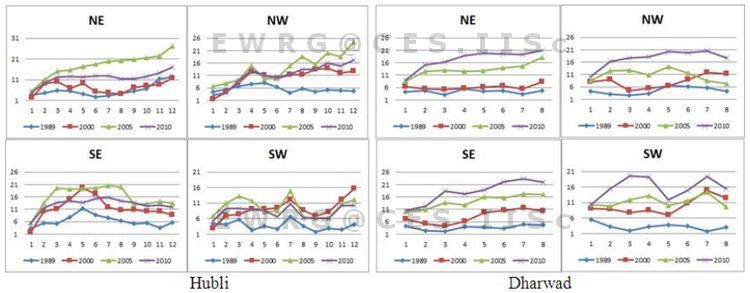
      Figure 6c: Landscape Shape Index (Directionwise, circlewise)

      Normalized Landscape Shape Index (NLSI): NLSI is 0 when the landscape consists of Single Square or maximally compact almost square, it increases as patch types becomes increasingly disaggregated and is 1 when the patch type is maximally disaggregated. Results of NLSI (Figure 6d) indicates that the landscape had a highly fragmented urban class, which became further fragmented during 2000 and started clumping to form a single square in late 2010 especially in  NE and SW direction in all circle and few inner circles in SE and SW directions, conforming with the other landscape metrics.


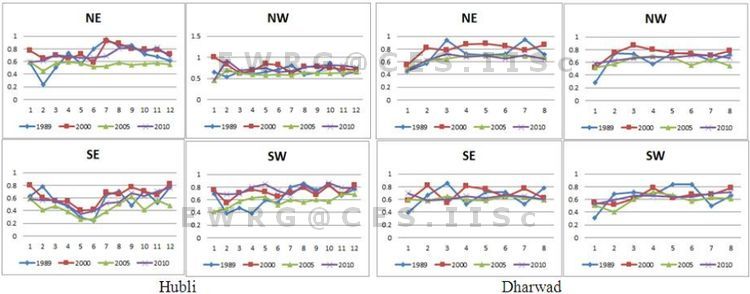
      Figure 6d: Normalized Landscape Shape Index (Direction wise, circle wise)

      Clumpiness index equals 0 when the patches are distributed randomly, and approaches 1 when the patch type is maximally aggregated. Aggregation index equals 0 when the patches are maximally disaggregated and equals 100 when the patches are maximally aggregated into a single compact patch.  Clumpiness index, Aggregation index highlights that the center of the both the cities is more compact in 2009 with more clumpiness and aggregation in SW and NE directions. In 1989 the results indicate that there were a small number of urban patches existing in all direction and in every circle and due to which disaggregation is more. Post 2000 and in 2010 we can observe large urban patches very close almost forming a single patch especially at the center and in SW direction in different gradients (Figure 6e and Figure 6f). Hubli in 2010 has become much aggregated while Dharwad is yet aggregating to form a single or maximally compact area.


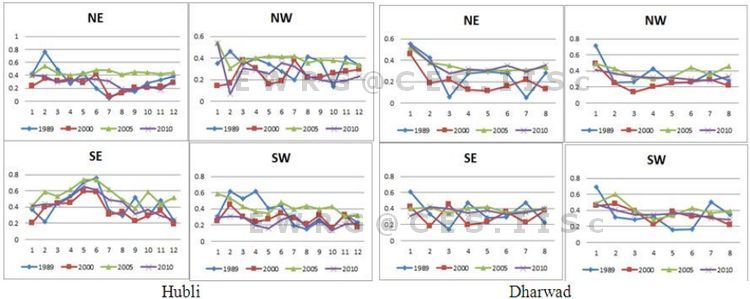
      Figure 6e: Clumpiness Index (Direction wise, circle wise)


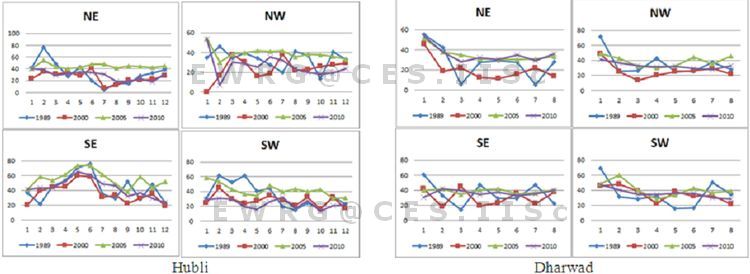
      Figure 6f: Aggregation Index (Direction wise, circle wise)

      Percentage of Like Adjacencies (Pladj) is the percentage of cell adjacencies involving the corresponding patch type those are like adjacent. Cell adjacencies are tallied using the double-count method in which pixel order is preserved, at least for all internal adjacencies. This metrics also explains the adjacencies of urban patches that the city center is getting more and more clumped with similar class (Urban) and outskirts are relatively sharing different internal adjacencies. Hubli city shows more adjacent clumped growth, whereas Dharwad shows more disaggregated growth (Figure 6g).


Figure 6g: Percentage of Like Adjacencies (Direction wise, circle wise)

BACK   «   TOP   »   NEXT
Citation : Ramachandra. T.V. and Bharath H. Aithal, 2012, Spatio-temporal dynamics of Urbanising Landscape in twin cities in Karnataka, India., International Journal of Artificial Intelligence and Mechatronics, Volume 1, Issue 5, ISSN 2320 – 5121, Pp. 87-95.
* Corresponding Author :
Dr. T.V. Ramachandra
Energy & Wetlands Research Group, Centre for Ecological Sciences, Indian Institute of Science, Bangalore – 560 012, India.
Tel : +91-80-2293 3099/2293 3503-extn 107,      Fax : 91-80-23601428 / 23600085 / 23600683 [CES-TVR]
E-mail : cestvr@ces.iisc.ernet.in, energy@ces.iisc.ernet.in,     Web : http://wgbis.ces.iisc.ernet.in/energy, http://ces.iisc.ernet.in/grass
E-mail    |    Sahyadri    |    ENVIS    |    GRASS    |    Energy    |      CES      |      CST      |    CiSTUP    |      IISc      |    E-mail