|
Result
Vegetation analysis –
Vegetation studies in the focal watershed areas revealed two distinct species composition patterns (Fig 2.).
Whereas 44 tree species were recorded from Karikan forest, only 27 occurred in Sambegadde. The nonparametric species richness
estimators, captured 75-80% of species diversity from the study sites (Table 2). Shannon index of diversity was
significantly higher for Karikan (3.001) in comparison to Sambegadde (2.54) (p-value <0.000). Girth class distribution is
identical reverse “J” shaped in both the areas (K-S test D=0.53333; Dcritical α at 0.05 = 0.6027; p(permutated) = 0.0218),
but Karikan shows a good number of high girth class individuals and taller trees, in comparison to Sambegadde. Stark difference
was in the average basal area –(53.6 m2 ha-1 for Karikan as compared to 10.56 m2
ha-1 in Sambegadde). There are 94% and 86% of evergreen tree members and 38.6% and 22.2% of endemism in Karikan and
Sambegadde respectively.
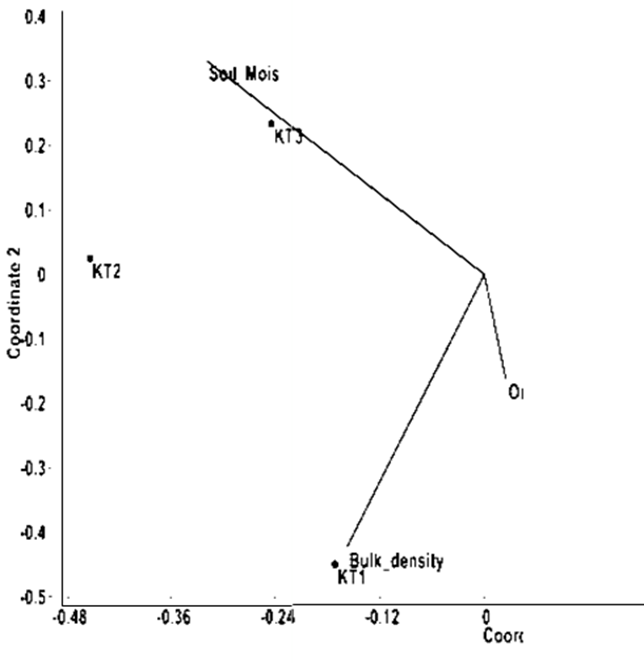
Fig 2. Non-Metric Multidimensional Scaling (NMDS) result of vegetation-site characteristics (sacred and
non-sacred forest sites). KT1Q1, KT2Q1 and KT3Q1 denote sampling groups from Karikan; ST1Q1, ST2Q1 and ST3Q1 denote sampling
groups from Sambegadde.
Table 2. Woody species diversity profile in studied watersheds:
|
Karikan |
Sambegadde |
No. of species observed |
44 |
27 |
Endemism (%) |
38 |
22 |
No. of species estimated (% captured) |
|
Jacknife 1 |
58.93(74.66) |
38.2(70.68) |
Chao 2 |
54.18(81.21) |
45(60) |
Diversity index |
|
Fischer’s alpha |
13.21 |
10.11 |
Shannon |
3 |
2.54 |
Simpson |
12.92 |
7.57 |
Three most dominant species (IVI) |
Dipterocarpus indicus (52.95) |
Hopea ponga (71.27) |
|
Hopea ponga (33.03) |
Diospyros candolleana (29.53) |
|
Knema attenuata (27.62) |
Aporosa lindleyana (24.02) |
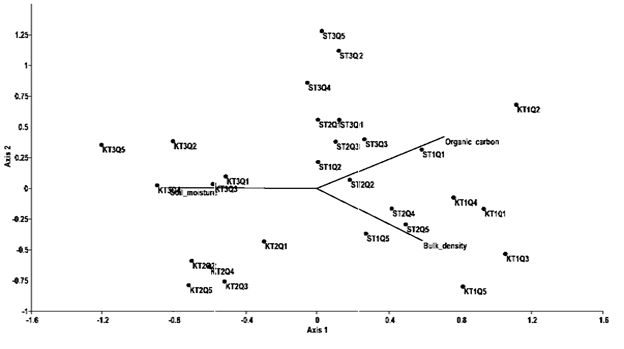
Fig 3. A. Canonical Correspondence Analysis (CCA) result related to sampling sites and studied soil parameters. Sites prefix with “K” from Karikan and prefix with “S” from Sambegadde.
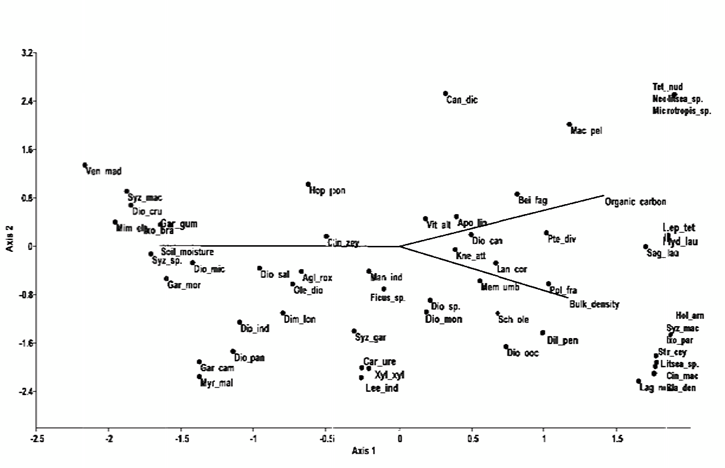
Fig. 3. B. Canonical correspondence Analysis (CCA) result related to association of species with studied soil parameters.
The overall dissimilarity between the sites is 84.1% as per ANOSIM analysis (r value 0.342). SIMPER analysis highlighted the
major contribution of wet evergreen species like, Dipterocarpus indicus, Polyalthia fragrans, Syzygium gardneri, Diospyros
crumenata, Myristica malabarica, Lepisanthes tetraphylla etc in Karikan. Canonical Correspondence Analysis (CCA) with
vegetation and soil parameters (pre-monsoon soil moisture, organic carbon and bulk density) has shown distinct groupings in
study sites. CCA axes 1 and 2 have explained 70.45% and 29.54% variation respectively (Fig 3 A, B.). Species like Diospyros
saldanha, Dipterocarpus indicus, Aglaia roxburghiana, Cinnamomum malabathrum, Myristica malabarica and Hopea ponga
are closely associated with high soil moisture, whereas, Aporosa lindleyana, Vitex altissima, Knema attenuata, Lannea
coromandelica etc., mostly of Sampegadde, form a separate cluster opposite to soil moisture factors. Karikan middle and
upper region showed greater association with soil moisture than the very disturbed lower region closer to the Bangarmakki village
in the valley. On the other hand, all sampling sites in Sambegadde clustered around bulk density and organic carbon.
Soil analysis -
Soil samples collected in three altitude ranges throughout the dry period (January to May) were analysed. In low altitude range
(0-200m.), Karikan forest has shown gradual reduction in soil moisture from 18.6% in January to 8.7% in May. In Sambegadde, soil
moisture dropped from 14.4% to 11.7% in the same period. In middle altitude range (200-400m.), soil moisture content was higher
in Karikan than Sambegadde throughout the study period. It was always > 20% in sacred forest whereas in non-sacred forest it
gradually decreased from 17% in January to 8.8% in May. In the higher altitude range (> 400m.) of Karikan, soil moisture was
19 – 25% throughout the study period in comparison to 18 – 20% in Sambegadde. On the whole sacred forest was found to have more
soil moisture in entire study period (Jan-May) 17 – 22% than non-sacred one 13-17%.
Soil organic carbon in Karikan low altitude was higher (3.79%) than Sambegadde (2.54%); but for middle and high altitudes, Sambegadde showed higher value than Karikan. These localities show more or less same bulk density values in all three altitude levels (Fig 4A, B and C).
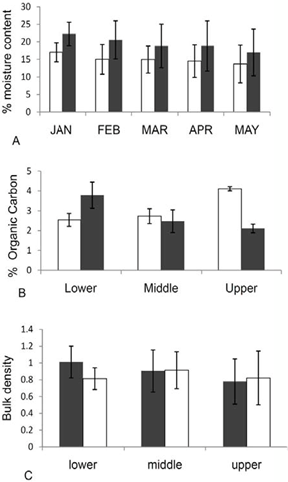
Fig 4. Soil analysis result from sacred and non-sacred sites.
(Karikan  Sambegadde
  ) )
A = soil moisture at dry period (Jan-May), B = % of organic carbon at three altitudes, C = Bulk density at three altitudes.
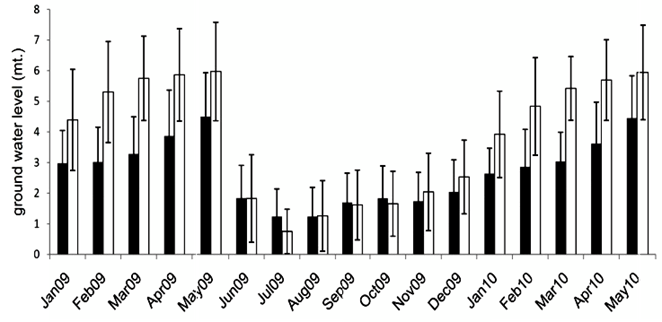
Fig 5. Groundwater profile at two sites (January 2009 - May 2010).
Ground water monitoring –
Ground water monitoring during 18 months (Jan 2009 to May 2010) showed marked differences in two areas (Fig 5.) Bangarmakki, associated with Karikan forest showed lesser decline in water table depth in comparison to Sambegadde during dry spell. However, both the villages showed similar water table profile during monsoon and early post-monsoon periods (July– Dec 2009). The water table at Sambegadde was at its lowest in May 2009 (5.97 m.± 1.60; peak summer) and highest in July 2009 (0.74 m. ± 0.72; monsoon). Bangarmakki showed gradual changes in ground water level in comparison to drastic changes in Sambegadde (rising and receding faster during wet and dry seasons). The maximum difference between these two areas was found during March 2009, when the mean water table was 2.46 m. lower in Sambegadde than in Bangarmakki.
Crop pattern –
Bangarmakki, the hamlet near Karikan sacred forest has dominance of horticultural crops (99.4%) in its land under
cultivation. Mainly higher income yielding cash crops like areca nut, coconut, banana, beetle leaf and pepper vines are grown
there. In contrast to that horticultural crops cover only 29% of total cultivated area in Sambegadde, while the rest was
mainly under rain fed paddy and to a smaller extent sugarcane and ragi cultivation. Land holdings are small in both the study
areas (mean 0.8 ha ± 0.424) (Table 1 ) .
Water usage -
Pumping schedule during late post- and pre-monsoon season showed more liberal usage of water in Bangarmakki than in
Sambegadde. In the former average of 1862 Klit ha-1 of water was pumped in January, which got reduced to 136 Klit
ha-1 in May, the peak of summer. Similar data for Sambegadde (947 Klit ha-1 in January) to 37 Klit
ha-1 in May) were significantly lower (Fig.6). Withdrawal of water during lean seasons
(non-monsoon) is linked to the quantum of recharged water during monsoon. Geology of the terrain (of both regions) are
similar and there is no scope for further deepening of wells as in Sampegadde village compelling farmers to restrict to
rain-fed rice than water demanding garden crops.
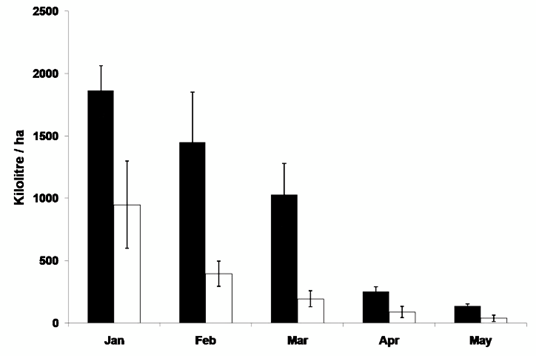
Fig 6. Water usage in study areas during dry period (January-May)
Cost-benefit analysis of plantation and agriculture products –
Both plantation and agricultural crops have been considered for the valuation. In Bangarmakki, plantation crops
(viz. areca nut, coconut, banana, beetle leaf and pepper) are the major income generating products. A total amount of Rs. 3,
11,701 ha-1 yr-1 (year 2009-10) gross average income was generated from the plantation crops against
an average expenditure of Rs. 37,043 ha-1 yr-1, (mainly for plantation maintenance), yielding a net
profit of Rs.2, 74,658 ha-1 yr-1. On the contrary, for Sambegadde, (where both plantation and rice
fields were considered for income calculation) the average gross income generated was Rs. 1, 50,679 ha-1 yr-1
against expenditure of Rs. 6474.10 ha-1 yr-1 for plantation maintenance and field preparation.
The maintenance cost was lower here as major land use was rain-fed rice. Therefore, net profit per hectare of cultivated land
was only Rs. 1,44,204 ha-1 yr-1 , against a sum of over Rs. 2.74 /ha from Bangarmakki.
|
