|
Results and Discussion
Physico-Chemical analysis: Physico-chemical parameters analyzed are presented in Table 2.
Table 2: Physico-chemical characteristics of facultative and maturation ponds
| Parameters |
Comm. Inflow |
FP(Anoxic) |
FP-01 |
FP-02 |
FP-03 |
FP Outlet |
MP Outlet |
| Sampling site |
[1] |
[2] |
[3] |
[4] |
[5] |
[6] |
[7] |
| pH |
6.78 |
6.91 |
7.35 |
7.78 |
8.68 |
8.34 |
7.74 |
| Temperature (°C) |
27.6 |
27.5 |
28 |
28.1 |
29.6 |
31.3 |
28.9 |
| Salinity (mg/l) |
486 |
572 |
573 |
566 |
535 |
534 |
565 |
| Total Diss. Solids (mg/l) |
782 |
920 |
925 |
968 |
861 |
859 |
904 |
| Total Sus. Solids (mg/l) |
460 |
288 |
224 |
389 |
170 |
94 |
32 |
| Elec. Cond. (µS/cm) |
978 |
1152 |
1159 |
1138 |
1080 |
1082 |
1142 |
| Dissolved Oxygen (mg/l) |
0 |
0.88 |
3.6 |
5.8 |
12.9 |
7.43 |
4.54 |
| COD (mg/l) |
458.7 |
224.0 |
213.3 |
362.7 |
202.7 |
208.0 |
96.0 |
| Filterable COD (mg/l) |
160.0 |
74.7 |
106.7 |
109.3 |
98.7 |
80.0 |
85.3 |
| BOD (mg/l) |
307.0 |
112.2 |
91.8 |
224.0 |
100.0 |
78.6 |
55.1 |
| Filterable BOD (mg/l) |
96.9 |
39.8 |
31.6 |
36.2 |
34.7 |
27.6 |
29.6 |
| Nitrates (mg/l) |
0.202 |
0.203 |
0.182 |
0.181 |
0.166 |
0.171 |
0.156 |
| Nitrites (mg/l) |
0.015 |
0.013 |
0.021 |
0.014 |
0.007 |
0.057 |
0.006 |
| TKN (mg/l) |
47.04 |
40.32 |
33.60 |
43.68 |
31.08 |
21.84 |
30.24 |
| Ammonia (mg/l) |
25.67 |
25.44 |
21.35 |
20.54 |
20.73 |
20.99 |
23.78 |
| Phosphates (mg/l) |
6.08 |
4.13 |
6.03 |
6.75 |
6.30 |
5.94 |
2.37 |
| Total Phosphates (mg/l) |
7.36 |
7.61 |
10.42 |
7.81 |
10.76 |
10.81 |
10.12 |
| Alkalinity (mg/l) |
480 |
520 |
480 |
560 |
500 |
520 |
480 |
| Carbonates (mg/l) |
0 |
40 |
40 |
40 |
40 |
80 |
120 |
| Bicarbonates (mg/l) |
480 |
480 |
440 |
520 |
460 |
440 |
360 |
| Ca (mg/l) |
56 |
59 |
55 |
56 |
63 |
59 |
58 |
| Mg (mg/l) |
26 |
32 |
30 |
36 |
31 |
33 |
32 |
| Tot. Hardness (mg/l) |
248 |
280 |
260 |
288 |
284 |
284 |
276 |
| Na (mg/l) |
153 |
200 |
186 |
208 |
204 |
201 |
192 |
| K (mg/l) |
37 |
40 |
39 |
44 |
42 |
40 |
41 |
| Chlorides (mg/l) |
99 |
116 |
114 |
122 |
119 |
119 |
116 |
| ORP (mV) |
-135 |
-16 |
59 |
58 |
45 |
37 |
35 |
pH :
pH is an important parameter for evaluating the treatment plant efficiency and water quality and is provided in Table 2. The pH value ranged from 6.78 at the inflows to 8.68 at the facultative ponds, which was attributed to acidogenic phase in the inflow waters (Kayombo et al. 2002) and higher photosynthesis due to prolific algal growth in ponds (Lai and Lam 1997; Veeresh et al. 2009). Experiments conducted in large scale HRAP’s also showed a pH ~9 (Craggs et al. 2012). The high pH values are attributed to higher photosynthetic rates of algae, drawing more dissolved CO2 from the waters and thereby causing high bicarbonate and carbonate concentrations, known as alkalinity. High carbonates cause calcium and magnesium ions to form insoluble minerals leaving sodium as the dominant ion in solution.
Biochemical Oxygen Demand (BOD) : Unfiltered BOD in the raw wastewater ranged from 55 to 307 mg/l, while filtered BOD ranged between 29 to 96 mg/l during the dry season (Table 2). The particulate BOD in inflows was mostly contributed by food and excretory wastes as evidenced by the brownish grey colour of the incoming wastewater. The decrease of the filtered and the unfiltered BOD from the inflows to the facultative pond to almost 60 % during the detention period of 36 hours illustrate the functioning of anaerobic zone of the lagoon. In a study conducted by Faleschin et al. (2012) 41% of unfiltered BOD removal happened due to sedimentation in the first segment of the FP and ~55-67 % of unfiltered and 81-90% of filtered BOD removal was observed during their study period. After the first point (TP-01, Figure 2) there was almost no variation in BOD except at point FP-02 where the unfiltered BOD shoots up to 224 mg/l. However, the filtered BOD values are almost same compared to earlier values. The increase in BOD (Figure 2) is due to the proliferative growth of euglenophycean members. BOD values upto 100 mg/l is the permissible limit for irrigation use (CPCB, India). The algal count 9.3×10⁵ cells/ml and 2.4×10⁵ cells/ml were observed in facultative ponds and maturation ponds, respectively during midday.
Figure 2: Variation of filterable and total BOD with residence time.
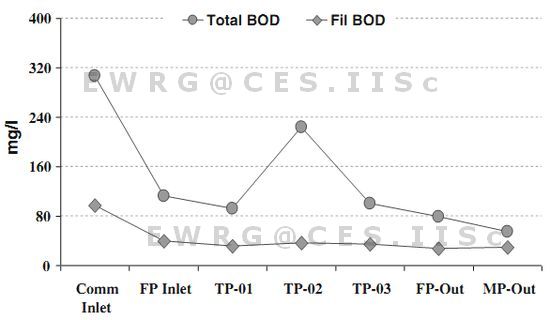
The algal members contribute to the particulate BODin the effluent, which is evident from the surface BOD loading of about 60% in anaerobic zone which extends upto 10000 m2 (Valero et al. 2010; Faleschini et al. 2012). Given the adequate anaerobic environment, the BOD removal could be as high as 92% in integrated waste stabilization ponds (Tadesse et al. 2004) and 96%in facultative lagoons (Jamwal et al. 2009), 82-91% in HRAP’s (Craggs et al. 2012).
Chemical Oxygen Demand (COD): COD infers to the oxygen equivalent of the organic material in wastewater that can be oxidized chemically. COD of the unfiltered raw influent and filtered effluent were 458 and 160 mg/l respectively and were similar to BOD trend (Table 2). The maximum surface COD removal of 50% happened in the initial part of the facultative lagoon (in the anaerobic zone). The net unfiltered COD removal efficiency of the STP was around 80% and filtered COD removal efficiency was around 50% contrary to COD removal of 63% (Kayombo et al. 2002), 90% (Tadesse et al. 2004) and 92% (Jamwal et al. 2009). Maturation ponds showed a slightly higher filtered COD value than the facultative lagoons which can be attributed to some external interference that provided additional organic loads. Higher algal density at the middle of the ponds has contributed to a higher particulate COD value (Figure 3).
Figure 3: Variation of filterable and unfiltered COD with residence time
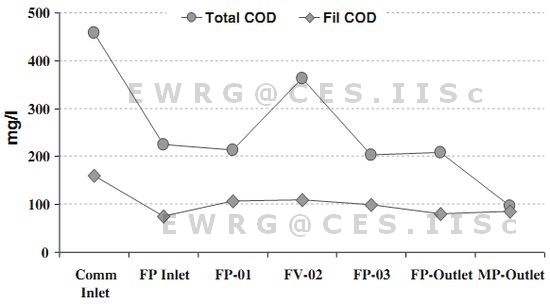
Major COD removal mechanism is sedimentation of solids that settle (as in septic tanks) and subsequent anaerobic digestion in the resulting sludge layer. Bacterial groups involved are the anaerobic acidogens indicated by lower pH (~6) values near the anaerobic zones, and the methanogens. Around 30-50 percent of the influent BOD leaves the facultative pond in the form of methane (El-Fadel and Masood 2001). The remaining non-settleable BOD is oxidized by the normal heterotrophic bacteria such as Pseudomonas sp., Flavobacterium sp. and Alcaligenes sp. etc. Bacteria use oxygen produced during the photosynthetic activities of the micro-algae which grow naturally and profusely in facultative ponds. The algal-bacterial activities result in a high proportion of the BOD which ends up as algal cells and does not escape as methane and carbon dioxide in the pond. Thus in facultative ponds sewage COD is primarily converted into algal COD.
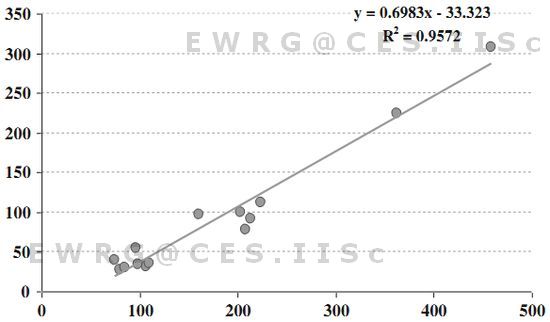
The correlation between COD and BOD indicatesreadily degradable organic matter contrary to slowly biodegradable suspended solids as in complex waste effluents containing refractory substances (Eckenfelder 1989). The average influent and effluent COD/BOD5 ratios for the treatment plants were calculated and it is observed that the COD/ BOD5 ratio frequently varied for influents and effluents(Figure 4). A ratio ranging from 1.49 to 1.87 for the influent wastewaters are comparable to the earlier studies (Metcalf and Eddy 1991; 2003). The typical COD/ BOD5 ratio of domestic wastewaters is usually in the range of 1.25 to 2.5. However, for treated effluents, it ranged from 2.02 to 2.9 indicating a relatively higher proportion of the non-biodegradable content in treated effluent than raw wastewater.
Figure 4: Correlations between BOD and COD
There is a marked transition of the colour and nature of the wastewater as it passes through the various stages of the treatment ponds system. Initially, the sewage colour is very dark either black or grey as shown in Figure 5a. After the suspended solid reduction and transformation of the particulate organic matter into inorganic nutrient forms, the algae (green colour) proliferates in these facultative regions as depicted in Figure 5b and finally when the wastewater reaches the final maturation ponds, it is oxidized and looks clear as illustrated in Figure 5c. Table 3 summarizes earlier investigations of the treatment efficiencies of facultative pond based on sewage treatment systems with various process parameters and percentage removal efficiencies of nutrients.
Figure 5: a) Near FP Inflow (Anaerobic zone – Sludge upwelling) b) Facultative zone (High algal growth–euglenophyceae) and c) Maturation pond – water is clear with slightly muddy colour

Inorganic Carbon: Carbonates are one of the most important dissolved components of wastewaters. The amount of carbonates control the diffusion of carbon-dioxide while governing water pH and buffering. Very little carbonate (10 mg/l) enters at inlet to the raw wastewater and undergoes various stages of treatment. Progressive increase in the amount of carbonates was observed, which was highest at the outfalls of the facultative ponds and maturation ponds (Table 2), which was attributable to higher pH due to fast algal-photosynthetic activity (Lai and Lam 1997). However, the bicarbonate concentrations increased at the middle regions of the facultative ponds and declined in the final maturation ponds.
Suspended Solids (SS): Suspended solids (SS) range from 460 mg/l (at inlets) to 32 mg/l. Higher SS at inlets are due to semi-decomposed and decomposed solids from food, etc. There was a gradual reduction of SS at the middle and the effluents of the facultative lagoon. SS of 389 mg/l at the middle regions is due to the dense suspended algal solids. About 80% turbidity is removed in the maturation ponds which have minimum suspended solids (32 mg/l). The SS removal efficiency is about 93%, which is comparable to 90 % (Veenstra et al. 1995) and 89-94% (Tadesse et al. 2004) removal.
Table 3: Comparative account of treatment efficiencies of Facultative pond systems with their percentage removal efficiencies of earlier studies
| Type of WSP and Source |
Depth [m] |
S. Loading [kg/ha.d] |
Detention Time [d] |
Temp. (oC) |
TSS Rem [%] |
COD Rem [%] |
BOD Rem [%] |
Amm-N Rem [%] |
N Rem [%] |
P Rem [%] |
| Arthur 1983 |
1-1.8 |
200-600 |
-- |
15-30 |
-- |
-- |
-- |
-- |
-- |
-- |
| WHO EMRO Technical Report No. 10, 1987 |
1.5-2 |
200-400 |
-- |
20-30 |
-- |
-- |
80 |
-- |
-- |
-- |
| Metcalf & Eddy 1991 |
1.2-2.5 |
60-200 |
5-30 |
20 |
70-80 |
-- |
80-95 |
-- |
-- |
-- |
| Mara et al. 1992 |
1-2 |
100-400 |
NA |
NA |
NA |
-- |
70-80 |
-- |
-- |
-- |
| Facultative Pond , Karnchanawong and Sanjitt , 1995 |
1-1.1 |
16-160 |
1.6-16 |
20-26 |
-4 to -100 |
3-33 |
22-44 |
20-72 |
4-55 |
20-22 |
| Spinach Pond , Karnchanawong and Sanjitt ,1995 |
1-1.1 |
16-160 |
1.6-16 |
20-26 |
36-90 |
34-68 |
44- 72 |
5-79 |
4-75 |
32-90 |
| Yemen WSP, Veenstra et al, 1995 |
1.5 - 2 |
250-340 |
15 |
20 |
90 |
78.75 |
87.5 |
2-25 |
-- |
-- |
| AFP, Green et al, 1995 |
2 |
-- |
2-3 |
20 |
25 |
-- |
56 |
29 |
72 |
19 |
| WSP, Ceballos, et al, 1995 |
2.2 |
296 |
61 |
25-27 |
67 |
-- |
95 |
39 |
45 |
8 |
| FP Aerated biofilter (BF), Goncalves & Oliveira, 1996 |
1.8 |
NG |
NG |
NG |
25-90 |
63 |
NG |
86 |
67 |
-- |
| WSR, Kayombo, et al, 2002 |
1.6-1.9 |
155-695 |
3-6 |
23-28 |
-- |
66.3 |
-- |
-- |
-- |
-- |
| AIWP, Tadesse, et al, 2004 |
1.2-3.5 |
210-5560 |
4-8 |
15-30 |
89-94 |
90-97 |
92-99 |
42-87 |
-- |
42-94 |
| FP, Jamwal, et al, 2009 |
-- |
-- |
18 |
10-33 |
98.12 |
92.31 |
96.47 |
-- |
86.3 |
-- |
| FP, Present Study, 2011 |
1.5-4 |
400-900 |
12-14 |
21-26 |
93 |
79 |
82 |
6 |
36 |
-- |
Nitrogen Removal: In anaerobic regions, organic nitrogen is hydrolyzed to ammonia. Higher ammonia values at the inflows is due to higher residence time in the sewer allowing most of the organic nitrogen being converted into ammonia before reaching the STP. Nitrogen is incorporated into new algal and bacterial biomass by biosynthesis. Eventually, cell growth declines and they settle atthe bottom of the pond; around 20 percent of the biomass is non-biodegradable and the nitrogen associated with this fraction remains immobilized in the pond sediment (Mahapatra et al. 2011b). Nitrogen associated with the biodegradable fraction eventually diffuses back in the water, which is recycled back into biomass and the process repeats (Mahapatra et al. 2011a). At high pH levels (pH>9), some of the ammonia leaves the pond by volatilization (Zimmo et al. 2003).
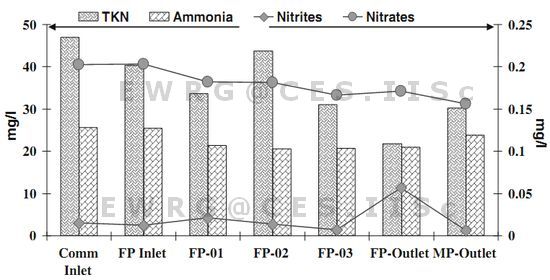
Nitrate Nitrogen (NO3-N) is a necessary primary macronutrient for the biota in aerated treatment systems. The raw influent sewage has NO3-N of 0.202 mg/l (Figure 6) and a significant amount of it was not detected as a result of low nitrification but most of it was in the form of ammonia. NO3-N in the effluent of the facultative pond and the maturation ponds were 0.171 and 0.156 mg/l respectively (Table 2). Earlier studies have reported nitrate concentrations >10 mg/l at higher organic loads with competitive algal activities (Faleschin et al. 2012). Nitrifiers having slow growth rates will only be of significance in the water column of systems with long retention times (Pauer and Auer 2000). The populations of nitrifying bacteria are relatively low in WSP (wastewater stabilization pond) due to the absence of physical attachment sites in the aerobic zone and also by algal inhibition.
Figure 6: Variations of N species at facultative ponds and the maturation ponds
Inhibition of nitrification is dependent on the quantum of organic carbon due to ammonification rates and high concentrations of ammonia (Strauss and Lamberti. 2000). Excessive ammonia causes the decoupling of the two nitrification steps by selectively inhibiting Nitrite Nitrogen (NO2-N) oxidation, leading to NO2-N accumulation, which leads to positive feedback resulting in further eutrophication (Chen et al. 2010).
Nitrite Nitrogen (NO2-N) ranged from 6.3 to 21.1µg/l (Table 2) and were significantly less compared to other forms of N (ammonia and nitrates). The influent raw sewage had a value of 14.9 µg/lof NO3-N (Figure 6) and the highest values were recorded in the initial portion of the facultative lagoons. A sudden increase in the nitrite values at this region may be because of incomplete nitrification, while maturation pond effluents showed the lowest values (6.3 µg/l).
Ammonia Nitrogen (NH4-N) values elucidated in Figure 6, ranges from 20.54 to 25.67 mg/l were higher compared to the other forms of N (Table 2). The influent raw sewage values were around 26 mg/l, while effluent ammonia values were around 23.78 mg/l. The trend shows that there is a drop in the NH4-N present in anaerobic zone of the facultative lagoon due to settling of particulate organic matter and consequent higher microbial activities, which is similar to anearlier report (Faleschin et al. 2012). There are possibilities of NH4-N removal by methanotrophs that support nitrification within the sludge under anoxic conditions and consequent denitrification in the wastewaters (Valero et al. 2010). Studies conducted in hectare scale high rate algal ponds (HRAP’s) have reported 64-67% removal of NH4-N (Craggs et al. 2012).
The increase in NH4-N values from the outfall of the facultative pond to the outfall/effluent of the maturation ponds is due to seepage of waste from other sources or N waste products of the native biota of the ponds. NH4-N volatilization is proposed as the major sink for N in anaerobic/anoxic systems with high NH4+ influents like partially treated or untreated sewage (Kalff 2002; Bolan et al. 2004) in contrast to other studies (Zimmo et al. 2003) that showed NH4-N volatilization losses to be <1.1% compared to the other N losses. The experimental results of N speciation in relation to pH also suggested against NH4-N volatilization in ponds (Faleschin et al. 2012).
TKN (~48mg/l) values were higher near the inflows and lower (~22mg/l) at the outlets of the facultative lagoons (Table 2). Outfalls of the maturation ponds showed comparatively higher TKN (Figure 6) due to higher activity of zooplanktons. This is similar to 86% TKN removal in oxidation ponds at Delhi (Jamwal et al. 2009).
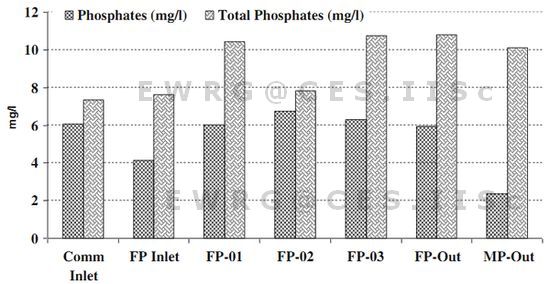
Phosphate Removal: Phosphates are the key and limiting nutrients deciding the system’s productivity in terms of biomass, necessitating P regulations in STP’s. Orthophosphates (OP) were higher at the middle portions of the facultative pond indicating active mineralization with higher algal biomass (6.75 mg/l). Lowest values of OP were found in the outfalls of the maturation ponds (2.37 mg/l) but total phosphates (TP) were higher (Table 2, Figure 7) in the aerated regions of the facultative pond and the maturation ponds (10.12-10.76 mg/l). This could be attributed to the higher algal biomass and therefore higher organic P. Studies conducted on HRAP’s showed a mere orthophosphate removal of 14-20 % (Craggs et al. 2012). The lowest TP values were observed at the raw influent inflow regionsowing to partial mineralization asinfluent sewage reachedthe STP, thus showing a higher value of OP in the inlets. P removal reported earlier varied from 19 % (Green et al. 1995) to 21 % (Karnchanawong and Sanjitt. 1995) and 68% in AIWP, (Tadesse et al. 2004).
Figure 7: Variations of P species at facultative ponds and the maturation ponds.
Algal Dynamics in ponds: Algae are the key players in oxygenation in pond based systems. The algal solids produced during the treatment process are potentially useful harvestable biomass that can be used as fertilizers and food and raw material for bio-technological industries (Pearson et al. 1987). Sensitivity of the algal biomass to varied organic nutrients affects the growth, productivity and efficiency of the treatment systems. Therefore, the type of the species present and the quantity of the biomass are potential indicators of the plant efficiency.
Facultative ponds: The quantum of algae growing in the facultative pond is a function of the surface organic loading. Species diversity decreases with the higher organic loadings (Konig 1984; Konig et al. 1987) as evident from fewer algal genera (flagellate genera i.e. euglenoides) at the facultative ponds compared to that of maturation ponds with predominating non-flagellates as Micracitinium sp. and Chlorella sp. (Table 4), revealing the functional aspects of the treatment systems. Similar to the earlier reports (Veeresh et al. 2009; Amengual-Morro et al. 2012), dominance of Euglena sp. were observed in the facultative ponds.
At the initial reaches where the organic matter was high there were fewer algal genera as algal biomass decreases with increased BOD surface loadings in facultative ponds (Figure 2 and Figure 5a). Pure population of flagellate euglenoides (Euglena sp.) was noticed at higher organic loads (400-900 kg BOD5/ha/d). 34 algal genera were observed in conditions where the light intensities remain relatively constant. Euglenophytes were the dominant members in facultative ponds contrary to the earlier studies that reported the dominanace of chlorophytes (Bernal et al. 2008). At 770 kg BOD5/ha/day, Chlamydomonas, Pyrobotrys, Phacus and Euglenasp. were among the most resistant algae to such conditions (Athayde 2001). The maturation pond had an organic loading of ~200 kg BOD5/ha/day, where Micracitinum sp. and Chlorella sp. dominated in contrast to the reports of abundance of Ankistrodesmus sp. and Scenedesmus sp. at surface organic loadings below 75 and 50kg BOD5/ha/day (Athayde 2001). In the recent study, cyanophycean cells (Spirulina sp. and Microcystis aeruginosa) were reported to be dominant during the nutrient limiting regimes, when the organic matter load was <20m3/d)in wastewater flows. However, the chlorophycrean members (Chlamydomonas sp., Oocystis sp., Pandorina morum, Eudorina elegans and Scenedesmus sp.) dominated during the nutrient rich inflow periods in the stabilization ponds (Amengual-Morro et al. 2012)
Prevalence of higher concentrations of ammonia throughout the system is indicative of higher organic loading that might control/check the growth of sensitive algal species. Ammonia and sulphate inhibitions were reported in earlier studies (Konig1984; Konig et al.1987; Mills1987; Pearson et al. 1987; Athayde 2001). It has been also observed that genus like Chlorella grows in a wide range of organic loading. Studies show its preference for lower organic loads (28 kg BOD5/ha day) in maturation ponds (Athayde 2001). The present study reveals that the changes in cell concentration of euglenoides in facultative pond and Micracitinium sp. in maturation ponds can be used as the indicator to forecast changes in loading conditions in pond systems.
Total algal biomass as determined by algal microscopic counting and enumeration is higher in facultative ponds than in the subsequent maturation pond. This indicates the reduction in available nutrients and also the increased grazing pressures by the zooplankton population under aerobic conditions in maturation ponds. Several algal genera common in facultative ponds, including Euglena sp., are capable of heterotrophic growth on organic substrates such as acetate released as a result of anaerobic degradation of organic material in the anaerobic sediments (Mills 1987; Pearson et al. 1987). Euglena species have been observed to migrate to lower anaerobic organic-rich sediments in facultative ponds at night (Konig 1984). However, the significance of this in terms of overall organic carbon removal from ponds is not clear and needs further studies.
Anaerobic zone: The anaerobic part of the ponds, especially the initial regions receives larger quantity of total maximum daily load (TMDL). During the field survey, grey colour was observed in the anaerobic zone of the facultative pond, which is attributed to a balanced-loading. However, the sludge upwelling at the initial anaerobic reaches was consistently observed during the field investigation. This would have resulted in impaired facultative pond performance. These regions showed lower algal cell counts and were mostly dominated by the filamentous cyanophycean members such as Plakntothrix sp. and Planktolyngbya sp. and very few flagellates.
Facultative zone: Higher euglenoid densities (~106 cells/l) were found in the facultative ponds. There was a significant fluctuation in the algal densities (p<0.05) across the three different travel paths, viz. sites 3,4 and 5. These fluctuations were not correlated with temporal variations. These differences in the algal densities are attributed to their abilities to sustain at higher carbon loads (through heterotrophy). The difference in the surface BOD loading can be one of the possible reasons for the diversity in algae.
Differences in the spatial and temporal distribution of algal counts have been attributed to the stratification of algae during the daylight hours into a distinct movable band (40-50 cm wide), which corresponded to the water column in the middle reaches of the facultative pond. These algal bands were carefully observed and it was found that these bands move up and down through the water in response to changes in sunlight intensity and associated wind movement. When it approaches the effluent take-off level, very high concentration of algae appears in the effluent (making the water colour dark green). As it moves towards the maturation pond the concentration drops. The vertical movement of algae varies with the time of the day and according to the wind movement. Present observations confirmed that the algae communities in these ponds were the motile euglenoides and they move on to the bottom sediments of the pond at night. Algal species composition (dominance and community structure) can be an essential tool, which can indicate pond type and BOD surface loading. In the present investigation, it was observed that the euglenoides predominate the facultative ponds. During the study, facultative pond essentially comprised of flagellate algal genera (Euglena sp., Lepocinclis sp., Phacus sp., Pyrobotrys sp., Trachelomonas sp., Chlamydodmonas sp.). However, the non-motile algae (Micractinium sp., Scenedesmus sp. and Chlorella sp.) dominate the maturation pondsas given in Table 4 (Figure 8d). The diversity of algal species increases with improved effluent quality. The present study indicated 4 to 5 species existing in the facultative pond (>500 Kg BOD5/ha) at Vidyaranyapuram during the entire study period, while as many as 21 species were present in the maturation ponds with surface loading of>100 Kg BOD5/ha. The relative abundance of the algal species is provided in Table 4.
Table 4: Relative abundance of microalgal species in STP (% of 500 counts)
| Algal genus |
Inlet |
FP |
FP Outlet |
Maturation pond |
| Chlorophyceae |
|
|
|
|
| Micracitium pusillum |
__ |
__ |
__ |
19.5 |
| Monoraphidium graffiti |
__ |
20 |
2 |
6.5 |
| Monoraphidium contortum |
__ |
__ |
__ |
3.5 |
| Chlorococcum sp. |
2 |
__ |
__ |
3.25 |
| Chlorella vulgaris |
__ |
__ |
__ |
24.5 |
| Botrycoccus brauni |
__ |
__ |
__ |
2 |
| Chlorella ellipsoidea |
__ |
__ |
__ |
7.25 |
| Westella sp. |
__ |
__ |
__ |
7.0 |
| Aataerococcus sp. |
__ |
__ |
__ |
0.5 |
| Eudorina sp. |
__ |
__ |
__ |
0.5 |
| Selenastrum minutum |
__ |
__ |
__ |
2 |
| Pyrobotrys gracilis |
__ |
__ |
__ |
0.5 |
Pandorina morum
Closteriopsis sp. |
__
__ |
__ |
__ |
0.5
0.5 |
| Cyanophyceae |
|
|
|
|
| Chroococcus disperses |
__ |
__ |
1 |
3 |
| Planktothrix sp. |
82 |
__ |
__ |
10.25 |
| Phormidium sp. |
__ |
__ |
__ |
0.5 |
| Chroococcus limneticus |
__ |
__ |
__ |
1.25 |
| Oscillatoria sp. |
__ |
__ |
__ |
0.75 |
| Planktolyngbya sp. |
__ |
__ |
__ |
0.5 |
| Gomphosphaeria sp. |
__ |
__ |
__ |
0.25 |
| |
|
|
|
|
| Euglenophyceae |
|
|
|
|
| Euglena sp. |
5 |
35 |
40 |
2 |
| Lepocinclis sp. |
__ |
15 |
__ |
0.5 |
| Euglena aqus |
__ |
__ |
__ |
1.5 |
| Phacus chloroplasts |
__ |
__ |
__ |
0.25 |
| Trachelomonas sp. |
|
40 |
57 |
__ |
| |
|
|
|
|
| Bacillariophyceae |
|
|
|
|
| Nitszchia sp. |
1.25 |
__ |
__ |
10 |
| Cyclotella sp. |
1 |
__ |
__ |
__ |
Figure 8 a: Algal distributions in the inflow raw feed (sewage)
.jpg)
Figure 8 b: Algal distributions in the facultative pond (middle)
.jpg)
Figure 8 c: Algal distributions in the outlets of facultative lagoon
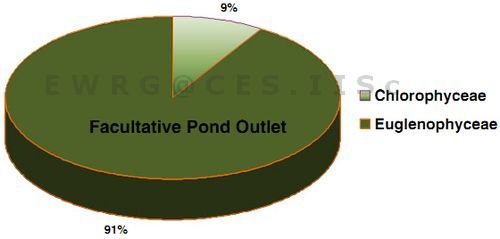
Figure 8 d: Algal distributions in the outflows of the maturation
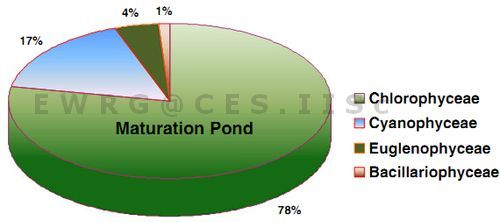
Figure 9: Algal densities and distribution at different unit processes of STP.

The key indicators of the unit operation processes are associated with the transition of algal biomass. The distribution of various algal communities in the various unit processes of the pond based system is provided in Figure 8 (a-d) and Figure 9. A transition in the species composition towards flagellate forms indicates more facultative conditions and shows a change in effluent quality. The purple pellet of the water samples after centrifugation showed the presence of purple sulfur bacteria indicating the pond transiting to anoxia and reduced performance. The present study reveals that the algal count in the ponds can be directly correlated with the BOD surface loading. Algal count of ~106 cells/ml dominated by euglenoid flagellate members in the facultative ponds indicates a loaded facultative pond with variable stability. In contrast, the algal counts at the maturation ponds were of the order of 104-105 cells/ml but consisted of numerous non-flagellate algae essentially comprising of the chlorophycean members. Therefore, for climatic conditions similar to Mysore (Tropics), maximum algal biomass production is expected to be around 10 kg BOD5/ha. However, the effect of shock loads on the viability and growth of the algal cells is yet to be understood.
Diurnal Variation of Chemical Parameters
The diurnal analysis showed a consistent difference between the inflow and outflow parameters (Table 5). During this period the flow rate varied from 30 to 33 MLD that is roughly around 47 % of the installed plant capacity. At this loading rate the wastewater flow gets a higher retention period in the STP, which helps in better treatability.The initial part of the lagoon is characterized by constant sludge dislodging from the bottom by the microbial activities. The pH around this region was consistently towards the acidic side (~6) and the ORP was-200 mV.
The periodic DO analysis showed that, DO in the subsurface water is negligible and the surface water have at times very less surficial DO which would not affect the bottom anaerobic processes (Mahapatra et al. 2011a). DO owing to higher photosynthesis progressively increased from morning to midday and then dropped to a minimum (Table 5). This is in agreement with other studies (Kayombo 2000;Tadese et al. 2204; Amengual-Morro et al. 2012). In HRAP’s, the DO levels were almost saturated i.e. from 86–98% (Craggs et al. 2012). The algal densities at inlet region were negligible compared to the latter portions of the facultative lagoon. The latter aerobic parts of the facultative lagoon were characterized by higher DO values 16.25 mg/l (near the outlets of the facultative lagoon) with a consistent high pH value above 8 due to algal photosynthesis. The ORP of these regions were found to be positive (8-59 mV) showing oxidizing conditions at the surface except that the evening sample which showed negative values). A good correlation was observed between the ORP and the pH value (R2=0.89; p<0.05). These variations could be due to algal, bacterial and physico-chemical stratification in the facultative lagoon’s water column, i.e. algal dynamics at different depths. It was observed that the zone of movement of the algal band was strictly restricted to the top 40-50 cm of the pond.
Table 5: Diurnal Variations of Treatment parameters
| Sampling sites |
Time (am) |
pH |
WT* (°C) |
Salinity (ppm) |
TDS (ppm) |
Elec. Cond. (µS) |
ORP (mV) |
DO (surf) (ppm) |
DO (sub surf) (ppm) |
| Morning-I |
|
|
|
|
|
|
|
|
|
| Inflow |
08:10 |
7.25 |
26 |
420 |
680 |
855 |
33 |
2.8 |
- |
| FP-01 |
08:20 |
6.48 |
24.3 |
583 |
938 |
1166 |
-225 |
1.09 |
1 |
| FP-Outlet |
08:35 |
7.34 |
24.4 |
564 |
908 |
1135 |
8 |
2.34 |
0.34 |
| MP-Outlet |
08:50 |
7.66 |
24.4 |
567 |
916 |
1147 |
18 |
0.53 |
0.3 |
| |
|
|
|
|
|
|
|
|
|
| Morning-II |
|
|
|
|
|
|
|
|
|
| Inflow |
11:05 |
7.18 |
28.6 |
505 |
812 |
1018 |
24 |
3.18 |
- |
| FP-01 |
10:40 |
6.45 |
25.6 |
554 |
888 |
1110 |
-212 |
0.9 |
0.9 |
| FP-Outlet |
10:55 |
8.1 |
26.1 |
548 |
879 |
1097 |
59 |
12.6 |
3.6 |
| MP-Outlet |
10:35 |
7.66 |
24.4 |
567 |
916 |
1147 |
18 |
0.53 |
0.3 |
| |
|
|
|
|
|
|
|
|
|
| Mid Day |
|
|
|
|
|
|
|
|
|
| Inflow |
13:10 |
7.18 |
28.6 |
505 |
812 |
1018 |
24 |
3.18 |
- |
| FP-01 |
12:40 |
6.45 |
25.6 |
554 |
888 |
1110 |
-212 |
0.9 |
0.9 |
| FP-Outlet |
12:55 |
8.1 |
26.1 |
548 |
879 |
1097 |
59 |
12.6 |
3.6 |
| MP-Outlet |
12:25 |
7.66 |
24.4 |
567 |
916 |
1147 |
18 |
0.53 |
0.3 |
| |
|
|
|
|
|
|
|
|
|
| Evening |
|
|
|
|
|
|
|
|
|
| Inflow |
16:40 |
7.34 |
28.4 |
578 |
932 |
1174 |
-91 |
0.7 |
- |
| FP-01 |
16:00 |
6.61 |
26.4 |
560 |
898 |
1125 |
-210 |
0.59 |
0.59 |
| FP-Outlet |
16:20 |
8.13 |
29.7 |
543 |
871 |
1089 |
48 |
7.25 |
3.4 |
| MP-Outlet |
16:35 |
7.65 |
26.3 |
554 |
893 |
1119 |
41 |
0.38 |
0.12 |
*Water temperature
Significantly negative correlations were found between the biomass of chlorophyceae with total suspended solids (TSS) and COD. The euglenophyceae members were positively correlated with NH4-N, total hardness, Sodium and Chloride while diatoms have a negative correlation with the same given parameters. The cyanophyceaen members were negatively correlated with pH, water temperature, DO, NH4-N and TP (Table 6).
Table 6: Spearman’s rank correlation between physicochemical variables and groups of microalgae from sewage treatment ponds
| Parameters |
Chlorophyceae |
Euglenophyceae |
Cyanophyceae |
Bacillariophyceae |
| pH |
0.56373 |
0.64286 |
-0.95499** |
-0.65738 |
| Temperature |
0.72739 |
0.42857 |
-0.84688* |
-0.35857 |
| Salinity |
-0.16366 |
0.071429 |
0.054056 |
-0.17928 |
| TDS |
-0.18185 |
0.32143 |
-0.090094 |
-0.29881 |
| TSS |
-0.81832* |
0.10714 |
0.48651 |
0.17928 |
| EC |
-0.054554 |
-0.10714 |
0.12613 |
-0.059761 |
| DO |
0.56373 |
0.64286 |
-0.95499** |
-0.65738 |
| COD |
-0.87287* |
0.14286 |
0.48651 |
0.17928 |
| Filt. COD |
-0.072739 |
0.071429 |
0.18019 |
0.53785 |
| BOD |
-0.76376 |
0.14286 |
0.39641 |
0.059761 |
| Filt. BOD |
-0.72739 |
-0.17857 |
0.63066 |
0.17928 |
| Nitrate |
-0.90924 |
-0.071429 |
0.59462 |
0.11952 |
| Nitrite |
-0.32733 |
0.42857 |
-0.16217 |
0.059761 |
| TKN |
-0.72739 |
-0.071429 |
0.61264 |
0.29881 |
| Amm-N |
-0.27277 |
0.85714* |
-0.88292* |
0.65738 |
| OP |
-0.20003 |
0.64286 |
-0.34236 |
-0.17928 |
| TP |
0.65465 |
0.46429 |
-0.88292* |
-0.41833 |
| Alkalinity |
-0.46686 |
0.76719 |
-0.44371 |
-0.87671 |
| Carbonates |
0.62199 |
-0.019703 |
-0.40756 |
-0.26375 |
| Bicarbonates |
-0.80556 |
0.38188 |
0.19267 |
-0.27386 |
| Ca |
0.19444 |
0.10911 |
-0.41286 |
-0.63901 |
| Mg |
-0.073398 |
0.5766 |
-0.47273 |
-0.72363 |
| Hardness |
-0.0091747 |
0.81084* |
-0.74545 |
-0.90453* |
| Na |
0.018185 |
0.78571* |
-0.73877 |
-0.89642* |
| K |
0.26607 |
0.48651 |
-0.57273 |
-0.66332 |
| Chlorides |
0.10185 |
0.78195* |
-0.77067 |
-0.85201* |
| ORP |
0.29096 |
0.64286 |
-0.66669 |
-0.29881 |
Bold figures indicate statistically significant correlations (*: p < 0.05; **: p < 0.01)
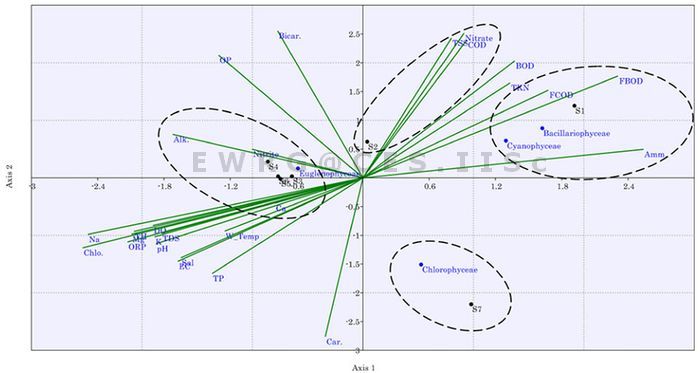
Canonical Correspondence Analysis (CCA) showed four distinct places in the ordinate spacecharacterized by different groups of algal species being impacted by specific physicochemical conditions. Axis 1 accounted for 56.56% and axis 2 explained 42.57% of the total variation, respectively, which jointly represents 99.13%. Correlations between species and environmental parameters were 0.98 and 0.93 for axis 1 and 2, respectively. In Figure 10 the site S1 is dominated by the cyanophycean species followed by bacillariophycean species that are mostly impacted by NH4-N, Filt.BOD and Filt.COD and TKN values. The site 2 has mainly clustered around nitrate, TSS and COD. However, the sites 3, 4, 5 and 6 are grouped together showing the predominance of euglenophyceae and are affected by the concentrations of DO, pH, alkalinity and nitrite. On the other hand S7 were dominated by chlorophycean members.
Figure 10: CCA ordination obtained from algal abundance data for each species and physicochemical variables for the residence time of 12 days in sewage treatment ponds. Illustration show the ordination of: sampling locations (represented by points with black dots from S1-S7) and physicochemical variables (represented by green lines), and micro-algal genera indicated by blue dots.
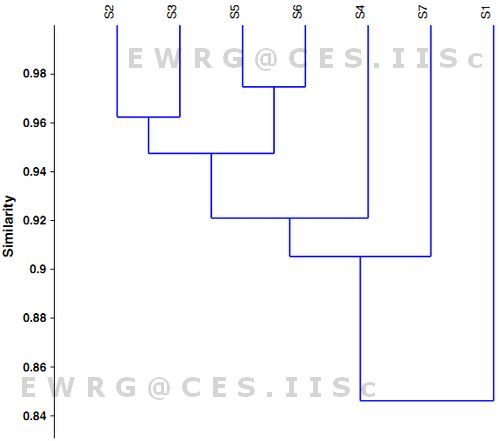
Bray-Curtis cluster analysis aided in the spatial similarity grouping of the seven sites with different bio-processes and treatment status in the sewage treatment ponds. The four separate clusters illustrate the nutrient concentration with the algal biomass and algal abundance (Figure 11). Cluster I (94.75% similarity) comprised of two sub clusters i.e. sites S5 and S6 thatindicated 97.5 % similarity and the other sub-cluster comprising of sites S2 and S3 showed 96.3 % similarity, which were attributed to similarities in the concentrations of DO, pH and NH4-N. The sites S4 and S7 had varied characteristics due to differences in their algal assemblage and nutrient concentrations. The site S1 stands out as a separate entity being highly anaerobic with a reduced state ofelevated organic matter, nutrient concentrations and very meager algal concentration. These techniques would eventually help in devising a proficient gradient specific way for a sustainable wastewater management through efficient monitoring and assessment.
Figure 11: Dendogram depicting the similarity in sites through clustering based on physico-chemical parameters, algal abundance and algal distribution in the pond.
Characteristics of Euglena Cells
Several criteria have been developed for evaluating the characteristic properties of the Euglena cells found in the culture at equilibrium conditions.
- Cell count, (C). The number or population of cells per ml. of the sample collected was observed to be 8 × 10⁵ cells/ml.
- Cell shape, (S). This is the average ratio of length to width of individual cells. The observations showed broadly two different types of cell shapes a) round with diameter of 40-50 μ and b) motile ones with length 90-100 μ and breadth 15-20 μ.
- Cell volume, (Vm). This is the real volume of a million cells, in mm3 and is determined by direct microscopic measurements of the cell. There were two forms the palmellar(round forms) and motile long forms as observed through microscopy. For the palmellar forms the cell volume was calculated to be 47569.5 μm3. The volume of the motile long forms were 28260 μm3
- Packed Volume, (Vp). This is the centrifuged volume in ml of the cells contained in 1 lt of the sample collected after centrifugation at 5000 rpm. The result is a function of cell count, the cell volume and cell shape. The packed volume was recorded to be 3 ml from 1lt. of the sample.
- Cell weight, (Wt.). This is the dry wt. of the cells in μg per million cells. The cell wt. was calculated to be 0.5 mg/ million cells.
- Cell density, (ρ). The cell density is derived from the dry wt. of the cells in mg/m3 of real volume. The cell density was calculated to be 480 g/m3.
- Cell Index, (I). The cell index is the packed volume per million cells (Vc/C) and is represented numerically as the packed volume in m3 of a million cells that is equal to 3.75 × 10⁻³ ml.
- Cell colour. Varies from very dark green to pea green to yellow-brown depending upon the cell types and availability of nutrients. Most of the cells were dark green in color.
- Cell types. Depending on the age and behavior, various types/forms of Euglena can be observed. a) Motile forms: the forms which were observed during their movements b) Palmellar forms: These are the matured forms which are found in the resting stage. These type of cellular structures encompasses many encystations inside mucilaginous layer c) Transitional forms which are the intermediate between motile and mitotic/palmellar stage d) Hyaline forms which are the cells without visible chlorophyll e) Swarmers the cells which are the motile forms hatching from palmellar forms and finally f) Mitotic forms which are the forms undergoing binary fission. The most dense Euglena cell populations are observed to occur when the retention period was around 7 days.
Algal Bio-volume (Vb): According to the above-mentioned measurements, the bio-volume was calculated as equivalents of the number of cells in unit volume expressed as V/V. From the earlier calculations (box provided above) the volume of the round palmellar forms and the long elongated motile cells were 47569.53 μm3 and 28260 μm3 respectively. Approximately, 70% of the cells were in the palmellar stage and the rest were in the motile phase. The cell number counts were 5.6 × 10⁵ to 2.4 × 10⁶, respectively. Thus, the contribution of the palmellar stage and the elongated motile cells towards biovolume were 2.66 × 1013 μm3 and 6.78 × 1012 μm3, respectively and the total biovolume per litre of the sample collected was calculated as 3.338 × 1013 μm3.
Algal Bio-mass Calculation: 10 litres of the water samples were collected and those were centrifuged to get 9.9462 g of wet wt. concentrate. The average dry wt. was found to be ~0.4g/l. An estimate for 1 m3 of the wastewater would contain of around 400 g of the algal biomass. From the conditions pertaining in the facultative pond, it was found that almost 10% of the pond was in anaerobic conditions and the rest was having phenomenal euglenoides growth. Out of 50,000 m2 of the surface area of the facultative lagoon, nearly ~5000 m2 was in anaerobic conditions. Hence, the remaining 45,000 m2 had been able to perform uninterrupted photosynthesis yielding a very high cell density of the order of ~106 cells/ml. And it was also noticed that the cells were very dense in the superficial layers of the pond (40-50cm) where presumably active photosynthesis takes place. Hence, the volume for the peak algal growth (exponential stage) during photosynthesis was found out to be 9000 m3. Considering the uniformity in the greenness of the entire aerobic region of the pond, the growth was assumed to be uniform throughout. Therefore, 3.5 tons of algal matter could be derived in the ponds per week if it is assumed that the average time to reach the exponential phase is 7 days. During the period of peak photosynthesis, 420 tons of algal dry wt. can be derived. Based on the earlier analysis, where the C content in case of microalgae’s was roughly around 40% (Mahapatra et al. 2011a,b,c), the present concentration of algae yields ~250 gCOD/m3 which is higher compared to ~100 gCOD/m3 (Weatherell et al. 2003) and ~70 gCOD/m3 (Sah et al. 2011).
The C content of the algal biomass was ~168 tons of C (average C content in algal biomass was about 40 %) of the standing population of algae. However, this huge quantity of C stock could not have been generated only through photosynthesis, but was mostly contributed by heterotrophic mechanism. Therefore, these algae are dependent on the organic C more than the inorganic C leading to a dual mixotrophic life. Here, algae take up the inorganic C during the availability of sunlight autotrophically and in the absence of light it switches over to a heterotrophic mode. During herterotrophic periods, the algal cells are noticed to store more lipids compared to the phototrophic phases (Xiong et al. 2010) which apportions the total C present into variable carbohydrate and lipids inside the cell depending upon many environmental factors. Studies have shown simultaneous wastewater treatment and algal biofuel production on a hectare scale (Craggs et al. 2012). However, further analysis is required to understand the heterotrophy of algae, and dependence of algaeon various bio-physical and chemical factors that allocate and sequester organic carbon. Larger population of Euglena might even feed on green algae and organic matter rapidly. This might be the reason for lower algal populations of green algae in the facultative ponds. It has been reported that NH4 stimulates heterotrophic CO2 fixation in Euglena. It has been possible to show that CO2 fixed heterotrophically by Euglena causes the formation of carbon skeletons for amino acid synthesis through tricarboxylic acid cycle and by another less well defined method (Peak et al. 1980).
Determination of Nutrient integrated efficiencies of the STP
The treatment parameters at different phases of treatment determine the biological decomposition, uptake of nutrients and the effect of the micro-environment on their growth and development. The major factors that affect the plant performance are the influent wastewater concentration, the loading rate, the type of micro-biota and the hydraulic detention time. Therefore, devising cumulative efficiency indices would help in the determination of the overall efficiency and hence, it would help in better decision making for further downstream treatment of wastewater.
Several indicators such as TSS, COD, BOD5 and ammonia removal efficiencies are used to comparatively analyzea variety of wastewater treatment systems in sewage firms (Colmenarejo et al. 2006). Nutrient integrated efficiency is computed considering an average of turbidity, filterable COD, filterable BOD, TN and TP removal efficiencies. This helps in the evaluation of the extent of treatment from the primary, secondary and tertiary treatment point of view. This reveals an average Nutrient Integrated Efficiency (NIE) of the effluent indicating an immediate requirement of an additional detention unit with the oxidative systems which would help the improvement of the NIE values for the wastewaters so that they can be directly discharged into the surface waters or can be directly used for irrigation with a minimal algal count. Oxidative pond based methods are good in treatment of sewage and removal of microorganisms (Jimenez 2007). Ideally, the efficiency of such systems according to the Tropical climate should be closer to 90%. The newly devised nutrient integrated efficiency is given by
NIE = 1/5 [ETUR + ECOD + EBOD5 + EN + EP]
= 62.8%
Where, NIE is the Nutrient Integrated Efficiency in (%),
ETUR is average efficiency of turbidity removal (%),
ECOD is average efficiency of COD removal (%)
EBOD5 is average efficiency of BOD5 removal (%)
EN is average efficiency of Nitrogen removal (%)
EP is average efficiency of Phosphorus removal (%)
|
