|
Material and Method
Mysore with the elevation of 650 m (meters above mean sea level) lies between 12°9’– 11°6’ N and 77°7’–76°4’ E (Figure 1a) in Karnataka. The region is a historic princely province with the current population of about 0.983 million (in 2011) compared to 0.795 million in 2001. The temperature ranges from 14 to 34°C and the monsoon showers start from the end of May and continue till October. Prominent lakes of the city are Kukkarahalli, Karanji and Lingambudhi. Domestic water requirements in the city aremet mainly by Cauvery and Kabini rivers and partly by groundwater sources (at outskirts).
Study Area
The waste water generated in Mysore city by virtue of gravity finds its way into three valleys. Northern drainage system leads to 30.0 MLD STP (mechanical system with aerators) at Kesare Village, Mysore. The southwestern drainage flow connects to 67.65 MLD Vidyaranyapuram STP (Biological treatment thatuses essential microorganisms (OS-1&2) inoculum) before entering Dalvai kere. Further south is the 60 MLD Rayankere STP (remediation based on Fermenta’s bacillus) at H. D. Kote Road. The field investigations have been carried out at Vidyaranyapura STP, located between 12.273681º- 12.270031° N and 76.650737° -76.655947° E, adjacent to solid-waste landfill site at the foothills of Chamundi hills in the catchment slope of the feeder to Dalvai lake. The STP consists of two facultative lagoons (each of 5.05 ha of area and 3.5m depth) and two maturation ponds (each of 2.5 ha of area and 1.5m depth). Table 1 lists the details. The treated water traverses about 20 km via the Dalvai kere and finally reaches Kabini river, which is a drinking water source. This necessitates the investigation of the STP’s treated effluent to ensure non-contamination of Kabini water. The residence time is computed as per equation 1, considering the flow as laminar with parameters such as volume (of a lagoon) and mean flow.
Q = V/ t…………………………………………….……………. (1)
Where, Q = Mean flow of wastewater (MLD);
V = Lagoon Volume (L); and
t = residence time in days (d)
The mean residence time of wastewater is 11.8 and 2.5 days respectively at the facultative and maturation ponds.
Figure 1a: Sewage Treatment Plant at Vidyaranyapura
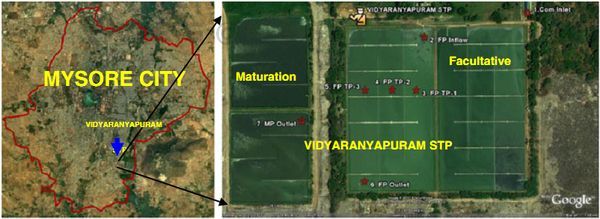
Table 1: Site specifications with residence time at Vidyaranyapuram STP
| Lagoon |
Length
(m) |
Width (m) |
Depth (m) |
Surface (m2) |
Volume (m3) |
Detention time (d) |
| Facultative Lagoon (2) |
312 |
162 |
3.5 |
50544 |
176904 |
11.8 |
| Maturation pond (2) |
172 |
145 |
1.5 |
24940 |
37410 |
2.5 |
| |
|
|
|
|
|
14.3 |
Assessment of Treatment Efficiency
Treatment efficiency of STP was assessed based on regular monitoring (seasons) carried out during 2010-11. Samples of the raw influent [1] at various points [2, 3, 4, 5 and 6] of facultative ponds and maturation ponds [7] were collected during the monsoon and the summer seasons (Figure 1b). Parameters such as dissolved oxygen (DO), pH, electrical conductivity (EC), oxidation reduction potential (ORP), turbidity were measuredon the site. Samples were also analyzed for Chemical Oxygen Demand (COD) on the spot. Samples were collected in disinfected plastic containers (21) and were brought to the laboratory for further analysis. Various organic and inorganic analyses were performed as per APHA protocol (APHA 2005). Samples were tested for filtrable and non-filtrable BOD (Biochemical Oxygen Demand), COD, TKN (Total Kjeldahl Nitrogen), Amm-N (NH4-N), Nitrite-N (NO2 –N), Nitrate-N (NO3–N), Ortho-phosphates (OP) and total phosphates (TP) with other physico-chemical parameters.
Figure 1b: Inflow and Outflow parameters at Vidyaranyapuram STP, Mysore
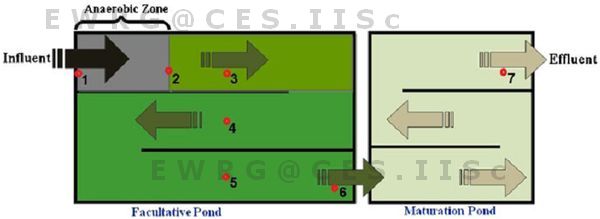
Note: Sampling locations are marked - 1 (inlet) to 7 (outlet)
Computation of Algal productivity
Algal samples collected from sampling locations were identified using standard keys (Prescott 1973;1982) based on their external appearance, colour, morphological characteristics, size, habitat, structure and orientation of chloroplast, cellular structure and pigments etc. Wastewater samples collected wereconcentrated by centrifuging 15 ml volume. Algae were enumerated using 3 replicates of 20 µl of the concentrated sample where it was placed over the slides with cover slips for microscopic observations and density was computed by equation 2 which determines the ratio of number of cells counted in the given quantity of water sample.
Number of organisms counted
Number of algal cells/ml = ------------------------------------------ ……. (2)
Quantity of water sample in a slide
Algal samples were observed under a microscope and algal bio-volume was calculated which was later equated with algal weight. Samples collected from the field were dried for computing the total dry wt. Quantification for unit area/volume was performed by taking 10 L volume for algal samples and the temporal algal productivity was estimated with periodic assessment of dry weight and volume of water (Hillebrand 1999).
Data Analysis
Non-parametric Spearman’s rank correlation coefficient (r) is computed to explore significant relationships between changes in physico-chemical variables againstbiological variables (relative abundance of algal species). Multivariate analysis (Martin-Cereceda et al. 2002) - Canonical Correspondence Analysis (CCA) was performed to understand transitions in biological communities with the varying physico-chemical variables to know relationships among them. Higher variability in abundance was tackled by log10 transformation of the values. Bray-Curtis Cluster Analysis (CA) was performed in order to find out the spatial similarity and patternsacross sites. These statistical analyses were carried out using open source statistical package PAST 2.14 (downloaded from http://www.nhm.uio.no/norlex/past/download.html).
|
