Results
Diatom distribution
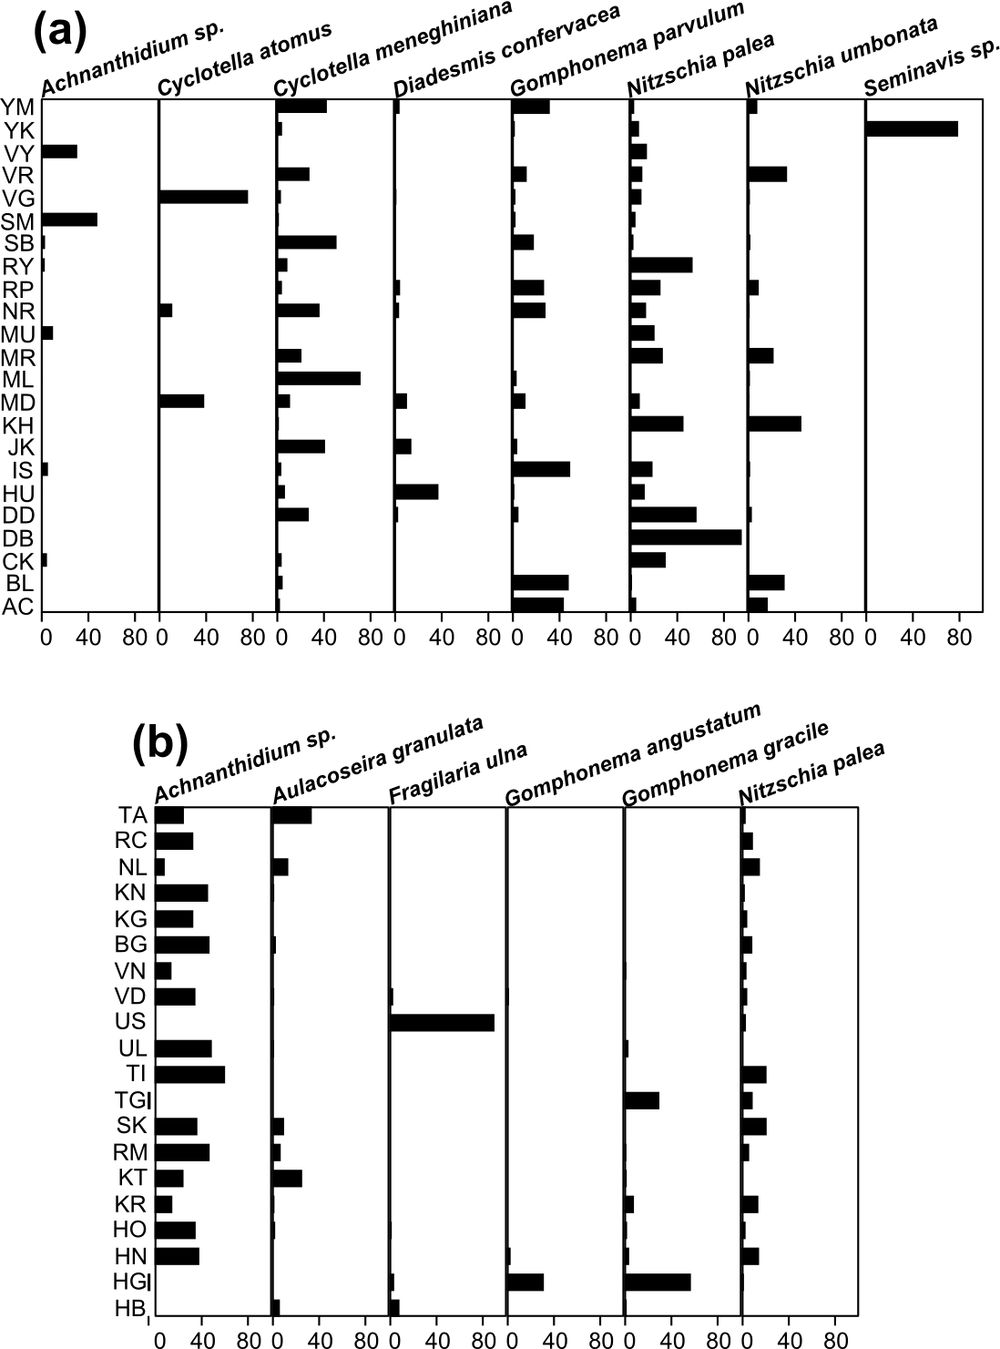
A total of 181 diatom taxa belonging to 45 genera were identified from 43 wetlands (refer annexure 2). Achnanthidium sp., Gomphonema sp. and Nitzschia sp. were considered for a detailed taxonomical investigation using scanning electron microscopy (SEM) due to the complexity of these species and its characteristics. Among all, only 6% of total taxa showed a relative abundance (RA) of >50%, hence species with >10% RA present in at least 1 sampling site was considered for further analysis. Distribution of diatoms with species composition has been given in Figure 2a & b. Figure 2a comprised sampling sites with occurrence of >10% RA of Cyclotella meneghiniana Kütz., Nitzschia palea (Kütz). W.Sm., Seminavis strigosa (Hust.) Danielidis et Econ.-Amilli and Gomphonema parvulum Kütz. or either one of these species. Wetlands in Figure 2b predominantly contained Achnanthidium sp. in almost all sites, while, Fragilaria ulna var. acus (Kütz.) Lange-Bert., being abundant at Ulsoor wetland, reflected a conductivity rich condition. Other taxa unique to a specific wetland were Gomphonema gracile Ehrenb. at Hesaraghatta (HG), Navicula symmetrica Patrick at Chickbanavara (CK), Gomphonema dharvarensis Gandhi at Somapura (SM), Nitzschia taylorii Alakananda et al. and Gomphonema spiculoides Gandhi at Begur (BG).
Fig. 2. Diatom composition and relative abundance of the dominant and common diatom species across 43 wetlands.
(Refer annexure 2 for all recorded taxa)
Water quality analysis
Table 1 reveals that there is a considerable variation in the water chemical characteristics in the wetlands of Bangalore region. Increasing levels of conductivity, biological oxygen demand and chemical oxygen demand were recorded in wetlands of urban pockets. High levels of electric conductivity (range, 46 – 11025 µS cm-1) was recorded at Varthur, Rampura, Anchepalya, Doddanekundi, Yellamallappa chetty and Yelahanka wetlands which were characterized as highly populated and industrially developed regions, where pollution levels exceeded the Bureau of Indian Standards [BIS] of surface waters. Dissolved oxygen levels have been recorded as 0 or <0 mg L-1 at sewage fed wetlands located at northwest and southeast parts of Bangalore region, which also comprised of high-mineralized inflow. Untreated sewage was found to be the main source of pollution at densely populated sites while lower conductivity and high oxygen levels (10.7 mg L-1) were recorded in wetlands located in rural / peripheral region. Due to the degradation and low oxygen levels, these wetlands showed increased levels of biological oxygen demand (range, 2.2 – 73.09 mg L-1) and chemical oxygen demand (range, 10.7 – 240 mg L-1). The superfluous amount of chlorides (range, 28 – 859 mg L-1) in water indicates the accumulation of salt from road construction and domestic waste inflow. During the present study, the hardness varied from 64 to 766 mg L-1, phosphate varied from 0.02 to 2.74 mg L-1 and nitrate varied from 0.01 to 2.11 mg L-1.
Table 1: Details of average and range (maximum (Max) & minimum (Min)) of selected water quality variables from Bangalore region’s wetlands.
| Water quality variables (Units) | Min. | Max. | Average |
| pH | 7.03 | 9.98 | 8.6 |
| Water Temperature, WT (°C) | 20.8 | 35 | 29.47 |
| Electric conductivity, EC (µS cm-1) | 46 | 11025 | 1387 |
| Total Dissolved Solids, TDS (mg L-1) | 28 | 7660 | 1002 |
| Salinity, SAL (mg L-1) | 17 | 5415 | 687.2 |
| Dissolved oxygen, DO (mg L-1) | 0.0 | 10.73 | 6.3 |
| Biological oxygen demand, BOD (mg L-1) | 2.21 | 73 | 22.3 |
| Chemical oxygen demand, COD (mg L-1) | 10.7 | 240 | 59.2 |
| Nitrates, N (mg L-1) | 0.01 | 2.11 | 0.34 |
| Phosphates, P (mg L-1) | 0.01 | 2.74 | 00.57 |
| Total Hardness, TH (mg L-1) | 64 | 766 | 257.3 |
| Chlorides, CL (mg L-1) | 28 | 859 | 225.8 |
| Total Alkalinity, ALK (mg L-1) | 92 | 1080 | 377 |
Detrended Canonical Correspondence analysis (DCCA)
Detrended Canonical correspondence analysis (DCCA) provided the ordination of species in relationship with chemical variables (Fig. 3; Table 2). The species-environmental correlations in DCCA axis 1 (0.827) and axis 2 (0.705) were significant (p< 0.01) explaining 29.5 % and 17.4% of the species environmental relation with eigenvalues of 0.489 and 0.288 respectively. The axis 1 mainly showed eutrophication level, but also correlated with parameters related to organic/inorganic pollution. Staurosira pinnata and Fragilaria ulna var. acus had a larger score, while species such as Gomphonema spiculoides and Gyrosigma rautenbachiae had a relatively small score. The axis 2 was mainly explained by pH. Amphora veneta and G. rautenbachiae had a larger score (i.e. negatively correlated with pH), while Gomphonema angustum had a relatively small score (i.e. positively correlated with pH).
Figure 3 DCCA ordination diagrams of diatom communities’ samples from 106 sampling sites. The arrow and labels in red indicates the environmental variables, numbers refers to sampling sites (refer annexure 1) and labels in italics refers to species name (Refer annexure 2)
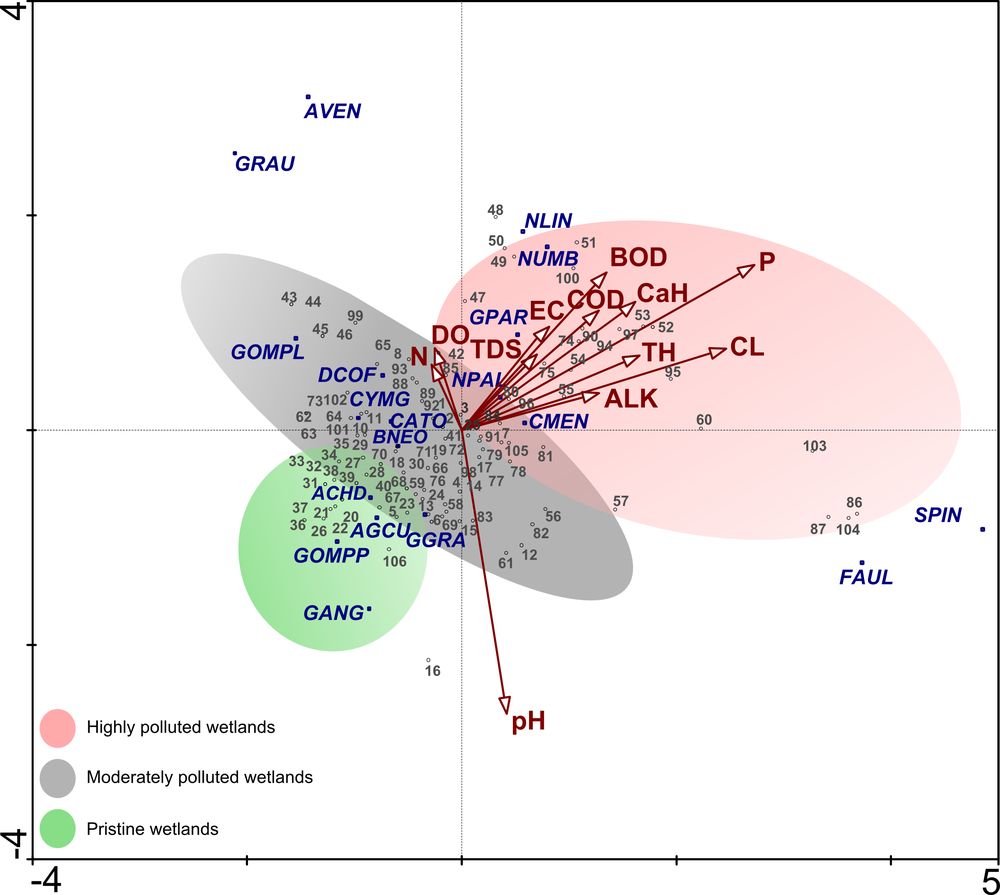
Table 2 Summary of the Detrended canonical correspondence analysis (DCCA) for 43 wetlands.
| Axes | 1 | 2 | 3 | 4 | Total inertia |
| Eigenvalues | 0.489 | 0.288 | 0.177 | 0.094 | 8.001 |
| Species-environment correlations | 0.827 | 0.705 | 0.606 | 0.437 | |
| Cumulative percentage variance species data: species-environment relation: |
6.1 | 9.7 | 11.9 | 13.1 | |
| 29.5 | 46.9 | 57.5 | 63.2 |
TWINSPAN
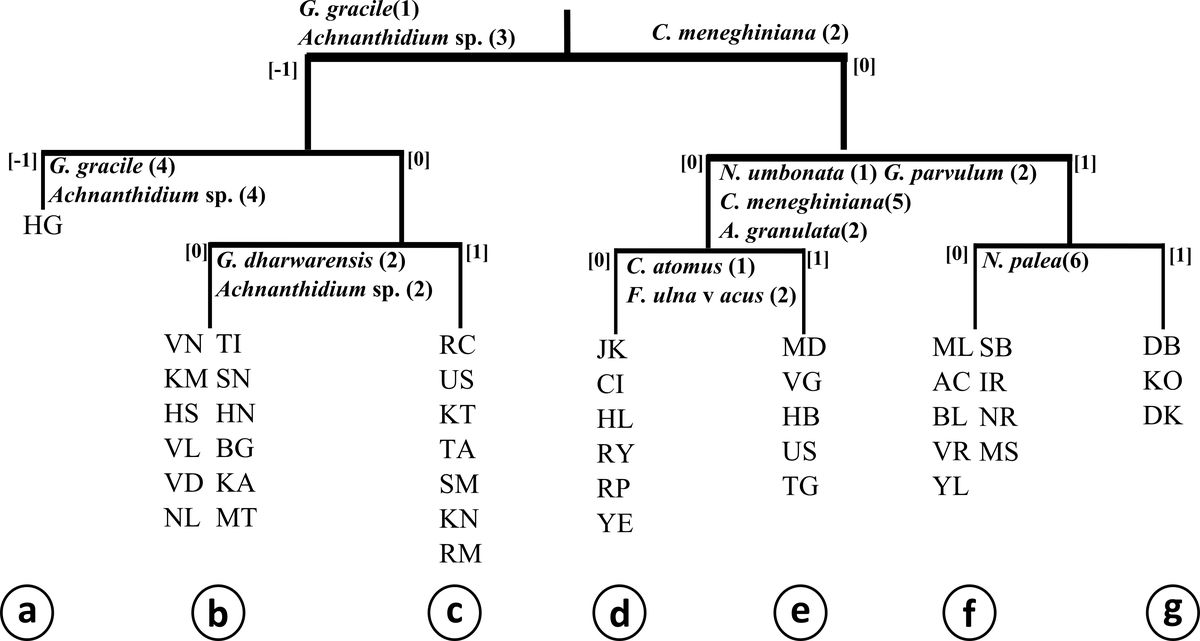
Classification analysis using TWINSPAN (Fig. 4) resulted in 7 groups from 106 samples. The first TWINSPAN division separated oligo-mesotrophic electrolyte- poor wetlands from eutrophic, electrolyte- rich wetlands. A further division (on the left side) aided in distinguishing oligotrophic wetland Hesaraghatta (HG) from the rest of the sites, which are under mesotrophic/ moderate pollution (as in DCCA). This group was indicated by Achnanthidium sp. The division towards right half covered 2 groups i.e., eutrophic wetlands indicated by Cyclotella atomus Hust. and F. ulna var. acus and, hypertrophic group dominated with N. palea. The other indicator taxa recognized were N. umbonata, C. meneghiniana and G. parvulum. Indicator species Gomphonema gracile Ehrenb., G. dharwarensis and Achnanthidium sp. were differential species for groups A to C while G. parvulum, C. meneghiniana and N. umbonata were differential for groups D, E. Groups F and G were dominant and characteristic with N. palea. Group A to C sites covered wetlands that were classified into oligo-mesotrophic (DCCA) and sampling sites under D-E comprising of eutrophic status wetlands that were clustered as meso to eutrophic in Figure 3. However, TWINSPAN groups F and G comprised of severely polluted wetlands that are hypereutrophic sites dominated by mixotrophic species N. palea.
Figure 4 Indicator species of the main divisions from TWINSPAN classification for 43 samples.
[The numbers following the species name indicate the categories of relative abundance (1, 0–2%; 2, 2–5%; 3, 5–10%; 4, 10–20%; 5, 20–40%)] (refer annexure 1 for wetland codes)