 |
NESTEDNESS PATTERN IN STREAM DIATOM ASSEMBLAGES OF CENTRAL WESTERN GHATS |
1 Energy & Wetlands Research Group, Centre for Ecological Sciences, Indian Institute of Science, Bangalore – 560 012, India
2 Department of Botany, Yuvaraja’s College, Mysore - 570 005, India
E-mail: karthick@ces.iisc.ac.in, maheshkapanaiah@yahoo.co.in, cestvr@ces.iisc.ac.in
- Abstract
- Introduction
- Materials and Methods
- Results
- Discussion
- Conclusion
- Acknowledgement
- References
- Home
Materials and Methods
Diatom sampling
24 stream sites comprising only first and second streams from Central Western Ghats (Figure 1) were sampled during October 2007 to February 2008 (the post monsoon season) using a strictly standardized field protocol(34). The stream sites belongs to three ecoregions of the Western Ghats namely, Sawanthwadi-Kayna valley, Aghanashini Valley-Terikhol valley and Pushpagiri-Sharavathi valley, which includes from the river basins of Netravathi, Seethanadi, Swarna, Gurupur, Sharavathi, Aghanashini, Bedthi, Kali, Mandavi, Terekhol and Krishna. At each site three to five stones were selected randomly across the stream. Diatoms were scraped off these stones as subsamples using a tooth brush. Subsequently, the subsamples were pooled into a composite sample for each site. Fresh samples were carefully checked to guarantee that most diatom frustules were alive before acid combustion. Almost all diatom cells had cytoplasmic contents, and thus hot HCl and KMnO4 method(34) were preferred to obtain clean frustules devoid of organic material. Cleaned diatoms were mounted in Pleurax for further microscopy analysis. A total of 400 frustules per sample were identified and counted using compound light microscopy (magnification 1000×). Diatoms were identified primarily to the species level according to Taylor et al.,(35), Krammer and Lange-Bertalot(36) and Lange-Bertalot and Metzeltin(37).
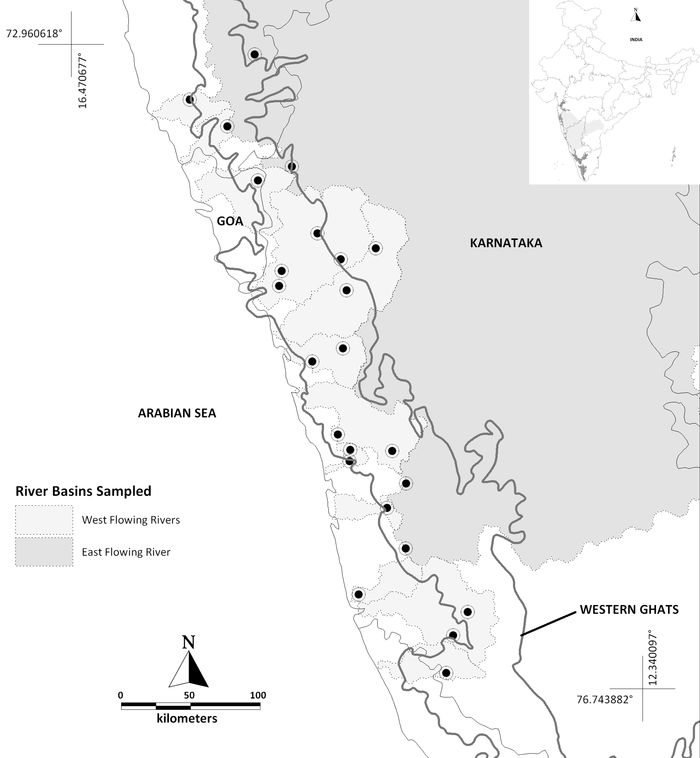
Figure 1: Map of Central Western Ghats showing the sampling sites
Water quality variables
Water quality variables such as pH, water temperature (°C), total dissolved solids (mgL-1), salinity (mgL-1) and nitrates (mgL-1) were recorded at sampling site using EXTECH COMBO electrode and Orion Ion Selective Electrode. Other parameters like chloride, hardness, magnesium, calcium, sodium, potassium, sulphates and phosphates were analyzed in laboratory. All analyses were carried out as per standard methods for the examination of water(38).
Nestedness analysis
A presence-absence matrix (matrix having sites in rows and species in columns with 1 for presence and 0 for absence) was constructed for stream diatoms for nestedness calculation. The degree of nestedness was calculated using nestedness calculator(39,40). The metric ‘T’ of the “nestedness calculator” measures the extent of unexpected presences and absences in a maximally packed matrix, where sites are arranged in rows in descending order according to their species richness and species are arranged in columns according to the number of sites on which they occur. The metric T = 0° for a set of perfectly nested assemblages, and T = 100° for completely disordered one. The null hypothesis that T is not lower (i.e., more nested) than expected by chance, which was tested using Monte Carlo permutations(41).
Statistical Analysis
Mantel tests correlations were used to elucidate the role of environmental and spatial factors in determining the species assemblages. The Mantel test estimates the intensity of the relationship between two variables and calculates a statistic that is similar to Pearson’s correlation coefficient (r). The value of the Mantel statistic can vary from −1 to +1 and is typically calculated between two matrices, each containing the distance (or similarity) elements calculated for each pair of values of a variable. Partial Mantel test is used to examine the influence of environmental factors on diatom assemblages, while holding geographical distance constant(42) and vice versa with 1000 permutations using statistical package R(43). Principal component analysis was performed using R for the water quality variables to elucidate the important physical and chemical variables. The relationships between matrices of distance in species assemblages (using Bray–Curtis quantitative distance measure), environmental distance (matrix of Euclidean distances of ranked values of individual parameters) and the geographic distance of the localities (aerial distances in kilometre were calculated using Mapinfo 7.5. between sampling localities) were used in Mantel and partial Mantel test(44).
| * Corresponding Author : | |||
| Dr. T.V. Ramachandra Energy & Wetlands Research Group, Centre for Ecological Sciences, Indian Institute of Science, Bangalore – 560 012, INDIA. Tel : 91-80-23600985 / 22932506 / 22933099, Fax : 91-80-23601428 / 23600085 / 23600683 [CES-TVR] E-mail : cestvr@ces.iisc.ac.in, energy@ces.iisc.ac.in, Web : http://wgbis.ces.iisc.ac.in/energy |
|||