| Back | Results and Discussion |
Next |
Sorption equilibria studies
The chromium uptake capacity of the bgh was evaluated using the Langmuir and Freundlich adsorption isotherms. The Langmuir isotherm represents the equilibrium distribution of metal ions between the solid and liquid phases. The following equation can be used to model the adsorption isotherm:
![]()
where q is milligrams of metal accumulated per gram of the biosorbent material; Ceq is the metal residual concentration in solution; qmax is the maximum specific uptake corresponding to the site saturation and b is the ratio of adsorption and desorption rates (Chong and Volesky, 1995). The Langmuir isotherm is based on these assumptions (Langmuir, 1918).
When the initial metal concentration rises, adsorption increases while the binding sites are not saturated. The linearised Langmuir isotherm allows the calculation of adsorption capacities and the Langmuir constants and is equated by the following equation.
![]()
The linear plots of Ceq /q vs Ceq show that adsorption follows the Langmuir adsorption model ( Figure 1 ) The correlation coefficient is 0.9948 (regression coefficient 0.9896). q max and b were determined from the slope and intercept of the plot and were found to be 91.64 mg/g and 0.009 l/mg respectively.
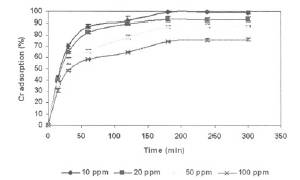
Figure 4. Percentage biosorption of Cr (VI) from solution of different concentration, pH 2.0, by 10 gl-1 bgh as related to the time of contact at 120 rpm.
The essential characteristics of the Langmuir isotherms can be expressed in terms of a dimensionless constant separation factor or equilibrium parameter, RL , which is defined as:
![]()
Where b is the Langmuir constant and C o is the initial concentration of Cr (VI). The RL value indicates the shape of isotherm as given in Table 1 .
According to McKay et al. (1982) , RL values between 0 and 1 indicate favourable adsorption. The RL were found to be 0.8475 to 0.15625 for concentrations of 20-600 mg/l Cr (VI).
The Freundlich isotherm is represented by the equation (Freundlich, 1907):
q= Kf Ceq1/n |
where Ceq is the equilibrium concentration (mg/l), q is the amount adsorbed (mg/g) and Kf and n are constants incorporating all parameters affecting the adsorption process, such as adsorption capacity and intensity respectively. The linearised forms of Freundlich adsorption isotherm was used to evaluate the sorption data and is represented as:
ln q = ln Kf + 1/n ln Ceq |
Kf and n were calculated from the slopes of the Freundlich plots (Figure 2) The constants were found to be Kf = 2.815 and n=1.814. According to Kadirvelu and Namasivayam (2000) , n values between 1 and 10 represent beneficial adsorption.
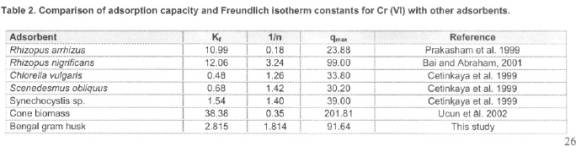
The comparison of Freundlich constants with adsorption capacity for Cr (VI) with other adsorbents is given in Table 2 .
Figure 1 and Figure 2 conforms with the Langmuir and Freundlich models. The Langmuir capacity or q max is used to compare the efficiency of bgh with other materials, which have been tested as biosorbents for Cr (VI). Table 2 shows that, for Cr (VI), the bgh has a greater capacity than some of the materials. The magnitude of Kf and n shows easy separation of heavy metal ion from wastewater and high adsorption capacity. The value of n, which is related to the distribution of bonded ions on the sorbent surface, is found to be greater than unity for bgh, indicating that adsorption of Cr (VI) is favorable.
Effect of pH
Chromium exhibits different types of pH dependent equilibria in aqueous solutions. As the pH is shifted, the equilibrium will also shift; in the pH range 2-6, HCrO4- , and Cr2O72-, ions are in equilibrium. At lower pH (pH <2.0) values, Cr3O10- and Cr4O132- species are formed.
The optimum initial pH for biosorption of hexavalent chromium on to bgh (husk of Cicer arientinum ) was observed at pH 2.0. This indicates the formation of more polymerized chromium oxide species with decreased pH.
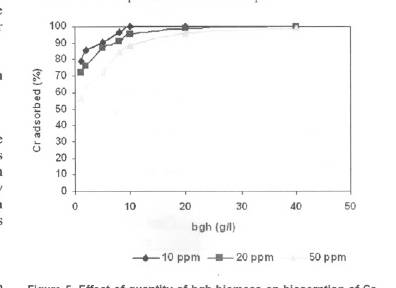
Figure 5. Effect of quantity of bgh biomass on biosorption of Cr (VI) from solutions of different concentrations, pH 2.0 for contact time 200 min at 120 rpm .
As illustrated in Figure 3 , 99.6% of Cr ions was adsorbed from a solution of 10 mg/l at pH 2.0, whereas a 23% reduction in biosorption was determined as the pH shifted from 2.0 to 4.0. The percentage of Cr ions adsorbed at pH 2.0 decreased with increasing metal concentration. The adsorption of metal ions depends on solution pH, which influences electrostatic binding of ions to corresponding metal groups. At the optimum sorption pH 2.0, the dominant species of Cr ions in solution are HCrO4- , Cr2O72, Cr4O132- and Cr3O10-. These chromate anions interact strongly with the negatively charged ions of the bgh matrix.
Biosorption Kinetics and effect of biomass quantity on chromium uptake by bgh
The concentration of both the metal ions and the biosorbent is a significant factor to be considered for effective biosorption. It determines the sorbent/sorbate equilibrium of the system. The rate of adsorption is a function of the initial concentration of ions. The kinetic profiles of the chromium biosorption at various concentrations are shown in Figure 4 . The system attained equilibrium, although not as fast as reported in other concentrations.
The time taken to attain equilibrium for 10, 20, 50 and 100 mg/l chromium solution were 180 min. But as the chromium concentration increased, the percentage of chromium biosorption progressively decreased from 99.65% in 10mg/l to 75% in 100mg/l solution, even though the sorption equilibrium was achieved during the same period of 180 min. This appears to be due to the increase in the number of ions competing for the available binding sites in the biomass and also due to the lack of binding sites for the complexation of Cr ions at higher concentration levels. At lower concentrations, all metal ions present in the solution would interact with the binding sites and thus facilitated 100% adsorption. At higher concentrations, more Cr ions are left unabsorbed in solution due to the saturation of binding sites. The agitation time was fixed at 200 min for the rest of the experiments.
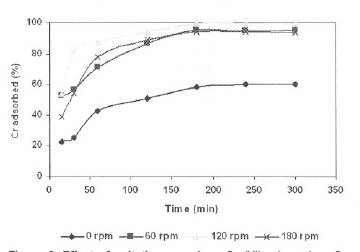
Figure 6. Effect of agitation speed on Cr (VI) adsorption, Cr concentration = 50 mgl-1pH = 2.0, bgh dose = 10 mgl-1
For the confirmation of this decline to be due to the saturation of the sorption sites, bgh biomass was varied from 1 to 40 g/l and brought in contact with chromium solutions of different concentrations. For 99% removal of chromium from 10, 20 and 50 mg/l metal solutions, the bgh biomass required was 10, 20 and 40g/l at approximate ratio of 1:1000. The rate of increase of chromium removal was not proportionate to the increase in bgh biomass, (Figure 5). This could be attributed to interference between binding sites at higher concentrations (Puranik and Paknikar, 1999). Higher chromium sorption at lower levels of bgh biomass could be due to the higher metal to biosorbent ratio, which decreases as the biomass quantity is increased (Puranik and Paknikar, 1999).
Effect of agitation speed
The effect of the agitation of the sorbent/sorbate system in Cr adsorption was monitored at low, medium and high speed of agitation using a non-agitated system as the control.
All agitation speeds were found to have a positive impact over the non-agitated system as shown in Figure 6 . A 30 - 40% increase in adsorption was observed in agitated samples during 120 min of biosorption. This is because agitation facilitates proper contact between the metal ions in solution and the biomass binding sites and thereby promotes effective transfer of sorbate ions to the sorbent sites. At 60 and 180 rpm, the adsorption rates monitored were found to be slightly lower than that at 120 rpm. These results indicate that the contact between solid and liquid is more effective at moderate agitation (120 rpm). This observation agrees with the previously reported biosorptive removal of Cr (VI) by Rhizopus arrhizus (Niyogi et al. 1998 ) and Rhizopus nigricans (Bai and Abraham, 2003), where 100 and 120 rpm respectively were found to be the optimum speed.
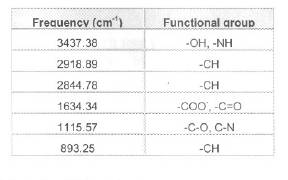
Table 3. IR absorption bands and corresponding possible groups.
Infra red spectral analysis
An un-reacted bgh sample and bgh pre-treated with 100 mg/l Cr (VI) solution were analysed using FTIR, and the percentage transmission for various wave numbers are presented in Figure 7 and Figure 8 respectively. The absorption bands identified in the spectra and their assignment to the corresponding functional groups in the bgh are listed in Table 3 .
Wave number of 3000 and 3750 cm-1 for bgh indicates the presence of OH groups on the husk surface. The trough that is observed at 2918.18 cm-1 and 893.25 cm-1 indicates the presence of C-H groups. The 1634.34 cm-1 band is a result of CO stretching mode, conjugated to a NH deformation mode and is indicative of amide 1 band. The trough at 1115.57 cm-1 is due to CO or CN groups. This reveals the presence of several functional groups for binding Cr (VI) ions on bgh surface.