|
RESULTS
The survey along this 130 km long transect passing through three basic vegetation zones from the coast to the mountain and beyond into the plateau, intermittently sampled by point centred quarter, revealed 134 tree species from 106 genera and 43 families and 146 shrub layer species from 128 genera and 58 families (Fig. 4). Sector-7, a mid-altitude transect with a sacred grove accounted for 48 tree species, the highest among all transects. The sector-6, also in a similar region adjoining, was good with 41 species of trees followed by sector-1 with 40 tree species and also having a sacred grove (Fig. 5). The sectors 9 and 10 falling in the eastern plain region had relatively low number of species and dominated by teak.
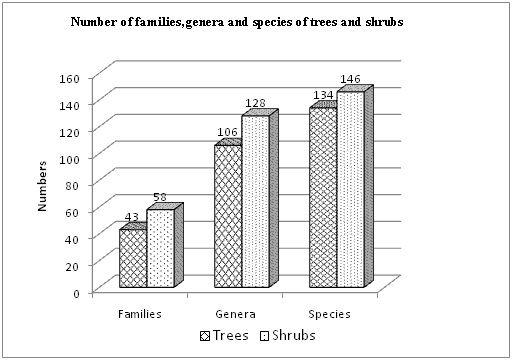
Fig. 4. Total number of tree and shrub species recorded in the study region
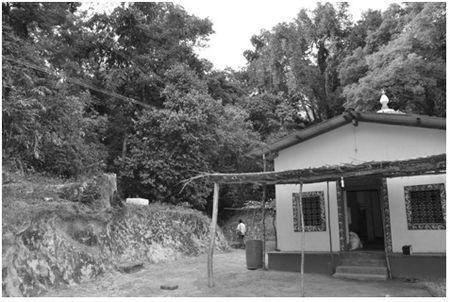
Fig. 5. A sacred grove with a shrine in Sector 1
Shannon diversity index showed that the sectors 6, 7 and 8, falling in the main zone of central Western Ghats, had the highest plant species diversity (Fig. 6). Shannon diversity value was also high for sector 7 (3.47) followed by sector 6 (3.36) and sector 1 (3.3). Sectors 9 and 10 were found to be having the least Shannon diversity values (1.8 and 2).
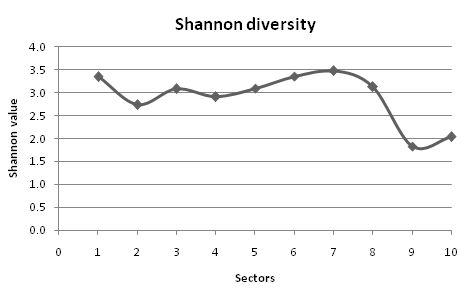
Fig. 6. Shannon diversity index values for the various sectors in the study region
Highest tree endemism (45%) was in mid altitude Sector 6 (Figure 7), which also had higher evergreeness (87%). Tree basal area/ha and tree density/ha revealed that Sector 6, had both the highest estimated basal area/ha (84.15 m2) and the highest tree density/ha (598). Sector 10 characterized by degraded teak plantations had the least basal area (2.24 m2) and lowest tree density (33 trees/ha) (Figs. 7, and 8).
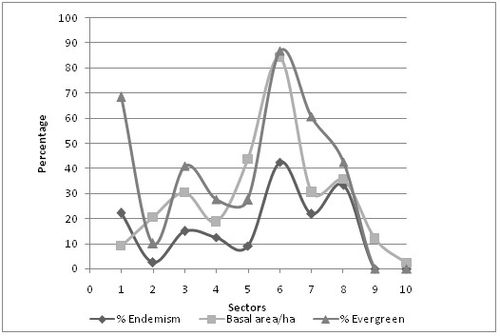
Fig. 7. Percentage endemism, percentage evergreeness and Basal area/ha
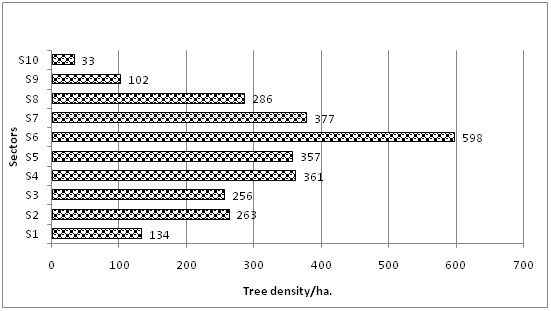
Fig. 8. Tree density/ha values for the different sectors in study area
Cluster analysis based on tree and shrub layer species similarity and Important Value Index (IVI) (Fig. 9) reveals three different clusters. The first cluster comprised of mainly low altitude sectors 2, 3, 4 and 5 belonged to the coastal taluk of Ankola. The second cluster included low altitude sectors 1 from the coast and mid-altitude 6, 7 and 8.
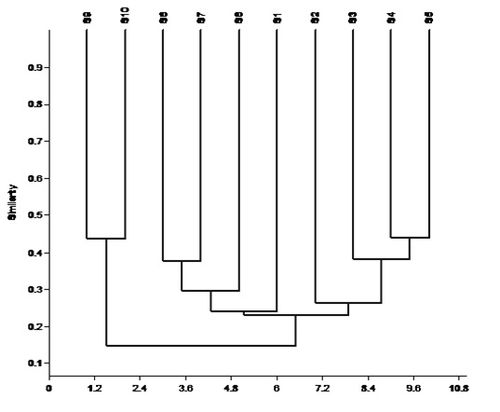
Fig. 9. Cluster analysis using Jaccard’s similarity index
|
