|
MATERIAL AND METHODS
The study was carried out along altitudinal gradient from the coast (Ankola taluk, Uttara Kannada district) through undulating terrains of Yellapur (in Uttara Kannada district) to plains (Kalghatgi taluk bordering the Deccan plains in the Dharwad district). The vegetation was studied through sampling at 10 (S1, S2, to S10) different localities using point center quadrat (William 2006) along the varying topographies with diverse vegetation (Fig. 1, Table 1). The sampling localities S1 to S4 (Ankola to Ramanguli stretch with lower altitudes) comprised of a variety of terrestrial vegetation types, especially semi-evergreen to moist deciduous forests with several degraded and denuded areas with lateritic surface. The localities S5 to S7, (mid altitudes) located in the Ghats proper comprised of lofty evergreen to semi-evergreen forests forming a mosaic with other forest types such as moist deciduous and scrub savannah, the products of degradation of the original forest type. The samples S8 to S10 (mid altitudes) fall in the eastern plains of Uttara Kannada and in Dharwar district which are mostly dotted with moist deciduous to dry deciduous forests owing to lower rainfall (Fig. 2).
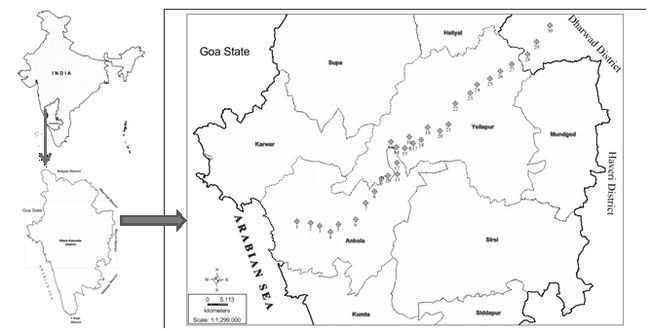
Figure 1: Study area altitudinal gradient from coast to plains (Uttara Kannada and part of Dharwad district) with vegetation sampling points
Table 1: The geographical co-ordinates and vegetation types of the sectors in study area
| S. No. |
Sectors |
Sampling points |
Taluk |
Altitude (m) |
Habitat type |
| 1 |
S1 |
Kattangadde |
Ankola |
59 |
Moist deciduous forest |
| 2 |
Navgadde |
Ankola |
108 |
Evergreen to Semi-evergreen forest |
| 3 |
Agasur |
Ankola |
56 |
Semi-evergreen to moist deciduous forest |
| 4 |
S2 |
Balaikoppa |
Ankola |
33 |
Moist deciduous forest |
| 5 |
Mundigadde |
Ankola |
28 |
Teak mixed moist deciduous forest |
| 6 |
Badgon |
Ankola |
28 |
Moist deciduous forest |
| 7 |
S3 |
Hegdekoppa |
Ankola |
48 |
Moist deciduous forest |
| 8 |
Sabguli |
Ankola |
96 |
Semi-evergreen |
| 9 |
Kasinmakki |
Ankola |
77 |
Moist deciduous forest |
| 10 |
S4 |
Nuglegudda-Vajralli |
Yellapur |
154 |
Semi to moist deciduous forest |
| 11 |
Ramanguli |
Ankola |
125 |
Moist deciduous forest |
| 12 |
Mundegali |
Ankola |
157 |
Moist deciduous forest |
| 13 |
S5 |
Near Gidgar |
Yellapur |
455 |
Semi-evergreen to moist deciduous forest |
| 14 |
Kattangadde-Tarepal |
Yellapur |
297 |
Moist deciduous forest |
| 15 |
Yammalli |
Yellapur |
438 |
Evergreen forest |
| 16 |
S6 |
Tarekunte-Mattihakal |
Yellapur |
394 |
Evergreen to semi-evergreen forest |
| 17 |
Birgadde |
Yellapur |
367 |
Semi-evergreen to evergreen forest |
| 18 |
After Mulesal |
Yellapur |
442 |
Semi-evergreen forest |
| 19 |
S7 |
Arlihonda-Near Idugundi |
Yellapur |
463 |
Evergreen to semi-evergreen forest |
| 20 |
Kumarmane |
Yellapur |
499 |
Moist deciduous forest |
| 21 |
Nandvalli |
Yellapur |
547 |
Semi-evergreen to moist deciduous forest |
| 22 |
S8 |
Yellapur -Mundgod road |
Yellapur |
536 |
Moist deciduous forest |
| 23 |
Hosgadde |
Yellapur |
548 |
Moist deciduous forest |
| 24 |
Mavalli |
Yellapur |
547 |
Moist deciduous forest |
| 25 |
S9 |
Kunginkoppa |
Yellapur |
543 |
Teak mixed moist deciduous forest |
| 26 |
Near Kiruwathi |
Yellapur |
534 |
Dry deciduous forest |
| 27 |
After Kiruwathi |
Yellapur |
524 |
Teak mixed moist deciduous forest |
| 28 |
S10 |
After Sangtikoppa |
Dharwad |
541 |
Teak mixed moist to dry deciduous forest |
| 29 |
Before Devikoppa |
Dharwad |
533 |
Teak mixed moist to dry deciduous forest |
| 30 |
After Devikoppa |
Dharwad |
530 |
Bamboo planted area |
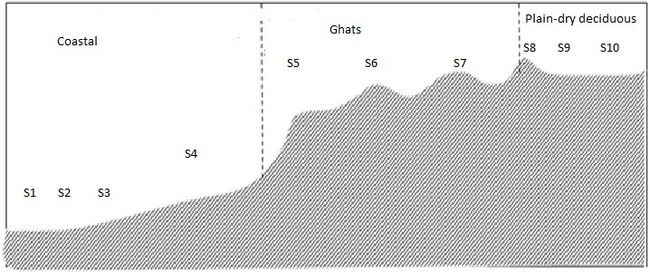
Fig. 2. Topographic features and vegetation associated with different sectors in the study region
The tree diversity in the sampling sites was studied using Point Centred Quarter sampling technique (Fig. 3) (James 2006). Each linear block of forested tract measured 13 km long area along the Ankola-Yellapur-Kalghatgi direction. Ten such linear blocks, totally covered 130 km long terrain from the coast, crossing the Ghats to the eastern plains (Fig. 1). In each of this 13 km long block, three transects of 500 m length each were laid, thereby covering a survey area of 1.5 km in each sector. In each transect of 500 m length 10 point centred quarter samples were studied keeping an interval of 50 m between any two points. In each sample, in each of the four quarters demarcated on the ground, the distance to the nearest tree (minimum GBH of 30 cm) from the central point was measured. Thus data was derived on four trees at each point and the distances to these four trees from the central point. The mean distance to the trees was estimated by dividing the total distances to four trees by four from the point. The GBH and the height of the trees were noted down. At every 3rd point, the shrub layer (including shrubs and tree saplings above 1 m height) of 5 x 5 m was studied. The method was used for its fastness in coverage of long stretches of forest vegetation of heterogeneous and fragmented vegetation on account of centuries of human impacts like slash and burn cultivation, pastoralism, clear felling of timber for raising monocultures of mainly teak and eucalyptus and Acacias in later times and routine extraction of biomass for agricultural and domestic needs. As the method has inherent quality of passing through all grades of forests in case of unbiased application along a longitudinal sampling course, a quick view on vegetation status, especially in terms of tree density and dominant species could be gained in limited time. The tree density was estimated by using the formula: Area/d2 and expressed in numbers per/ha; d is the average distance to the nearest trees in the four quarters of a cross from its central point, considering the average distances of all such points along any single transect. Other ecological parameters such as Evergreeness, Endemism, Diversity etc., were computed. The various plant species encountered along the transect line and its periphery were also recorded so as not to miss the overall diversity. Other details regarding landscape type, altitude, vegetation disturbances, NTFP collections, fire occurrence, streams etc., were also noted. The revenue lands with cultivation, homesteads and grazing areas were excluded from the forest survey.
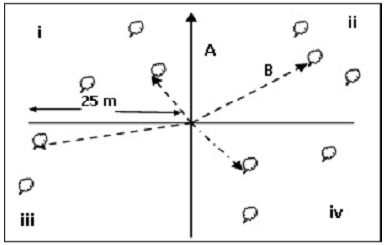
Fig. 3. Point centered Quadrat (Trees; i, ii, iii, iv- First, second, third and fourth quadrant; A-Direction of transect; B-distance of nearest trees from center of point centered quadrat)
|
