|
Agricultural Production in Karnataka
Let us start with some statistics regarding agricultural activities. Table 3 gives the distribution of land holdings in Karnataka for the year 1955-56 and the year 1980-81. The skewed distribution is very well known, we see that 30.8% of the land holders occupied 75.1% of the land in 1955-56. In 1980-81 19.6% of landholders occupied 58.7% of the land. Secondly, small land holders have increased from 11.64 lakhs to 25.46 lakhs (more than double) and from 47.3% to 59.1%. Similarly area has increased from 11.19 lakh ha (10.3%) to 22.76 lakh ha (19.4%) - nearly double. Hence improvements in agricultural practices should be directed towards this class. Further the average size of holding is decreasing from 4.4 ha in 1955-56 to 2.73 ha in 1980-81. The number of farmers to be reached is very large - 43.09 lakhs in 1980-81 and increasing; but fortunately we have a reasonably good agricultural extension service, a well operated agricultural marketing service and until now a well maintained credit service; so we have established mechanisms to reach these farmers effectively.
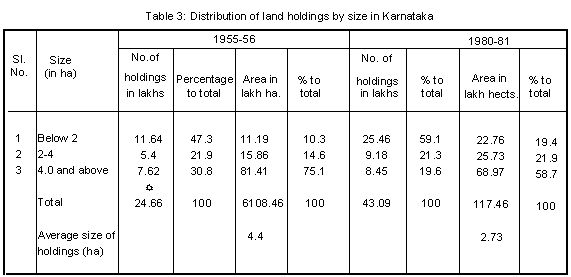
Table 4 gives the distribution of land holdings in various districts of Karnataka and the growth from 1970-71 to 1980-81. Belgaum, Bijapur, Dharwad, Tumkur and to some extent, Bangalore, Gulbarga, Raichur, Mandya dominate on the number of holdings. Bangalore has shown a decrease of about 16% in the percentage weightage, but the actual number has increased marginally. Similarly Kolar also has a marginal increase in the number of land holders. Bellary shows a large increase in the number of land holders. Districts like Gulbarga, Hassan, Mandya, and Mysore also show increases in the number of land holders.
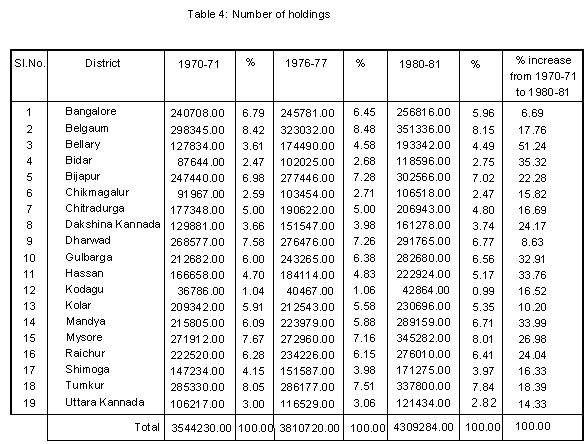
Table 5 contains area of operation in these districts. Dharwad shows a reduction in the area (about 8%). Except Bidar and Chitradurga, all other districts show an increase in the area of operation. Bijapur, Dharwad, Belgaum, Gulbarga and Raichur dominate in the area.
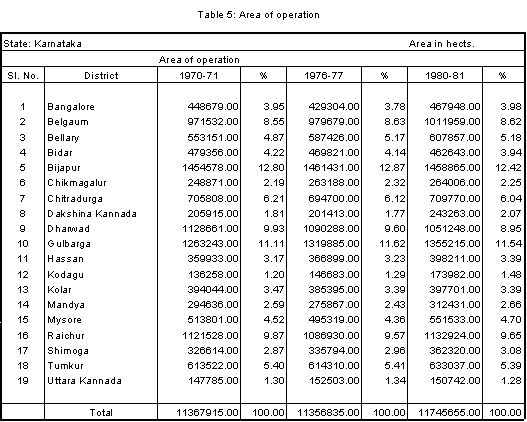
Table 6 provides the comparison between total area and net area sown for all districts for the year 1984-85. In districts like Bidar, Bijapur, Dharwad, Gulbarga, Raichur and Belgaum land use for agriculture is greater than 74% of the total area. Land use for agriculture is lower in the malnad districts of Uttara Kannada, Shimoga, Kodagu, Dakshina Kannada and Chikmagalur.

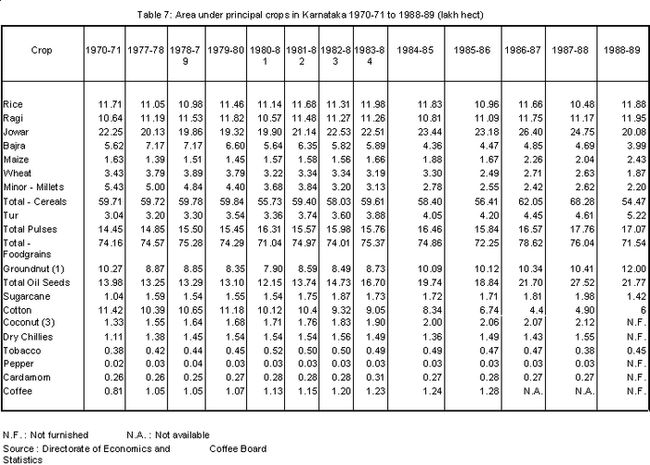
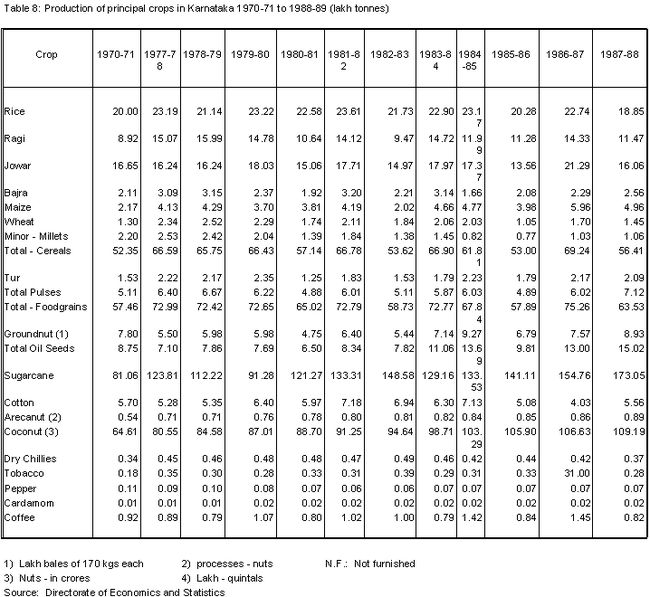
Table 7 gives us the area under different crops during the period 70-71 to 88-89. Total area under cereals varies from 59.71 lakh ha in 1970-71 to 54.47 lakh ha in 1988-89 reaching a peak of 68.28 lakh ha in 1987-88. Similarly the area under food grains also shows only marginal changes from - 74.16 lakh ha to 71.54 lakh ha. This means that whenever we create a large irrigation potential, we are not creating additional areas for cultivation (like conversion of fallow lands or C-D class lands). Area under Sugarcane has increased from 1.04 lakh ha to 1.42 lakh ha reaching a peak of 1.98 lakh ha in 87-88. The sufferer of the agricultural policies seems to be the minor millets - area has reduced from 5.43 lakh ha to 2.27 lakh ha - a steady decline. Area under Bajra has come down to 3.99 lakh ha from 5.62 lakh ha. Despite fears, area under ragi has gone up from 10.64 lakh ha in 1970-71 to 11.88 lakh ha in 1988-89; but it shows large variations in the last five years - 11.83 in 1984-85, 10.96 in 1985-86 (a reduction of 9%), 11.66 in 1986-87 (an increase), 10.48 in 1987-88 (a reduction of about 12%) and 11.88 in 1988-89. Area under oil seeds also shows an increase from 13.98 lakh ha to 21.77 lakh ha.
Let us now look at the crop production displayed in Table 8. The production of total cereals during the last ten years is stagnant. The production depends on rainfall - with wide fluctuations. Same trend is true for total food grains production also - there is a downward trend noticeable here. Sugarcane production during the ten years - 77/78 to 88/89 - has shown some improvements - it has reached a peak production of 173 lakh tons in 1987-88 from around 100 tons in 78-79. Coconut production has shown a significant increase - from around 80 lakh tons in 77-78 to 109 lakh tons in 87-88.
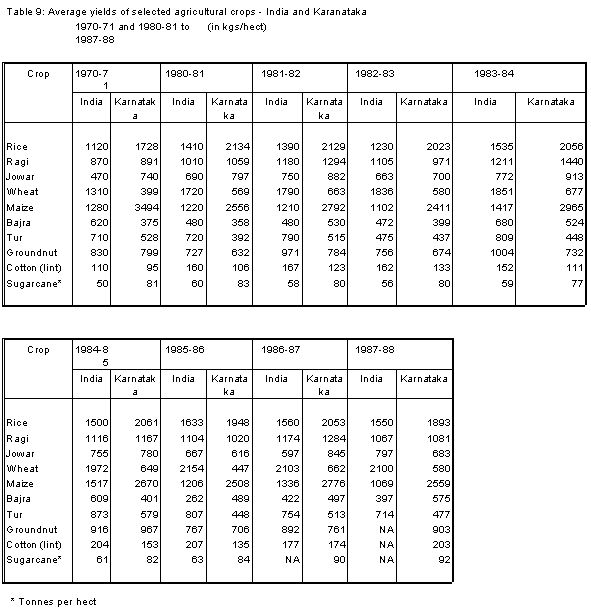
Production is not an indication of the efficiency. Yield values for several years for different crops are tabulated in Table 9. Yield figures for Karnataka and India are given in this table. Whereas, the average yield for rice in India has shown an increase from 1120 to 1550 kg/ha, the average yield for rice for Karnataka fluctuates - probably dependent on monsoon/rainfall. Karnataka has a better yield for maize, 2559 kg/ha compared to 1069 kg/ha. But on the whole, no significant improvements in yields are seen. This only confirms the figures presented in Tables 7 and 8.
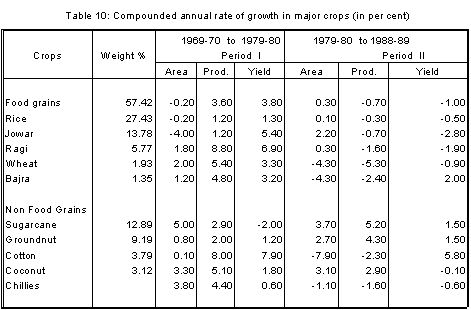
Another way of looking at food production is given in Table 10. We identify the decade 1969-70 to 1979-80 as one period (period I) and the decade 1979-80 to 1988-89 as another period (period II). We detail the percentage changes during these periods as shown in Table 10. There is an increase in the production in period I due to increase in yields. But the situation is poor in period II. There is a decline in yields and production. There was a wide fluctuation in rainfall during this period. The average per capita production of food grains declined from 184.5 kg in 1967-70 to 160.8 kg in 1986-89. CMIE (Centre for Monitoring Indian Economy) rates the overall performance of Karnataka's agriculture in the latest decade ending 1988-89 as poor.
|