|
Irrigation in Karnataka
Table 11 contains information pertaining to water availability in several river systems in Karnataka. It also reveals the current utilisation and proposed projects. Even though the average annual yield is around 97,352 M Cu M, most of it (56,600 M Cu M) comes from west flowing rivers. Hence the utilisable water potential is 45,300 M Cu M.
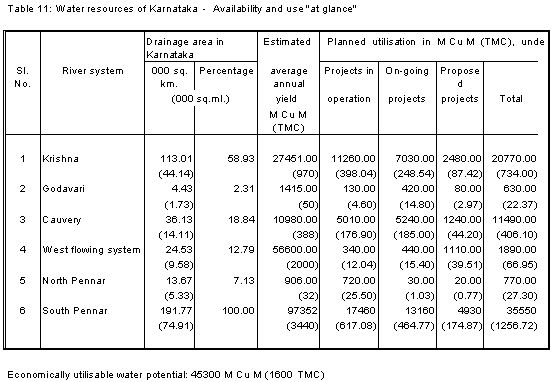
Table 12 illustrates the trend of increase in irrigated area in Karnataka. The net area sown has increased very marginally - an increase of 5.37% in about 29 years. The increase in area under multiple sowing has been quite high - from 3.33 lakh ha to 8.71 lakh ha (an increase of 161.56% in 29 years). Area irrigated has also gone up from 7.11 lakh ha to 15.9 lakh ha - an increase 123.63%. This compares well with the multiple sown area. We can see that the irrigated area under multiple sowings per year is only 4.8% of the total area under multiple sowing in 1955-56 and this has gone up to 40.64% in 1983-84. Hence it is obvious that most of the increases in area for multiple sowing is coming from irrigation.
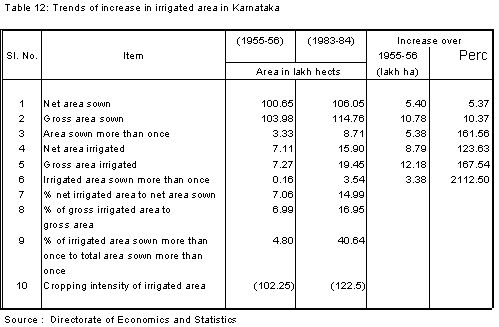
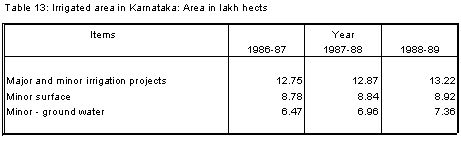
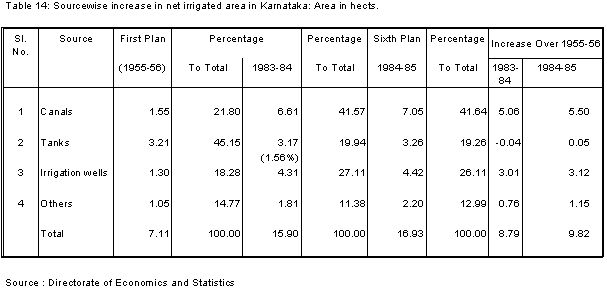
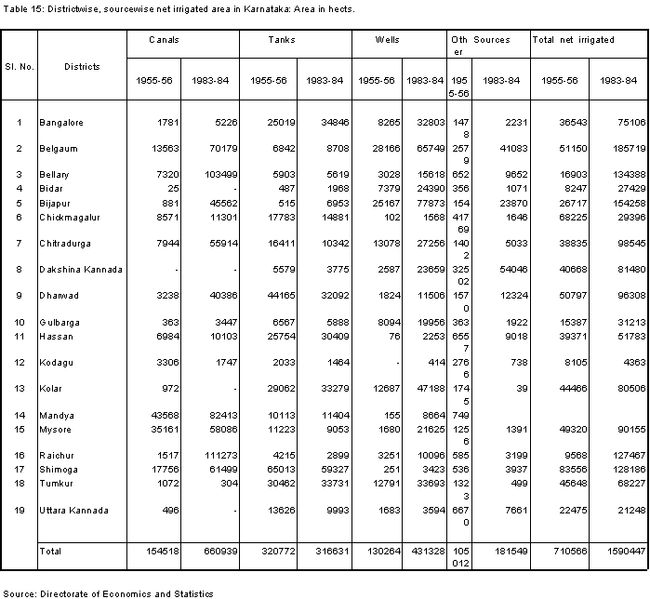
Table 13 gives a break up of irrigated area by different sources for the years 1986 to 1989. We see that still minor irrigation accounts for most of the irrigated area. Table 14 looks at the increase in irrigated area for different sources. We can see that 45.15% of area came under tank irrigation in the first plan period. But this share of tanks is reduced - to 19.26% in 1984-85. The distribution of area under each source for the districts is illustrated in Table 15. We can see that the number of tanks has decreased in the state marginally. It has however increased in some districts like Bangalore, Belgaum, Bidar, Hassan and Kolar. But ground water tapping is increasing by leaps and bounds.
Whereas the area under minor irrigation is substantial, the investment is low as in evidenced from Table 16. The past fifteen years show that a steady increase in the ratio of spending - favouring major projects - the ratio is around 1:4 to 1:6. Minor projects need more attention.
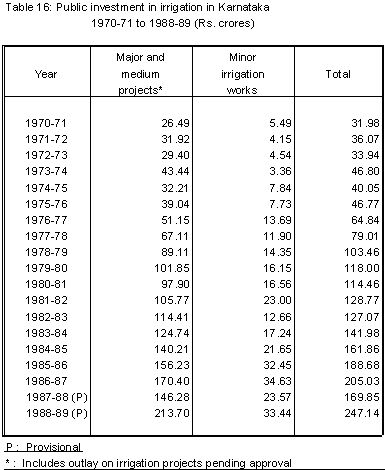
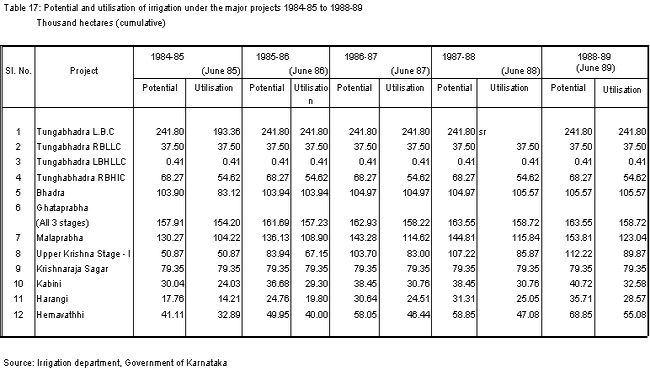
Table 17 illustrates the percentage utilisation of different distributions of major projects. We can see that we have reached the potential in most of them. Now there may be a decline due to salinity and not an increase. We need to look for new projects.
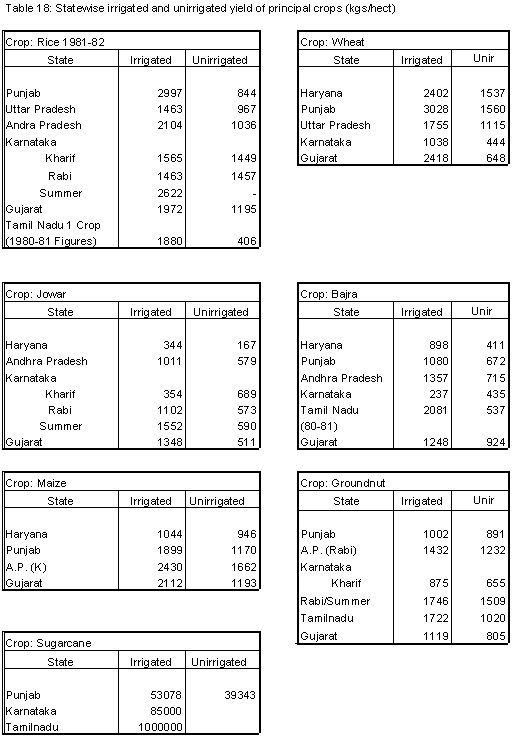
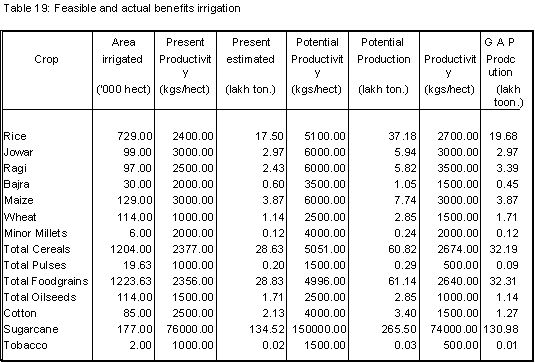
Another way of improving production of food crops is to increase the yield in irrigated areas. Table 18 gives a comparison of yields for some crops in Karnataka and some other states and Table 19 calculates the possible increase in production in irrigated areas. It shows a possibility of doubling production by improving the yields.
Another aspect of reaching a larger area being experimented now is the dryland development program. Table 20 contains the area under development. Table 21 summarises the data pertaining to area, production, yield of foodgrains, fertilizer use, irrigated area for 33 years from 1955-56. The same is depicted pictorially in figure 1, and for the period 1970-71 to 1988-89 in fig 2. Population in Karnataka is increasing at the rate of 7.85 lakhs per year (Fig. 1). The production of total food grains is stagnant for the last 15 years.


To see the effect of irrigation and fertilizer on production, trend analysis was done. Production follows an exponential function with respect to fertilizer consumption
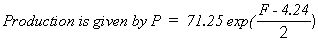
where F is the fertilizer consumption.
With respect to irrigation (I), it has an inverse relationship given by
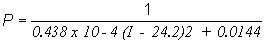
Since the coefficient is very small, we can assume that irrigated area has no influence on production. Another reason may be the diversion of irrigated land to cash crops cultivation. |