Land cover refers to the physical status of the Earth’ surface and relates to the type of features present on the surface of the Earth like forest, water body, soil, etc. Land use refers to the way in which land is being employed by humans for various purposes. It relates the functional utility of land to the economic activities. Land use/land cover pattern of a region is an outcome of the natural and socio-economic factors and their utilization by man in time and space. Demographic pressure has led to continuous exploitation of natural resources. There are only a few landforms left on the Earth that are in their natural state. Due to anthropogenic activities Earth surface is continuously being modified and the way land has been used has significant effect upon the natural environment thus resulting into an observable land use/land cover pattern over the time. Thus land use land cover change analysis has become a central component is current strategies for managing natural resources. Temporal data aids in a process of identifying differences in the state of an object or phenomenon by observing it at different times. It forms an important parameter in monitoring and managing natural resources as it provides quantitative assessment of the features of interest.
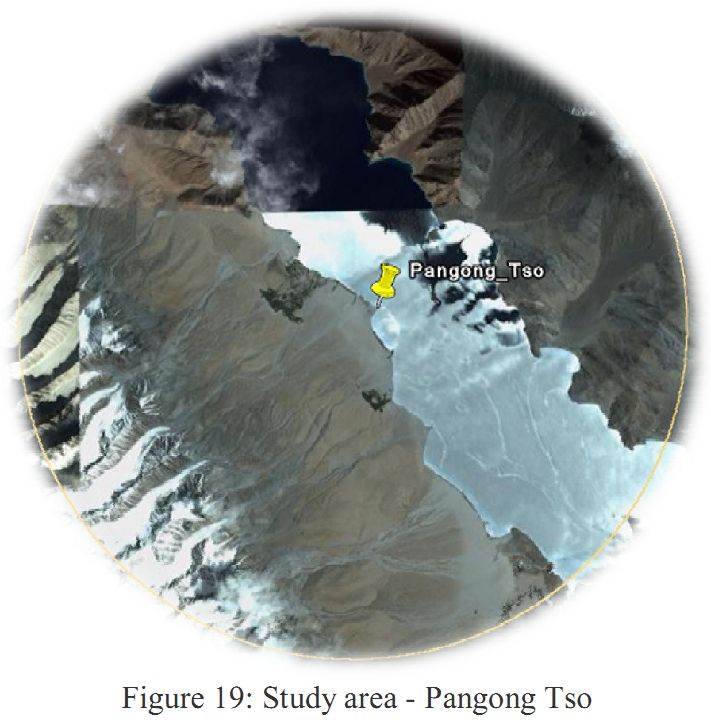
The spatial extent is about 31468 hectares, extended from north: 3751574.007 till south: 3731302.585 and east: 288642.589 till west: 268639.999 (Figure 19).
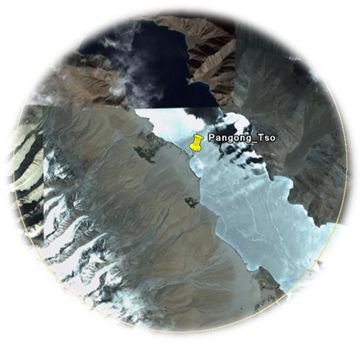
Figure 19: Study area - Pangong Tso
Data: Landsat TM of 1989, 2006, 2010 [downloaded from http://glcf.umiacs.umd.edu/data/]
Google Earth image (http://earth.google.com) served in pre and post classification process and validation of the results. Spatial and spectral details of the data used for land cover analysis is given in Table 3.
Table 3: Spatial and spectral details of the remote sensing data used for analysis
| Satellite |
Bands |
Spectral Range |
Spatial Res. |
Year |
| Landsat TM |
1
2
3
4
5
7 |
0.45 – 0.52
0.52 – 0.60
0.63 – 0.69
0.76 – 0.90
1.55 – 1.75
2.08 – 2.35 |
30
30
30
30
30
30 |
1989
2006
2010 |
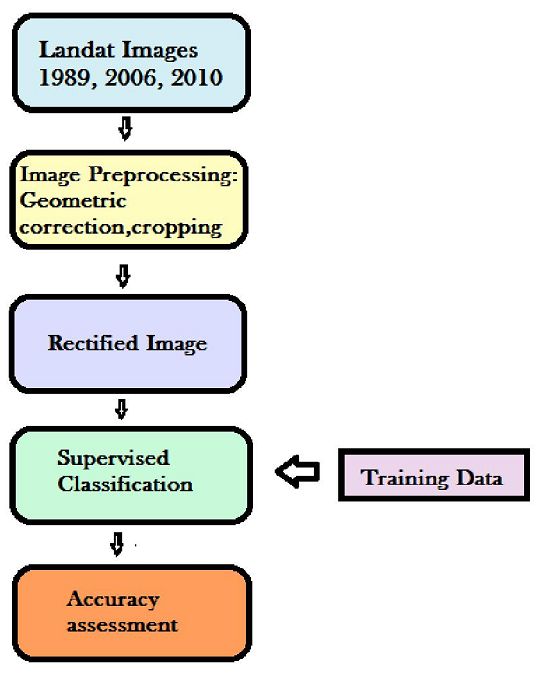
Methodology: Maximum Likelihood classifier (MLC), Which is based on the Gaussian algorithm was used to classify temporal RS data into 5 LC classes – Vegetation, Water, Snow, Open Sand area and Rocks. This is done using the signatures generated with the training data. MLC is a parametric classifier that can be used to train a huge number of datasets. This algorithm is Popular and widespread in RS because of its robustness (Hester et al., 2008). Due to absence of historical data, training pixels were collected from the false color composite of the respective bands (for the year 1989, 2006 and 2010). The data were processed using open source software for analyzing geographical resources called GRASS. The accuracy of the classified images on an average was 85 %. The Entire Procedure has been depicted in Figure 20.
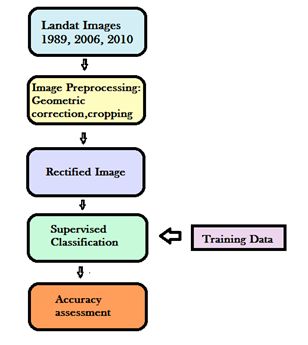
Figure 20: Remote sensing data analysis schematic diagram
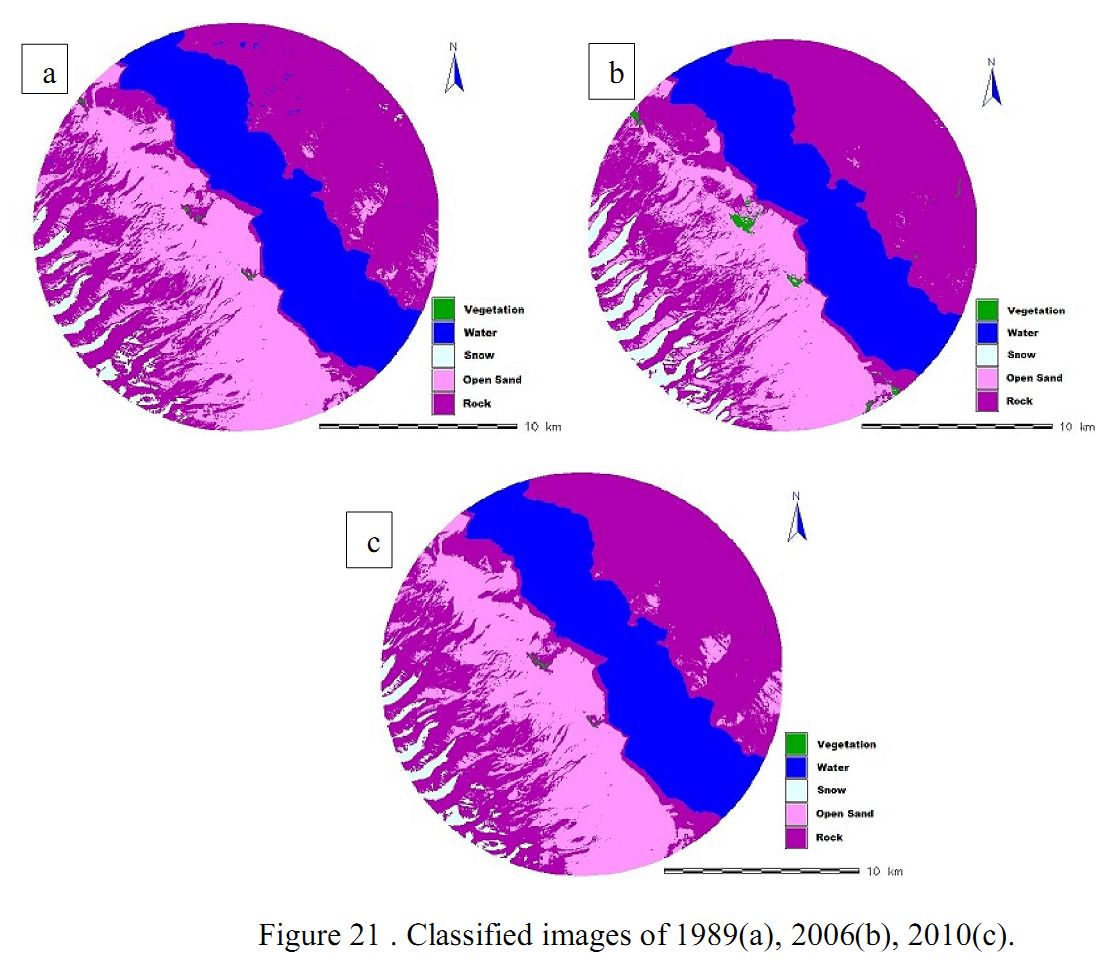
Figure 21 shows the classified image of 1989, 2006, 2010 obtained with five land use categories (Vegetation, Water, Snow, Open Sand area and Rocks). Table 4 gives the details of the classified images. The analysis shows that only 0.08% is under vegetation, 23% under water and the balance
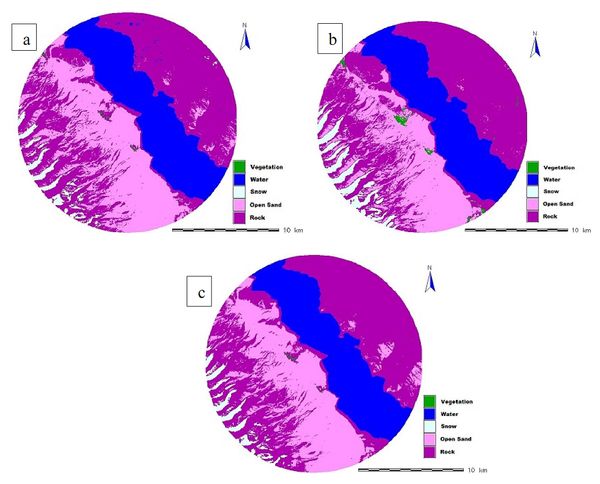
Figure 21 . Classified images of 1989(a), 2006(b), 2010(c).
Table 4: Land use statistics of study area – Pangong Tso.
| Year Class |
Vegetation |
Water |
Snow |
Open Sand area |
Rocks |
| 1989 |
Ha |
27.788 |
7420.190 |
877.883 |
9207.611 |
13,935.069 |
| % |
0.09 |
23.58 |
2.79 |
29.26 |
44.28 |
| 2006 |
Ha |
170.235 |
7446.269 |
1427.077 |
7962.190 |
14,462.770 |
| % |
0.54 |
23.66 |
4.53 |
25.30 |
45.96 |
| 2010 |
Ha |
26.619 |
7403.284 |
894.430 |
8735.216 |
14,408.993 |
| % |
0.08 |
23.53 |
2.84 |
27.76 |
45.79 |