|
METHOD
The approach includes (i) designing WSDSS, (ii) evaluation through MCDA.
System Design
Figure 1 outlines the architecture of WSDSS design with open source. The configuration of CentOS operating system with the associated software such as Geoserver, Apache Tomcat 8, Postgresql and Postgis. Apache Tomcat 8 web server enabled to connect and communicate, Postgresql and Postgis was used for spatial database management with PgAdmin interface. Postgresql is an object-relational database management system (ORDBMS) server to store securely spatial data, while allowing retrieval at the request of other software applications. It can handle workloads ranging from small single-machine applications to large Internet-facing applications with many concurrent users. The integration of information reference is done through GeoServer with Open Geospatial Consortium (OGC) standards. GeoServer is an open source server allows users to share, process and edit geospatial data, supports interoperability using open standards. GeoServer connects existing information to web-based maps such as OpenLayers, Google Maps and Bing Maps for effective layer visualization. GeoServer reads a variety of data formats: PostGIS, Oracle Spatial, ArcSDE, DB2, MySQL, Shapefiles, GeoTIFF, GTOPO30, ECW, MrSID, JPEG2000. It produces KML, GML, Shapefile, GeoRSS, PDF, GeoJSON, JPEG, GIF, SVG, PNG and more. GeoServer functions as the reference implementation of the Open Geospatial Consortium Web Feature Service standard (WFS), Web Map Service (WMS), Web Coverage Service (WCS) and Catalog Service Web (CSW). WFS Standard provides an interface allowing requests for geographical features across the web using platform-independent calls. WFS allows querying and retrieval of features. WMS is a standard protocol for serving (over the Internet) georeferenced map images which a map server generates using data from a GIS database. WCS Interface Standard defines Web-based retrieval of coverages – i.e., digital geospatial information representing space/time-varying phenomena. CSW is a standard for exposing a catalogue of geospatial records in XML on the Internet (over HTTP). The catalogue is made up of records that describe geospatial data (e.g. KML), geospatial services (e.g. WMS), and related resources. The Styled Layer Descriptor (SLD) is an XML-based mark-up language using for styling both vector and raster data. Quantum GIS (QGIS) is used for SLD creation.
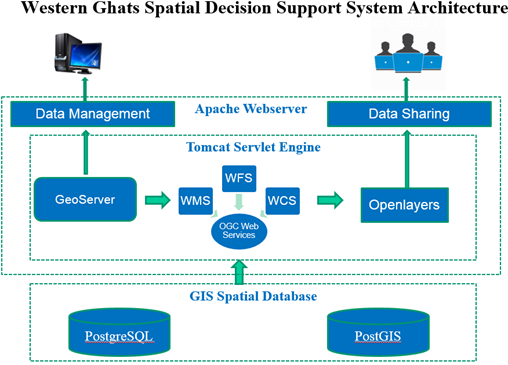
Fig. 1: The architecture for WSDSS.
Spatial MCDA for prioritization
The spatial MCDA process has been applied to prioritize ecological sensitive regions (ESR) by (1) identification and visualization of individual variables; (2) exploratory development of aggregation and weighting of criteria; and (3) selection and decision. Fig. 2 illustrates how each stage of the process can be supported with maps. Map use can be threefold: (1) to communicate spatial information to stakeholders; (2) as analysis tools for spatial evaluation of decision alternatives; and (3) as input for interactive tools for decision support. Map based visualization tools with effective user-friendly interfaces allows to evaluate each criteria and considering biological (terrestrial and aquatic flora and fauna, estuarine biodiversity), ecological (diversity, endemism, conservation reserve), geo-climatic (altitude, slope, rainfall), renewable energy prospects (bio, solar, wind), social (population, forest dwelling communities) (Table 1) [16]. The study area is divided in to 5’ × 5’ equal area grids (168) covering approximately 9 × 9 km2 (Figure 3) for prioritizing ESR. The weightages were assigned iteratively across the landscape with varied themes for a development solution and monitoring. The data has been collected from various studies under the specified themes [17, 18, 19, 20, 21, 22, 23, 24, 25, 26]. The criteria were ranked based on Eq. (1) variables generate real time output to support negotiated spatial decisions. Assigning weightages based on the relative significance of themes [27] for prioritizing eco-sensitive regions provides a transparent mechanism for combining multiple data sets together to infer the significance. The weightage is given by,
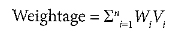 ----------1 ----------1
Where n is the number of data sets (variables), Vi is the value associated with criterion i, and Wi is the weight associated to that criterion, ranked between 1 and 10. Value 10 corresponds to highest priority for conservation whereas 7, 5 and 3 corresponds to high, moderate and low levels of prioritization. Assigning weightages based on individual proxy based extensively on GIS techniques, has proved to be the most effective for prioritizing ESR. These decision weightages dynamically explore the spatial outcomes of planning alternatives and to quantify real-time changes in terms of indicators of relative suitability. A very important phase of spatial MCDA consists in the aggregation of the scores related to the different criterion maps useful for the decision [28]. The combined metric score of aggregation operation is a generalization of the Boolean overlay operations and the Weighted Linear Combination (WLC) method used as a technique for ranking criteria and addressing the uncertainty from their interaction.
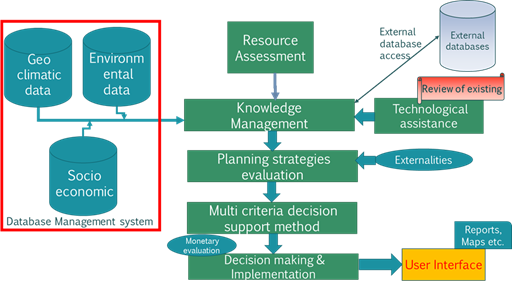
Fig. 2: Flow of WSDSS.
Table 1: The various themes considered and their weightages
SNO |
Themes |
Ranking |
Theme |
1 |
3 |
5 |
7 |
10 |
1. |
Land use |
FC<20% |
20<FC<40% |
40<FC<60% |
60<FC <80% |
FC > 80% |
LAND |
Interior forest |
IF<20% |
20<IF<40% |
40<IF<60% |
60<IF<80% |
IF> 80% |
2 |
Flora |
NEND |
END<30% |
30<END<50% |
50<END<70% |
END>70% |
ECOLOGY |
Fauna |
- |
NEND |
- |
- |
END |
Conservation reserves (CR) |
- |
- |
- |
- |
National parks, Wild life reserves, Myristica swamps, Sanctuaries |
Biomass (Gg) |
BM<250 |
250<BM<500 |
500<BM<750 |
750<BM<1000 |
BM>1000 |
3 |
Slope |
- |
- |
- |
Slope > 20% |
Slope > 30% |
GEO-CLIMATIC |
Precipitation |
- |
1000>RF> 2000 mm |
2000>RF> 3000 mm |
3000>RF> 2000 mm |
RF> 4000 mm |
4 |
Stream flow |
WA<4 |
4<WA<6 |
6<WA<9 |
9<WA<12 |
WA=12 |
HYDROLOGY |
5 |
Solar |
- |
- |
<5 KWh/m2/day |
5-6 KWh/m2/day |
6-6.5 KWh/m2/day |
ENERGY |
Wind |
- |
- |
2.4 to 2.55 m/s |
2.5 to 2.6 m/s |
2.6 to 2.7 m/s |
Bio |
SD<1 |
SD>1 |
1>SD<2 |
2<SD<3 |
SD>3 |
6 |
Population density (PD) |
PD>200 |
100<PD<200 |
100<PD<150 |
50<PD<100 |
PD<50 |
SOCIAL |
Forest dwelling communities (Tribes) |
- |
Tribes are present then assigned 10; if no tribal population exists, then assigned as 0 |
7 |
Estuarine regions |
- |
low |
moderate |
high |
very high |
ESTUARINE DIVERSITY |
FC-forest cover; IF-interior forest cover; END-endemic; NEND-non-endemic; BM-biomass; SD-supply to demand ratio; WA-Water availability
|