Results and Discussion
3.1 Characteristics of the Adsorbent
The carbon, hydrogen and nitrogen percentage of the coffee husk were 45.33, 6.21 and 0.63 respectively. A relatively larger percentage of hydrogen in comparison to nitrogen compounds indicates that carbon-hydrogen groups might be available for adsorption of metals. The relatively low percentage of nitrogen shows that very less percentage of protein might be present in the husks. This is advantageous over protein rich adsorbents since proteinious materials are likely to putrefy under moist conditions.
3.2 Effect of agitation time and initial Cr(VI) concentration on Cr(VI) Adsorption
The effect of agitation time for various initial concentrations was studied (Fig. 1). The percentage adsorption of Cr (VI) increased with an increase in agitation time and the equilibrium time varied for different Cr (VI) concentrations. The time required to attain equilibrium for 10 and 20 mg/l Cr (VI) concentration was 120 minutes and 50 and 100 mg/l Cr (VI) attained equilibrium at 180 minutes. The maximum percentage adsorption was 99%, 98%, 96% and 75% respectively for initial Cr (VI) concentrations of 10, 20, 50 and 100 mg/l.
Fig. 1. Effect of agitation time and initial Cr (VI) concentration (♦,10 mg/l; ■, 20 ppm; •, 50 mg/l; ▲,100 mg/l) on Cr (VI) removal. Adsorbent dose: 1g/100ml; pH 2.0.

3.3 Effect of Adsorbent dose on Adsorption
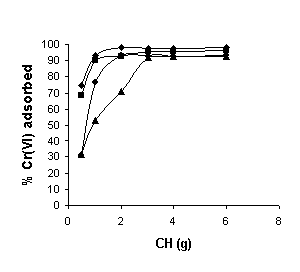
The percentage adsorption of Cr (VI) was studied by increasing adsorbent dose from 50 mg to 6 g for 100 ml of Cr (VI) concentration of 10, 20, 50 and 100 mg/l (Fig. 2). The results indicated that the percentage of Cr (VI) adsorbed increased with an increase in adsorbent dosage for all Cr (VI) concentrations. The increase in percentage adsorption with increase in adsorbent dosage is due to the increase in the number of adsorption sites (Sharma and Forster, 1993; Selvaraj et al., 1997).
Fig. 2. Effect of adsorbent dose on Cr (VI) adsorption at various Cr (VI) concentrations (♦,10 mg/l; ■, 20 ppm; •, 50 mg/l; ▲, 100 mg/l ). Agitation time: 180 minutes; initial pH: 2.0.

3.4 Effect of pH
The pH of the solution is an important factor that controls the uptake of Cr (VI). The experimental results revealed that the percentage adsorption increased as the pH was lowered and reached 99%, 98% and 96% respectively for 10, 20 and 50 mg/l Cr(VI) concentrations. When the pH was increased above 2, the percent removal decreased (Fig. 3). Similar results were obtained by Donmez and Aksu, 2002; Dakiky et al., 2002; Selvaraj et al., 2003; Yu et al., 2003; Ucun et al., 2002; Hu et al., 2003; Gupta et al., 2001. The high adsorption of Cr (VI) can be explained by the species of chromium and the adsorbent surface. At acidic pH, the predominant species of Cr (VI) are Cr2O72-, HCrO4- and CrO42-. Under acidic conditions, the surface of the adsorbent becomes protonated and attracts anionic species of Cr (VI). As the pH is increased above the zeta potential of the adsorbent, there is a reduction in the electrostatic attraction between the Cr (VI) species and the adsorbent surface, with a consequent decrease in percentage adsorption.
3.5 Adsorption isotherms
Langmuir isotherm was applied to the present study to estimate the adsorption capacity of coffee husk. Langmuir isotherm is valid for monolayer adsorption onto a surface containing a finite number of identical sites (Langmuir, 1918).
The linear plots of Ceq/ q vs Ceq for Cr (VI) show that adsorption follows the Langmuir adsorption model (Fig. 4). qmax and b were determined from the slope and the intercept of the plot to be 44.95 mg/g and 0.01 l/mg respectively.
Fig. 3. Effect of pH on Cr (VI) adsorption at different initial Cr (VI) concentrations (♦, 10 mg/l; ■ 20 ppm; •, 50 mg/l; ▲, 100 mg/l ).

Fig. 4. Langmuir plot for Cr (VI) adsorption. Agitation time: 180 minutes, initial pH: 2.0.

The Freundlich adsorption isotherm (Freundlich, 1907) was also applied for the adsorption of Cr (VI) onto coffee husk. Linear plots of ln Ceq vs ln q show that the adsorption of metal ions onto the coffee husk follows the Freundlich isotherm model (Fig. 5). Freundlich constants Kf and n were found to be 1.02 mg/g and 1.49 respectively. It has been shown by McKay et al (1982) that n values between 1 and 10 indicate beneficial adsorption.
Fig. 5. Freundlich plot for Cr (VI) adsorption. Initial pH:2.0, agitation time: 180 minutes.

The adsorption data obeyed both Freundlich and Langmuir models exhibiting heterogenous surface conditions and monolayer adsorption (Lee et al., 1995). The favourable nature of adsorption can be expressed in terms of a dimensionless parameter RL that is given by the equation
RL = 1/(+bCo)
Where b is the Langmuir constant and Co is the initial concentration of Cr (VI). All RL values obtained using Eq. (4) for Cr (VI) adsorption are greater than zero and less than unity showing favourable adsorption of Cr (VI) onto coffee husk.
3.6 Comparison with other Adsorbents
The comparison of adsorbent capacity of coffee husk with other materials reported in literature is given in Table 1. The sorption capacity of coffee husk is higher than adsorbents from various industrial and low cost adsorbents.
Table 1 : Comparison of adsorption capacity of Cr(VI) with other adsorbents
Biosorbent |
Cr (VI) mg/g |
Reference |
| Distillery sludge |
5.7 |
Selvaraj et al., 2003. |
| Exhausted coffee |
1.42 |
Orhan and Büyügüngör, 1993 |
| Nut shell |
1.47 |
Orhan and Büyügüngör, 1993 |
| Sawdust |
10.1, 16.05, 4.44 |
Bryant et al., 1992; Dikshit, 1989; Zarraa, 1995 |
| Walnut shell |
1.5 |
Orhan and Büyügüngör, 1993 |
| Waste tea |
1.63 |
Orhan and Büyügüngör, 1993 |
| Irish sphagnum moss peat |
119.0, 43.9 |
Sharma and Forster 1993, 1995 |
| Iron (III) hydroxide |
0.47 |
Namasivayam and Rangnathan, 1993 |
| Blast furnace slag |
7.5 |
Srivastava et al., 1997 |
| Activated red mud |
1.6 |
Pradhan et al., 1999 |
| Rice husk carbon |
45.6 |
Srinivasan et al., 1988 |
| Waste tyre |
58.48 |
Hamadi et al., 2001 |
| Olive cake |
33.44 |
Dakiky et al., 2002 |
| Pine needles |
21.50 |
Dakiky et al., 2002 |
| Wool |
41.15 |
Dakiky et al., 2002 |
| Coffee husk |
44.95 |
This study |
3.7 Infrared spectral analysis
The FTIR spectral analysis shows that several functional groups are available on the surface of coffee husk for binding Cr (VI) ions (Table 2).
Table 2 : Wavelengths corresponding to their respective functional groups
Wavelength (cm-1) |
Functional Group |
| 3431 |
-OH |
| 2925 |
-CH |
| 1726 |
C=O |
| 1652 |
C=C |
| 1430 |
-COO |
3.8 Desorption studies
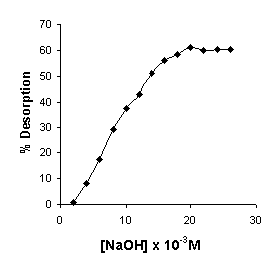
Adsorption process can either be physisorption (physical bonding) or chemisorption (chemical bonding) or combination of both. If the adsorption is by physical bonding then the loosely bound metal ion can be easily desorbed with distilled water in most of the cases. However, if the mode of sorption is by chemical bonding or ion exchange or combination of both, then desorption can be effected by stronger desorbents like acid or alkali solutions. Distilled water (pH 6.9) was used to desorb Cr (VI) from Cr(VI) loaded coffee husk. The results revealed that the Cr (VI) was not removed from metal laden biomass. Hence the experiments were conducted with acid and alkali solutions. The Cr (VI) ions were desorbed with alkali solutions (NaOH) and not with acid solutions. Fig. 6 shows that about 60% of Cr (VI) was desorbed using 0.02 M NaOH. From the desorption experimental results it can be concluded that the mode of biosorption of Cr (VI) on coffee husk was chemisorption. The results of alkali desorption of metal suggests either chemisorption or ion exchange as the possible mechanism of binding between Cr (VI) and coffee husk. At higher pH, hydroxyl ions may release chromium ions from the adsorbent following an ion exchange mechanism.
Fig. 6. Effect of NaOH concentration on desorption of Cr(VI).

|


