 |
Prediction of Spatial Patterns of Urban Dynamics in Pune, India
Bharath. H. Aithal1,2, Vinay S1, Venugopal Rao K.3, T.V. Ramachandra*1,2,4 |
 |
1Energy & Wetlands Research Group, Center for Ecological Sciences [CES],
2Centre for Sustainable Technologies (astra)
Bangalore, Karnataka, 560 012, India*Corresponding Author E Mail: cestvr@ces.iisc.ac.in.
*Corresponding Author: T.V. Ramachandra, cestvr@ces.iisc.ac.in
3National Remote Sensing Centre, Department of Space, Government of India, Hyderabad, http://nrsc.gov.in.
Results
Results
Land Use Analysis:figure 2 and table 3 depicts the land use dynamics from 1992 till 2013, accuracy over 80% and kappa over 0.75 (table 4) indicated good relation with the classified satellite information and the true information. Land use classification showed that the built up area has increased from 7.64% (in 1992) to 29.73% (2013) at the cost of other land uses, while the water bodies remained constant.
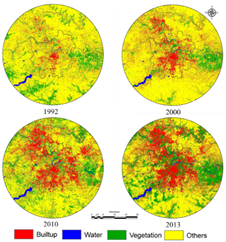
Figure 2: Land use analysed for study region
Model Calibration and Simulation:
The model was designed in order to simulate the land use for the year 2013 based on the knowledge of historical data such as 1992 to 2010. Different factors that either restrict or support urbanization were normalized using binary (constraints) or fuzzy logic (supporting factors), where in the distance up to which the effect of each factor would take place was considered. Weightages were calculated in order to prioritize the normalised factors of growth using the analytical hierarchical process, these weights plays a crucial role in calibrating the model for higher accuracy and precision. For each of the land use, using various constraints and factors of growth, site suitability maps (Fig 3a, Fig 3b) were developed based on multi criteria evaluation process for the year 2010 and 2013 which were used further in simulation and prediction of land use respectively, of all the factors roads, industries, bus and railway stations and educational institutes had higher impact on the process of simulating the land use dynamics. It can be observed that the effect of CDP has higher impact towards the core of the city, restricting the growth of urbanization, but promoting towards the peripheries, whereas in the absence of CDP, the core is more susceptible to the increasing urbanization, where as in the absence of CPD, the core allows built-up growth to a higher extent at the cost of protected features such as drainages, defense establishments, parks, etc. Vegetation has higher tendency to sustain where the slopes are high and away from the factors those support the expansion of built up areas. Based on the ancillary data of the year 2000 and 2010, Markov assessment was carried out in order to quantify the probable land use change at 2013. Markov probability, along with the probable transition areas (site suitability maps) were used in order to simulate for the year 2013. The simulated results are as presented in fig 4 and table 4, both of the calibrated models had accuracy over 83% and agreement of over 0.8 which indicate that the model could further be used for predicting the land use.
Land Use |
1992 [%] |
2000 [%] |
Built-up |
7.64 |
14.83 |
Water |
1.28 |
0.86 |
Vegetation |
13.78 |
8.85 |
Others |
77.29 |
75.46 |
Land Use |
2010 [%] |
2013 [%] |
Built-up |
24.27 |
29.73 |
Water |
1.42 |
1.75 |
Vegetation |
23.85 |
16.67 |
Others |
50.46 |
51.85 |
Table 2: Land use analysed
1992 |
2000 |
2010 |
2013 |
||||
OA |
κ |
OA |
κ |
OA |
κ |
OA |
κ |
91.2 |
0.9 |
93.1 |
0.9 |
94.4 |
0.92 |
94.6 |
0.91 |
Table 3: Accuracy assessment and kappa
Prediction of future land use
In order to predict the land use dynamics in the future, two different scenarios were adopted i.e., considering effect of presence and absence CDP. In order to predict the land use, Markov chains were run across equal time intervals i.e., using 2010 and 2013, predicting 2016; using 2013 and predicted 2016, predicting 2019 and so on up to 2025. Fig 5, Fig 6 and table 5 depicts the probable land use. It could be attributed to the implementation of the CDP that, the land use being converted from other land use classes to built-up is high across the peripheries since the restriction on using defence, recreation, and 30 m buffer across drain lines at the core. In case if CDP is not implemented, the restrictions holds only on existing built-up area, water bodies and slope only, the defence, recreation areas, drainages would be outgrown by the urbanization process, hence the core getting clumpy and saturated, rather than peripheries.
|
Fig 3: example of site suitability maps |

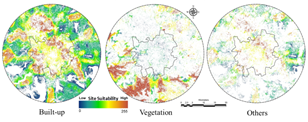

Fig 4: Simulated Land use year 2013
Land Use |
[%] |
Built-up |
28.07 |
Water |
1.29 |
Vegetation |
29.40 |
Others |
41.24 |
Accuracy |
82.2 % |
Kappa Location |
0.8159 |
Kappa Standard |
0.7354 |
Table 4: Simulated Land use 2013

Fig 5: Simulated land use with CDP
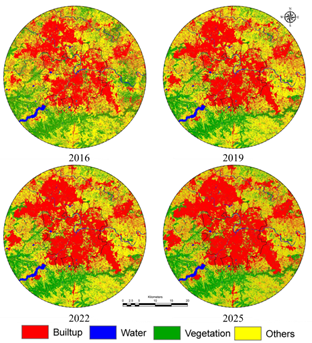
Fig 6: Simulated land use without CDP
Year |
Land Use |
with CDP % Area |
no CDP % Area |
2016 |
Built up |
37.78 |
33.48 |
Water |
1.75 |
1.75 |
|
Vegetation |
16.37 |
22.21 |
|
Others |
44.11 |
42.56 |
|
2019 |
Built up |
41.64 |
36.47 |
Water |
1.75 |
1.75 |
|
Vegetation |
20.16 |
18.44 |
|
Others |
36.45 |
43.35 |
|
2022 |
Built up |
47.89 |
38.86 |
Water |
1.75 |
1.75 |
|
Vegetation |
20.16 |
18.41 |
|
Others |
30.20 |
40.98 |
|
2025 |
Built up |
50.02 |
41.12 |
Water |
1.75 |
1.75 |
|
Vegetation |
20.16 |
18.40 |
|
Others |
28.06 |
38.73 |
Table 5: Predicted land use
| * Corresponding Author : | |||
| Dr. T.V. Ramachandra Energy & Wetlands Research Group, Centre for Ecological Sciences, Indian Institute of Science, Bangalore – 560 012, INDIA. |
Tel : 91-80-23600985 / 22932506 / 22933099, Fax : 91-80-23601428 / 23600085 / 23600683 [CES-TVR] E-mail : cestvr@ces.iisc.ac.in, energy@ces.iisc.ac.in, Web : http://wgbis.ces.iisc.ac.in/energy |
||