Results and Discussion |
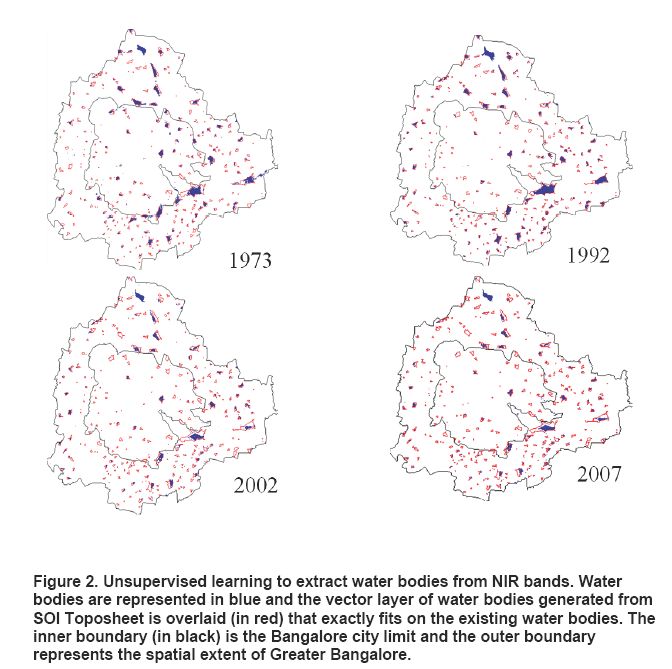
In unsupervised learning, where no previous estimation parameters were available, quite motivating and realistic results were obtained in exracting water bodies and their extent using IR bands of RS data. The corresponding number of wetlands and their areas were computed and are listed in Table 1. Figure 2 provides the distribution of wetlands in 1973, 1992, 2002, and 2007 based on the respective years RS data. The analysis revealed that there were 51 wetlands (321 ha) in 1973, 38 (207 ha) in 1992, 25 (135 ha) in 2002 and the number of wetlands dropped down to 17 with an extent of 87 ha in 2007 in the Bangalore city limits.
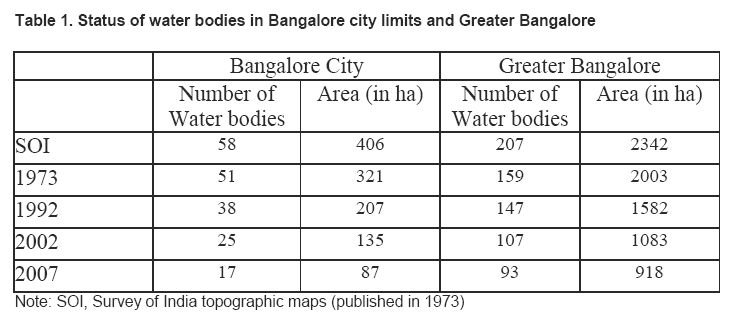
There were 159 water bodies spread in an area of 2003 ha in 1973, that number declined to 147 (1582 ha) in 1992, which further declined to 107 (1083 ha) in 2002, and finally there are only 93 water bodies (both small and medium size) with an area of 918 ha in the Greater Bangalore region in 2007. Water bodies in the northern part of greater Bangalore are in a considerably poor state compared to the wetlands in southern greater Bangalore. Validation of the classified data was done through field visits during July 2007, which indicate an accuracy of 91%. The error of omission was mainly due to the cover of water hyacinth (aquatic macrophytes) in water bodies due to which the energy was reflected in IR bands rather than getting absorbed. Fifty-four water bodies were sampled through field visits while the remaining water bodies were verified using online Google Earth (http://earth.google.com).
Temporal analyses indicate the decline of 34.48% during 1973 to 1992, 56.90% during 1973-2002 and 70.69% during 1973-2007 in the erstwhile Bangalore city limits. Similar analyses done for Greater Bangalore (i.e. Bangalore city with surrounding 8 municipalities) indicate the decline of 32.47% during 1973 to 1992, 53.76% during 1973-2002 and 60.83% during 1973-2007. This is correlated with the increase in built-up area from the concentrated growth model focusing on Bangalore, adopted by the state machinery, affecting severely open spaces and in particular water bodies. Some of the lakes have been restored by the city corporation and the concerned authorities in recent times. These lakes have a well defined boundary, clean water and are maintained by the neighborhood people. These lakes are used for recreational purposes. They are home to migratory birds and also add aesthetic beauty to the surroundings.
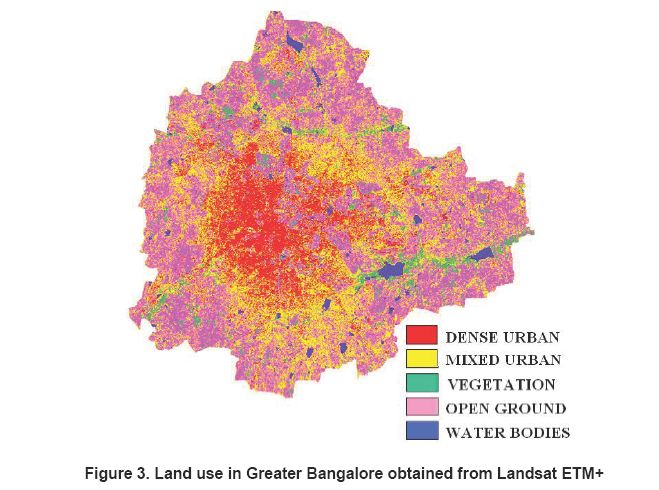
Disappearance of water bodies and a sharp decline in the number of water bodies in Bangalore is mainly due to intense urbanization and urban sprawl. Many lakes were encroached for illegal buildings (54%). Field surveys (during July-August 2007) show that nearly 66% of lakes are sewage fed, 14% surrounded by slums and 72% showed loss of catchment area. Also, lake catchments were used as dumping yards for either municipal solid waste or building debris. The areas surrounding these lakes have illegal constructions of buildings and most of the time slum dwellers occupy the adjoining areas. At many sites, water is used for washing and household activities and even fishing was observed at one of these sites. Multi-storied buildings have come up on some lake beds that have totally intervened with the natural catchment flow leading to a sharp decline in the catchment yield and also a deteriorating quality of water bodies. Figure 3 gives the land use categories in Greater Bangalore obtained by classifying Landsat ETM+ data. This highlights the intense urbanization process in the core city.
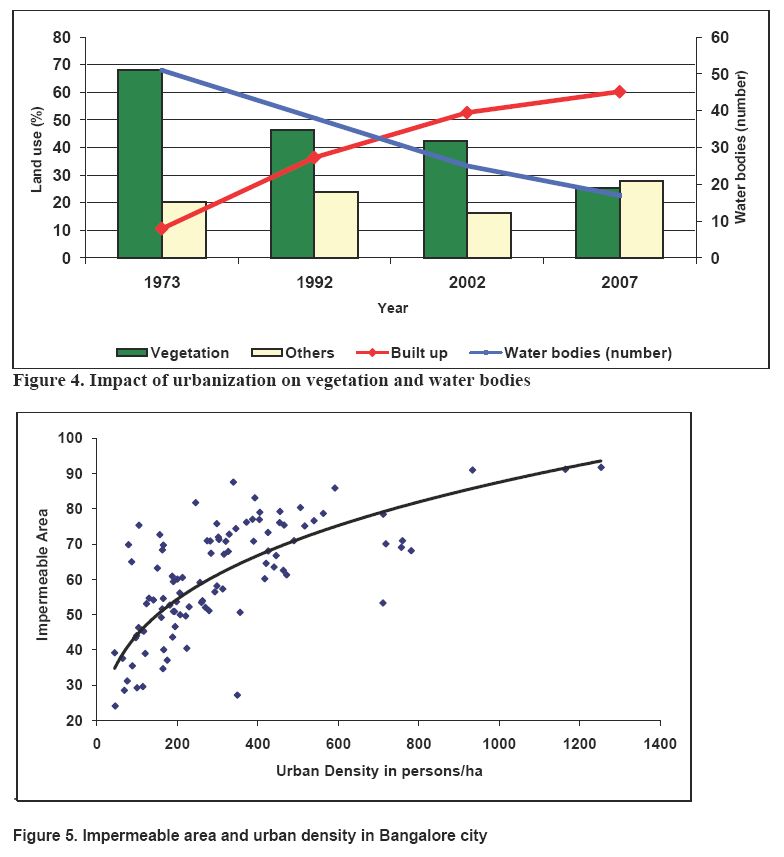
Temporal analysis of land use show that there has been a 466% increase in built-up area from 1973 to 2007 leading to a sharp decline in water bodies (60.83%) in Greater Bangalore. Figure 4 illustrates the rate of increase in built-up areas from 1973 to 2007 and its implication on the decline of vegetation and water bodies. Vegetation has decreased by 32% from 1973 to 1992, by 38% from 1992 to 2002 and by 63% from 2002 to 2007. Figure 5 shows the relation found between impermeable areas to urban population density, indicating the increase in population with the increase in paved surface in the region. Unplanned urbanization has many potentially detrimental effects including the loss of valuable agricultural and eco-sensitive (e.g. wetlands, forests) lands, enhanced energy consumption and greenhouse gas emissions from increasing private vehicle use.
Urbanization and the consequent loss of lakes has led to decreases in catchment yield, water storage capacity, wetland area, number of migratory birds, flora and fauna diversity and ground water table. Studies in selected lake catchments in Bangalore reveal the decrease in depth of the ground water table from 10-12m to 100-200m in 20 years due to the disappearance of wetlands.
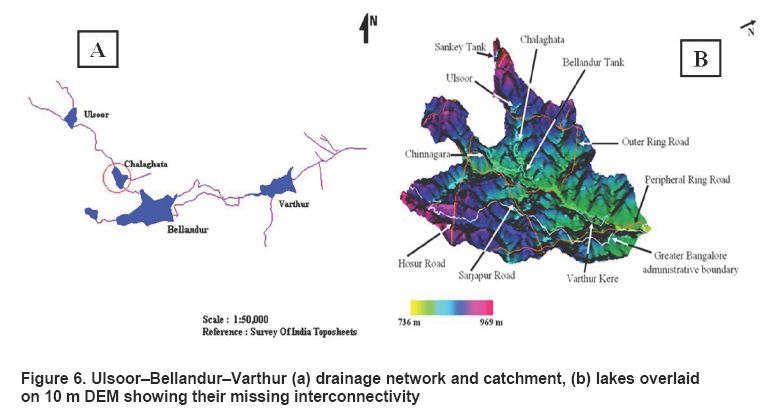
Reclamation of lakes for various developmental activities has resulted in the loss of interconnectivity in Bangalore district leading to higher instances of floods even during the normal rainfall. Analyses of Bellandur and Ulsoor drainage network (Figure 6) showed that the network is lost due to conversion of Chelgatta tank into a golf course. Ulsoor Belandur catchment has six lakes Sankey, Ulsoor, Chalghata, Chinnagara and Varthur and was classified into three major land use types built-up, vegetation, and others (comprising open land, waste land etc). The total rainfall yield in this catchment is 240Mm3, percolated water is 90Mm3 and water overflow is 150Mm3. The SRTM DEM data were re-sampled to 10m resolution and the volume of each lake was computed assuming the depth to be 1m and the mean annual rainfall to be 850mm. The total volume of all the 6 lakes in this catchment is 73Mm3. Hence there is an overland surplus flow of 77Mm3 which cannot flow to downstream due to disruption of natural drainage (removal of lakes and blockage of storm water drains) resulting in flooding (even during normal rainfall).
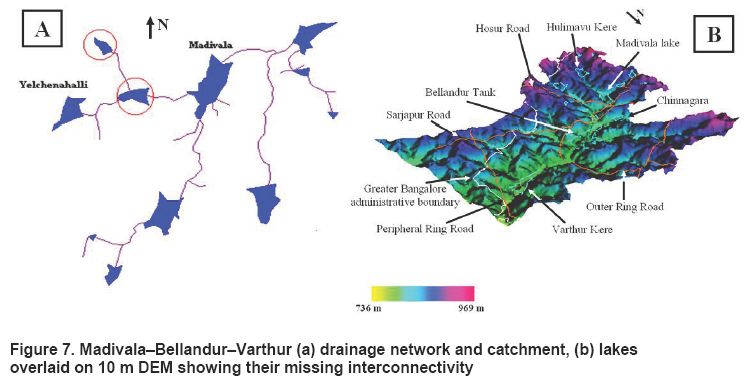
Similar analyses for the Madivala and Bellandur drainage network revealed that encroachment and conversion has resulted in the loss of connectivity between Yelchenhalli kere and Madivala (Figure 7). Madivala Varthur catchment has 14 lakes Venkatapura, Yellakunte, Bandepalya, Begur Doddakere, Madivala, Hulimavu, Marenahalli, Govindanaikana kere, Tank north of Doresanipalya, Gittigere, and Vaddarpalya. The total rainfall yield is 247Mm3, percolated water is 97Mm3 and the remaining water 150Mm3 flows as overland flow and storage in lakes. The total volume of all the lakes considering 1m depth is 110Mm3, resulting in the excess of 40Mm3 from the catchment leading to artificial floods.
Increased peak discharge and higher frequency of floods are the consequences of urbanization. As land is converted from fields or woodlands to built-up areas, roads, and parking lots, it loses its ability to absorb rainfall. Urbanization has increased runoff two to six times over what would occur on natural terrain in some pockets of Bangalore. During periods of urban flooding, streets become swift moving rivers, while low lying residential areas and basements become death traps as they fill with water. Conversion of water bodies to residential layouts has further compounded the problem in an undulating terrain.
Flooding in urban areas causes large damage to buildings and other public and private infrastructure (evident during 1997, 2002 and 2007). Besides, street flooding can limit or completely hinder the functioning of traffic systems and has indirect consequences such as loss of business and opportunity. The expected total damage, direct and indirect monetary damage costs as well as possible social consequences is related to the physical properties of the flood, i.e. the water level above ground level, the extent of flooding in terms of water volume escaping from or not being entering the drainage system, and the duration of flooding.
Also, due to increased paved surfaces and concentrated human activities the magnitude of the difference in observed ambient air temperature between urban pockets (artificial land surface) and the regions covered with vegetation (natural areas), is ascribed as the urban heat island effect. The urban heat island effect results in increased local atmospheric and surface temperatures in urban pockets compared to the surrounding open spaces, etc. Specifically, surface and atmospheric temperatures are increased by anthropogenic heat discharge due to energy consumption, increased land surface coverage by artificial materials having high heat capacities and conductivities, increased vehicular and industrial emissions and the associated decreases in vegetation and water-pervious surfaces, which reduce surface temperature through evapotranspiration. An attempt is made here to understand the implications of land cover changes on local climate.
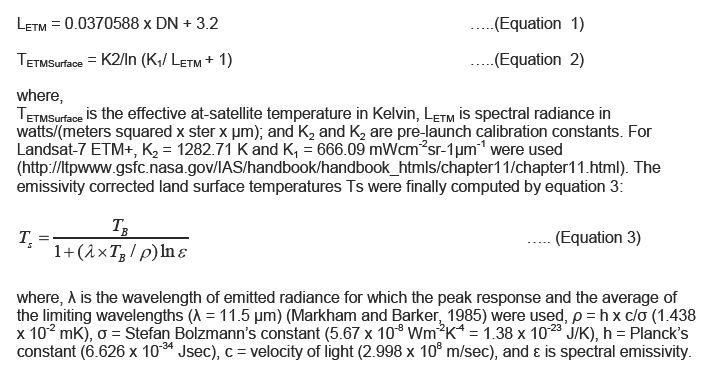
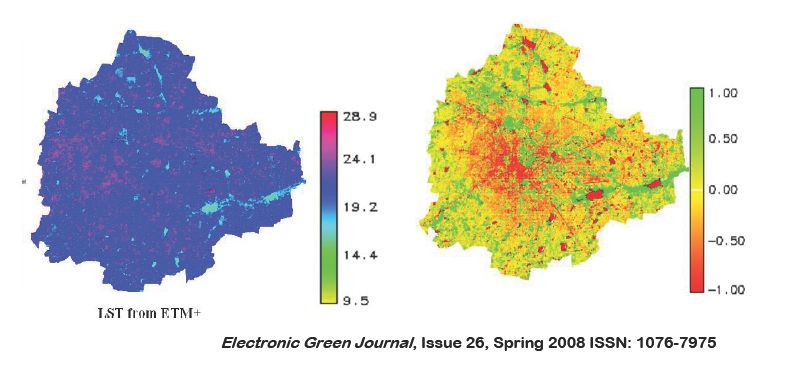
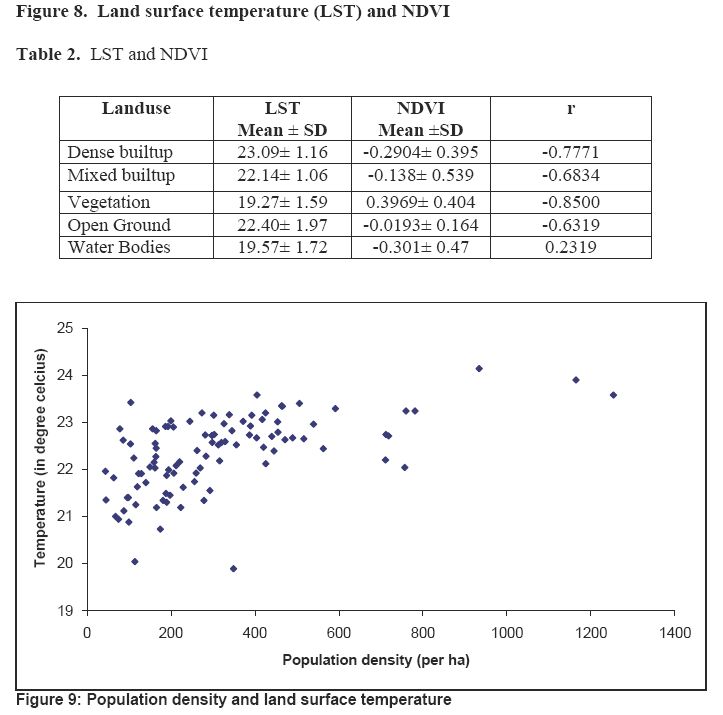
The minimum and maximum temperatures from ETM+ data were 13.49 and 26.32 with a mean of 21.75 and SD of 2.3. Figure 8 shows the LST map and NDVI of Greater Bangalore and Table 2 lists the respective LST and NDVI values. Analysis of LST shows a variation from 23.09°C (dense urban), 22.4°C (open ground) to 22.14°C (mixed urban), 19.27°C (for area under vegetation) and 19.57°C (water bodies) indicating the enhanced temperatures in urbanized regions (Table 2). Figure 9 illustrates temperatures with population density for 100 wards of city conforming heat island phenomenon with the increase in built-up area consequent to the increase in population density. Temporal analysis showed a linear growth of 466% in number of urban pixels from 1973 to 2007 and a decline of 61% in the number of water bodies with a 63% decrease in vegetation cover. Similarly during 1992 to 2007, the increase in built-up pixels was 63% while vegetation and water bodies decline by 45 and 43.8% respectively. Correlation analysis of LST with built-up areas and vegetation shows relationships of increasing LST with increase in built-up areas and decrease of vegetation and water bodies (Table 2).