 |
MODELLING HYDROLOGIC REGIME OF LAKSHMANATIRTHA WATERSHED, CAUVERY RIVER
|
 |
T.V. Ramachandraa,b,c,*, Nupur Nagard, Vinay Sa, Bharath H Aithal a,b
aEnergy & Wetlands Research Group, Centre for Ecological Sciences [CES], bCentre for Sustainable Technologies (astra)
cCentre for infrastructure, Sustainable Transportation and Urban Planning [CiSTUP]
dDepartment of Civil Engineering ,NITK Surathkal,
Indian Institute of Science, Bangalore, Karnataka, 560 012, India,
*Corresponding author:
cestvr@ces.iisc.ac.in.
RESULTS AND DISCUSSION
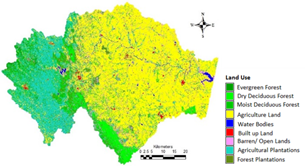
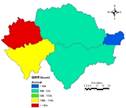
Land use analysis was carried out for the year 2013 using Landsat 8 dataset, and the results area as depicted in fig 7 and in table 8. The accuracy of the classification was 94% and the kappa was 0.92.
Fig. 7: Land use Lakshmanatirtha
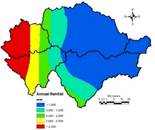
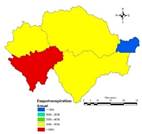
Rainfall data of 22 rain gauge stations (inside and surrounding the catchment) were interpolated in order to assess the rainfall distribution and is depicted in fig 8. Ghats shows presence of very high rainfall over 3000 mm and the plains with less than 1000 mm annually, and the annual net rainfall in each of the watershed is as depicted in fig 8.
Table 8: Land Use of Lakhshmanatirtha Catchement
Land Use |
Area (ha) |
Percent |
Agriculture |
208125.9 |
52.44 |
Agricultural Plantations |
77380.91 |
19.50 |
Forest Plantations |
24490.53 |
6.17 |
Evergreen Forest |
8962.47 |
2.26 |
Moist Deciduous Forest |
18040.5 |
4.55 |
Dry Deciduous Forest |
30133.53 |
7.59 |
Built-up land |
2805.39 |
0.71 |
Water Bodies |
2545.47 |
0.64 |
Open/ Barren lands |
24432.39 |
6.16 |
Total Area |
396916.89 |
100 |
Fig. 8: Rainfall distribution
|
|
Runoff in kilo.cum |
Infiltration in kilo.cum |
|
|
Ground Water Recharge in kilo.cum |
Water in Vadose kilo.cum |
Fig. 9: Net Rainfall, Infiltration, Ground Water recharge and Water in Vadose in kilo.cum
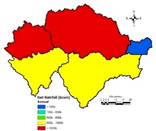
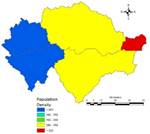
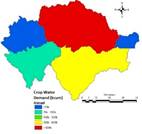
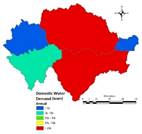
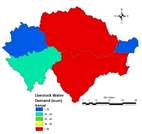
The hydrologic characteristics of the watersheds are depicted in fig. 9. It can be visualized that, the presence of forest in the Ghats has its role in reducing the surface runoff, increased infiltration levels, higher water storage capacity in the vadose and higher recharge into the ground water. On the contrary, the presence of open land, agriculture fields, and plantation activities has led to higher runoff, followed by lower infiltration levels. The demand of water as domestic, agriculture, livestock and the evapotranspiration is as shown in fig. 11 and the total demand calculated as sum of domestic, agriculture, livestock and evapotranspiration is as depicted in fig 12. To estimate the demand of domestic water, population for the year 2013 was estimated and is as depicted in fig. 10. From fig. 12, i.e., the total demand, it could be observed that in which ever the watershed, the population is high and higher agricultural activates exists, the demand for water is rather high compared to those in watersheds with higher natural vegetation cover this contributes to evapotranspiration only.
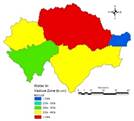
Based on the monthly supply and demand of water the water balance in the catchment was assessed and is as depicted in fig. 13, it was found that the water availability in the watersheds to cater the demand was higher in those with higher forest cover and less in that where in forests is very sparse, accompanied by variations in the rainfall. The Ghats regions of the catchment showed higher water availability than that of the plains which showed higher water deficiency and hence it can be said that these watersheds are failing to maintain the environmental flow.
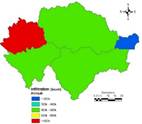
Fig. 10: Population density for the year 2013 as persons per sq.km
|
|
Crop Water Requirement in kilo.cum |
Domestic water requirement |
|
|
Livestock water requirement kilo.cum |
Evapotranspiration in kilo.cum |
Fig. 11: Crop water requirement, Domestic Water requirement, Livestock Requirement and Evapotranspiration
Fig. 12: Total Demand
Fig. 13: Water Deficiency in the basin
|
Citation: T.V.Ramachandra, Nupur Nagar, Vinay S, Bharath H Aithal. Modelling Hydrologic regime of Lakshmanatirtha watershed, Cauvery river. 2014 IEEE Global Humanitarian Technology Conference - South Asia Satellite (GHTC-SAS) | September 26-27, 2014.
T.V. Ramachandra
Centre for Sustainable Technologies, Centre for infrastructure, Sustainable Transportation and Urban Planning (CiSTUP), Energy & Wetlands Research Group, Centre for Ecological Sciences, Indian Institute of Science, Bangalore – 560 012, INDIA.
E-mail : cestvr@ces.iisc.ac.in
Tel: 91-080-22933099/23600985,
Fax: 91-080-23601428/23600085
Web: http://ces.iisc.ac.in/energy
Nupur Nagar
Energy and Wetlands Research Group, Centre for Ecological Sciences. Indian Institute of Science, Bangalore – 560 012, India
Vinay S
Energy and Wetlands Research Group, Centre for Ecological Sciences. Indian Institute of Science, Bangalore – 560 012, India
E-mail: vinay@ces.iisc.ac.in
Bharath H Aithal
Energy and Wetlands Research Group, Centre for Ecological Sciences. Indian Institute of Science, Bangalore – 560 012, India
E-mail: bharath@ces.iisc.ac.in
| |