Results and Discussion
Hydrological integrity of a river basin ensures the maximum amount of water available naturally as stream flow, soil moisture etc., to meet ecological and social (domestic, irrigation and livestock) demands in a river basin. Monthly monitoring of hydrological parameters reveal that stream in the catchments with good forest (evergreen to semi-evergreen and moist deciduous forests) cover have reduced runoff as compared to catchments with poor forest covers. Runoff and thus erosion from plantation forests was higher from that of natural forests. Forested catchment have higher rates of infiltration as soil are more permeable due to enhanced microbial activities with higher amounts of organic matter in the forest floor (Ramachandra et al. 2013a). Streams with good native forest cover in the catchment showed good amount of dry season flow for all 12 months. While strems in the catchment dominated by agricultural and monoculture plantations (of Eucalyptus sp. and Acacia auriculiformis) are sesonal with water availability ranging between 4-6 months. This highlights the impacts of land use changes in tropical forests on dry season flows as the infiltration properties of the forest are critical on the available water partitioned between runoff and recharge (leading to increased dry season flows). This emphises the need for integrated watershed conservation approaches to ensure the sustained water yield in the streams.
Land use change:
Sharavathi river basin in the Western Ghats has been a subject of research and debates due to its ecologically rich environment (Ramachandra et al. 2013b; Ramachandra et al. 2014b). The 1940 SOI toposheet show that the entire river basin was covered with forests. Table 3 gives the percentage change analysis of forest cover (reserved forests) based on 1940 toposheets (48K/13, 48J/16 and 48O/1), and 1989 (Landsat TM) and 1999 (LISS III) imageries. This shows that more than 50% of the forests have decreased/removed by human activities and submergence due to damming the Sharavathi River.
Classified remote sensing data corresponding to the upstream of Sharavathi river basin (upstream) for 1989 and 1999 are given in Figure 10 and 11 respectively. Table 4 gives the error matrix generated for Landsat TM 1989 classified data, which indicates an overall accuracy of classification as 96.4%. Similarly, Table 5 lists the confusion matrix (error matrix) for IRS LISS III data with an accuracy of 97.6%. Low accuracy for settlements from both the imageries is partly due to spectral signature overlap with vegetation as most of the houses are surrounded by vegetation inside and outside the compound. Townships are few and houses are sparsely distributed separated by hundreds of meters. Since the building material is also different as almost all houses have tiled roof than concrete, overlap also occurred between open fields. Overlap of spectral signatures was also observed between evergreen/semi-evergreen forest and moist deciduous forests in full leaf.
Table 3: Changes in Reserve Forests Area (1940-1999)
1940 (sq.km) |
1989 (sq.km) |
1999 (sq.km) |
Change in % (1940-1999) |
185.09 |
99.46 |
89.73 |
-51.52% |
Table 4: Error Matrix (Landsat TM, 1989)
|
Evg/SE |
MD |
Plant |
Grass |
Agri |
Open |
Sett |
Water |
Total |
Evg/SE |
4125 |
0 |
0 |
0 |
0 |
0 |
0 |
0 |
4125 |
MD |
208 |
319 |
2 |
0 |
0 |
0 |
0 |
0 |
529 |
Plant |
2 |
1 |
85 |
0 |
0 |
0 |
0 |
0 |
88 |
Grass |
0 |
0 |
0 |
17 |
0 |
0 |
0 |
0 |
17 |
Agri |
0 |
0 |
0 |
0 |
326 |
0 |
0 |
0 |
326 |
Open |
0 |
0 |
0 |
1 |
1 |
62 |
0 |
0 |
64 |
Sett |
0 |
0 |
0 |
0 |
0 |
9 |
8 |
0 |
17 |
Water |
0 |
0 |
0 |
0 |
0 |
0 |
0 |
1211 |
1211 |
Total |
4333 |
320 |
87 |
18 |
327 |
71 |
8 |
1211 |
6377 |
Note: Evg/SE - evergreen/semievergreen forests; MD – moist deciduous forests; Plant – plantations; Grass – grasslands and scrubs; Agri – agricultural lands; Open – open fields; Sett- settlements
Table 5: Error Matrix (IRS LISS III, 1999)
|
Evg/SE |
MD |
Plant |
Grass |
Agri |
Open |
Sett |
Water |
Total |
Evg/SE |
553 |
0 |
19 |
0 |
0 |
0 |
0 |
0 |
572 |
MD |
0 |
586 |
0 |
0 |
0 |
1 |
0 |
0 |
587 |
Plant |
17 |
0 |
101 |
0 |
0 |
0 |
0 |
0 |
118 |
Grass |
0 |
0 |
0 |
191 |
0 |
0 |
0 |
0 |
191 |
Agri |
0 |
0 |
0 |
1 |
168 |
0 |
0 |
0 |
169 |
Open |
0 |
0 |
0 |
0 |
0 |
278 |
0 |
48 |
326 |
Sett |
0 |
14 |
0 |
0 |
0 |
0 |
7 |
0 |
21 |
Water |
0 |
0 |
0 |
0 |
0 |
0 |
0 |
981 |
981 |
Total |
570 |
600 |
120 |
192 |
168 |
279 |
7 |
981 |
2965 |
Note: Evg/SE - evergreen/semievergreen forests; MD – moist deciduous forests; Plant – plantations; Grass – grasslands and scrubs; Agri – agricultural lands; Open – open fields; Sett- settlements
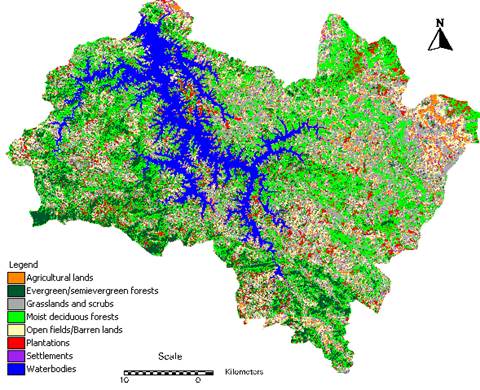
Figure 10: Land use Classification (Landsat TM, 1989)
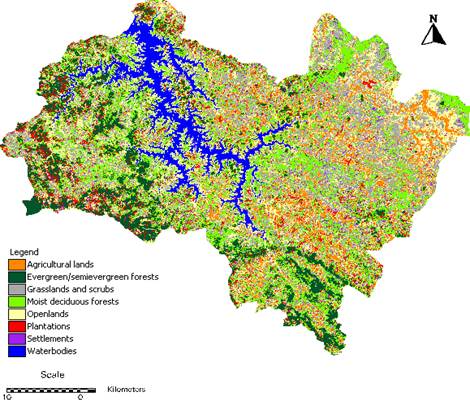
Figure 11: Land use Classification (IRS LISS III, 1999)
Table 6 compares the percentage change in the land use in Sharavathi upstream river basin based on 1989 and 1999 data. It is seen that natural forests such as evergreen/semi-evergreen and moist deciduous forests have decreased by 28.2% whereas monoculture plantations (due to afforestation work of the forest department) have increased by 17.3%. Grasslands and scrubs have decreased by 28.4% in 1999 but this can be attributed to the season as in summer, grasses dry out leaving only the scrubs. The main anthropogenic activity apart from plantation is paddy cultivation, which has increased by 5% in 1999. Paddy cultivation is the most common agricultural activity in the basin and is usually grown in valleys.
Human population is increased in the basin and there has been immigration of people from adjoining districts of Karnataka and also from neighbouring States. Although the dam has provided electricity, water and other benefits to the surrounding areas, it has proved to be at the cost of the valuable ecosystem. Evergreen forests are being cleared to yield timber, which are used for electric transmission poles and railway sleepers. The felled areas are sometimes tended for getting the natural regeneration of valuable species. Deciduous forests supply timber, firewood, charcoal, bamboo, matchwood and plywood. Monoculture plantations of teak, silver oak (Gravillea robusta), matchwood, Acacia sp., etc. are planted by the forest department in clear felled forest areas. Table 7 give the sub-basin wise area under different land uses.
Table 6: Changes in Land use in Upstream (1989-1999)
Land use/Land cover |
1989 (km2) |
1999 (km2) |
Change in % |
Evergreen/semievergreen forests |
272.67 |
209.39 |
- 23.2 |
Moist deciduous forests |
539.26 |
512.25 |
- 5 |
Plantations |
122.09 |
143.29 |
+17.3 |
Grasslands and scrubs |
433.98 |
310.6 |
- 28.4 |
Agricultural lands |
102.77 |
157.36 |
+ 53.1 |
Open fields/Barren lands |
247.96 |
430.29 |
+ 73.5 |
Settlements |
52.63 |
78.48 |
+ 49.1 |
Water bodies |
218.01 |
147.31 |
-32.4 |
Table 7 Land use in the upstream of Sharavati (Sub basinwise in sq.km)
Sub Basins |
Evg/SE |
MD |
Plant |
Grass |
Agri |
Open |
Sett |
Yenneholé |
54.22 |
45.52 |
29.27 |
22.82 |
2.07 |
38.5 |
6.05 |
Nagodiholé |
26.17 |
15.21 |
8.87 |
3.09 |
.03 |
8.42 |
2.81 |
Hurliholé |
22.14 |
30.45 |
7.99 |
13.37 |
1.24 |
18.26 |
3.08 |
Linganamakki |
50.47 |
202.38 |
55.41 |
13.37 |
50.47 |
194.91 |
25.72 |
Hilkunji |
25.79 |
30.02 |
5.57 |
6.53 |
4.94 |
9.9 |
3.67 |
Sharavathi |
16.29 |
40.66 |
14.16 |
16.35 |
19.37 |
27.31 |
7.06 |
Mavinaholé |
2.36 |
33.9 |
4.87 |
20.47 |
10.3 |
18.08 |
6.62 |
Haridravathi |
3.87 |
64.87 |
11.65 |
79.9 |
49.93 |
73.39 |
14.34 |
Nandiholé |
2.22 |
48.48 |
5.19 |
52.71 |
18.71 |
41.03 |
8.96 |
Note: Evg/SE - evergreen/semievergreen forests; MD – moist deciduous forests; Plant – plantations; Grass – grasslands and scrubs; Agri – agricultural lands; Open – open fields; Sett- settlements
Rainfall analysis
Yearly data for hundred years were available for 7 taluks in and around the river basin viz. Hosanagara, Sagara, Soraba and Tirthahalli (Shimoga district) and Honnavar, Kumta and Siddapur (Uttara Kannada district). Since these are the taluks surrounding the river basin, rainfall analysis is done to study any variation in rainfall for 100 years. The rainfall periods were divided into 1901-1964 and 1964-2001, which represents respectively the periods before construction and after construction of Linganamakki dam. Table 8 gives the mean and standard deviation of rainfall in Shimoga district. Hosanagara, Sagara, Tirthahalli and Siddapur taluks showed reduction in the mean annual rainfall with a significant reduction in Tirthahalli taluk. Sagara and Hosanagara were selected for further studies as these districts cover the study area.
The sub-basins were further classified into clusters viz. west, east, south and central depending on their geographical locations. Rainfall data were available for 18 rain gauge stations (within the upstream) from 1989-1999. The mean rainfall (1989-1999) was determined for each sub basin in order to observe the rainfall variation and distribution within the river basin. They were classified as follows:
- West-Yenneholé, Nagodiholé and Hurliholé
- Central-Linganamakki
- East- Nandiholé, Haridravathi and Mavinaholé
- South- Sharavathi and Hilkunji
Figure 12 illustrates the mean annual precipitation variability in western and eastern sub-basins.
Regression analysis was carried out for each rain gauge station considering rainfall as dependent variable and latitude, longitude, altitude and land cover as independent variables. The area of influence of each rain gauge station in the upstream was delineated with respect to contours and drainage and the land cover expressed as NDVI was determined using the imagery for each area around the gauge. Regression analysis showed rainfall having significant relationship with variables such as land cover, latitude, longitude, and altitude. At 5% level of significance rainfall showed good relationship between land cover, latitude, altitude and longitude. The probable relationships are given in Table 9. From the regression relationship, it is evident that the rainfall increases with land cover (NDVI) and decrease with latitude, longitude and altitude. Sensitivity analysis show the relationship holds good for all sub basins in the upstream region of the river basin.
Table 8: Variation of Rainfall in Shimoga
Taluk |
1901-2001 (mm) |
COV
(%) |
1901-1964
(mm) |
COV
(%) |
1965-2001
(mm) |
COV
(%) |
Change in rainfall (%) |
Hosanagara |
2813.9 ± 754.4 |
26.8 |
2854.2 ± 683.4 |
23.9 |
2752.8 ± 859.9 |
31.2 |
-3.55 |
Sagara |
2098.1 ± 523.6 |
24.9 |
2144.5 ± 560.3 |
26.1 |
2018.4 ± 444.2 |
22 |
-5 |
Soraba |
1583.8 ± 430.0 |
27.1 |
1627.3 ± 388.6 |
23.8 |
1511.4 ± 488.6 |
32.3 |
2.4 |
Tirthahalli |
3051.8 ± 783.6 |
25.6 |
*3132.9 ± 841.4 |
26.8 |
2742.6 ± 607.0 |
22.1 |
-12.45 |
Honnavar |
3485.1 ± 687.8 |
19.7 |
3360.6 ± 775.4 |
23 |
3636.3 ± 565.5 |
15.55 |
8.2 |
Kumta |
3755.9 ± 750.7 |
19.9 |
3633.8 ± 831.9 |
22.8 |
3391.1 ± 575.3 |
16.9 |
-6 |
Siddapur |
2999.8 ± 769.9 |
25.6 |
3037 ± 793.2 |
26.1 |
2935.6 ± 734.4 |
25 |
-3.3 |
Table 9: Probable Relationships of Rainfall
X (independent) |
Y (dependent) |
Probable relationships |
r |
p |
Latitude |
Rainfall |
Rainfall = -6541.28 (latitude) +95120.76 |
0.45 |
0.043 |
Land cover |
Rainfall |
Rainfall = 1243.97 (land cover)-3679.31 |
0.71 |
0.0 |
Longitude, latitude |
Rainfall |
Rainfall =(1864.41(long) -8504.99(lat)+262543.8 |
0.56 |
0.036 |
Longitude, land cover |
Rainfall |
Rainfall = -234.71 (long) +1232.78 (land cover)+14011.74 |
0.71 |
0.002 |
Altitude, land cover |
Rainfall |
Rainfall = -4.33 (alt)+1273.63 (land)-1201.39 |
0.72 |
0.002 |
Land cover, latitude |
Rainfall |
Rainfall = -4.33 (alt)+1273.63 (land)-1201.39 |
0.74 |
0.001 |
Longitude, altitude, latitude |
Rainfall |
Rainfall = - 1868.78 (long)-8989.5 (lat) -4.97 (alt)+272688.8 |
0.58 |
0.076 |
Longitude, latitude, land cover |
Rainfall |
Rainfall = -926.48 (long) -4486.52 (lat) +997.16 (land)+130029.1 |
0.75 |
0.003 |
Altitude, land cover, longitude |
Rainfall |
Rainfall = - 4.2 (alt) +1264.58 (land) -171.13 (long)+11623.16 |
0.72 |
0.007 |
Land cover, altitude, latitude, longitude |
Rainfall |
Rainfall = 1016.06 (land) -6.07 (alt) -5002.23 (lat) -914.05 (long)+139910.8 |
0.77 |
0.005 |
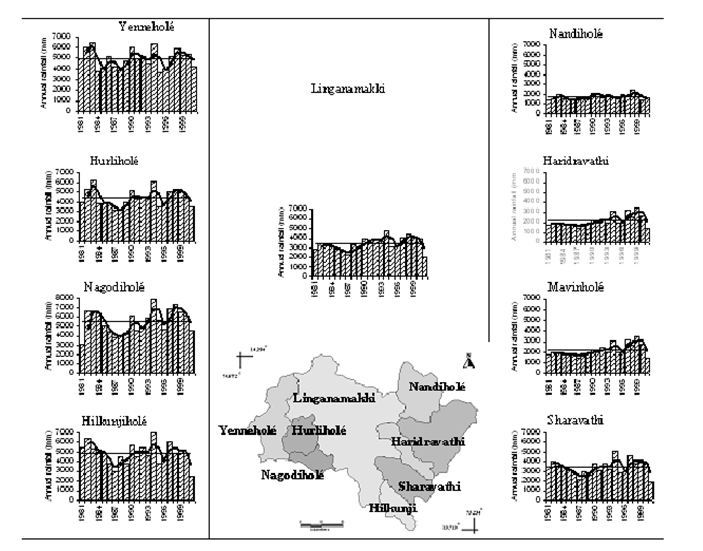
Figure 12: Annual rainfall pattern in last two decades in the sub-basins of Sharavathi river upper catchment.
Interception
Evergreen forests are multilayered and are replete with climbers: lianas and epiphytes. They also have a thick canopy, which can attribute to higher interception in evergreen forests. It is followed by moist deciduous forest which even though have large leaves are more open compared to evergreen/semi-evergreen forests. The structure and composition is also different. There is no layering but the amount of under brush is high as compared to evergreen forests due to better light penetration. Evergreen/semi-evergreen forests are almost bare of ground vegetation and plants grow only if sufficient light penetrates through gaps in the canopies (Putty and Prasad 2000; Ramachandra et al. 2015). Plantations (acacia) show low values due to the smaller leaf size, which reduces the overall canopy interception. Acacia and areca constitutes a major portion of the plantation trees and have long narrow, vertically aligned leaves. Vertically aligned leaves intercepts lesser rainfall as compared to broad leaves. Areca plantations do have some understorey – small shrubs that yields fruit and sometimes mulching with green leaves is practiced to prevent soil erosion during high intensity precipitation. Paddy intercepts the least rainfall, which shows that interception is highest in trees than in crops or grasses (Calder and Newson 1979; Gash et al. 1980; Lloyd et al. 1988; Shuttleworth 1989; Singh 1992). Interception is highest during July as it receives the highest rainfall and lowest during September and October as these months receive the lowest rainfall in the basin (Figure 13). Table 10 clearly shows the increase in interception with vegetation and rainfall. High interception in western sub basins is due to good vegetation cover such as evergreen/semi-evergreen forest and moist deciduous forests whereas the vegetation cover such as natural forests is lesser in eastern sub basins. Plantations and agricultural activities are higher in the eastern and southern basins.
Table10: Percentage of Interception w.r.t Rainfall
Sub basins |
Interception (%) |
Yenneholé |
26.13 |
Nagodiholé |
28.21 |
Hurliholé |
26.73 |
Linganamakki |
24.92 |
Hilkunji |
27.69 |
Sharavathi |
25.48 |
Mavinaholé |
23.61 |
Haridravathi |
21.82 |
Nandiholé |
23.29 |
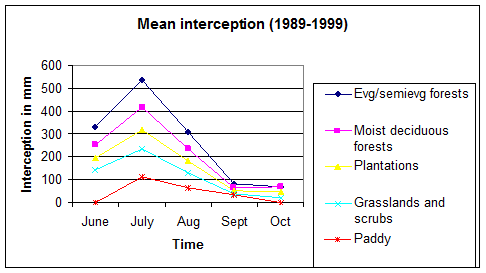
Figure 13: Mean Interception for Different Vegetation Types
Runoff
The most common drainage pattern found in upstream river basin is dendritic. However, the drainage density differs from west to east of the basin that is it decreases from west to east. High drainage densities usually reduce the discharge in any single stream, more evenly distributing runoff and speeding runoff into secondary and tertiary streams. Where drainage density is very low, intense rainfall events are more likely to result in high discharge to a few streams and therefore a greater likelihood of "flashy" discharge and flooding in humid areas and suggests resistant bedrock. Table 11 lists the drainage densities and sediment yields in the sub basins.
Western sub basins, which are highly vegetated show the highest values due to steep slopes and clayey soil texture. Sediment yield is inversely proportional to vegetation cover. Though western sub basins have steeper slopes compared to eastern sub basins e.g. Nandiholé, good vegetation cover in the former impedes much of the sediment load and thus erosion during high rainfall events. Table 12 gives the mean monthly surface runoff from each sub basin. Surface runoff progressively increases from evergreen/semi-evergreen forests to settlements, indicating that where there is good vegetation cover, surface runoff is less. Forests usually have thick leaf litter and a spongy humic horizon, both of which retard surface runoff or overland flow. Among the forest types, plantation forests showed higher runoff. Certain species such as Tectona Grandis, which are mostly found in the eastern sub basins, cause severe erosion. This is due to the large leaves, which produce big raindrops, which roll of the leaves, and causes splash and subsequently rill erosion if not protected by underbrush.
Groundwater recharge and discharge
Groundwater recharge analysis results are given in Table 13. The rate of replenishment or recharge is dependent on the soil moisture status, which in turn is dependent on soil texture. Soil texture in the study area varies from loamy sand to clay loam. From soil studies (Kumar and Ramachandra, 2005), sand is an important constituent in the basin and is responsible for high infiltration rates. Average recharge in the basin is 30.3% of the rainfall. Total mean monthly recharge is observed to vary from west to east with the eastern sub basins receiving the least recharge. Mean monthly recharge under different land use indicate that recharge under vegetation is higher as compared to other land cover types.
Table 11: Drainage Density and Sediment Yield
Sub basins |
Drainage density
(km/km2) |
Sediment yield
( x 106 m3/year) |
Yenneholé |
2.43 |
0.016 |
Nagodiholé |
2.8 |
0.040 |
Hurliholé |
2.6 |
0.019 |
Linganamakki |
0.9 |
0.354 |
Hilkunji |
2.16 |
0.057 |
Sharavathi |
1.64 |
0.087 |
Mavinaholé |
1.42 |
0.057 |
Haridravathi |
1.01 |
0.176 |
Nandiholé |
0.74 |
0.11 |
Table 12: Mean Monthly Surface Runoff (1989-1999)
Months
Sub basins |
June
(mm) |
July
(mm) |
August
(mm) |
September
(mm) |
October
(mm) |
Total
(mm) |
Yenneholé |
311.05 |
499.64 |
309.65 |
79.89 |
48.06 |
1241.96 |
Nagodiholé |
398.42 |
603.27 |
343.27 |
86.37 |
96.16 |
1496.39 |
Hurliholé |
305.97 |
499.79 |
256.57 |
69.39 |
54.67 |
1180.72 |
Linganamakki |
324.11 |
530.22 |
290.1 |
71.36 |
81.74 |
1287.72 |
Hilkunji |
257.06 |
408.14 |
232.17 |
59.98 |
47.94 |
1000.1 |
Sharavathi |
262 |
364.06 |
176.1 |
48.39 |
76.35 |
914.29 |
Mavinaholé |
218.79 |
356.71 |
176.64 |
52.68 |
80.48 |
871.5 |
Haridravathi |
262 |
364.06 |
176.1 |
48.39 |
76.35 |
702.28 |
Nandiholé |
141.28 |
217.82 |
139.67 |
42.08 |
95.44 |
623.9 |
Upstream |
266.42 |
421.37 |
236.88 |
62.71 |
82.12 |
1058.05 |
Table 13: Mean Monthly Recharge (1989-1999)
Months
Sub basins |
June
(mm) |
July
(mm) |
August
(mm) |
September
(mm) |
October
(mm) |
Total
(mm) |
Yennehole |
373.61 |
620.46 |
380.94 |
98.59 |
46.94 |
1513.76 |
Nagodihole |
506.22 |
770.94 |
438.34 |
109.72 |
65.5 |
1883.3 |
Hurlihole |
329.02 |
546.28 |
280.09 |
75.23 |
58.44 |
1282.99 |
Linganamakki |
280.83 |
495.75 |
270.88 |
66.03 |
58.7 |
1164.7 |
Hilkunji |
294.71 |
503.31 |
286.14 |
73.55 |
45.44 |
1198.12 |
Sharavathi |
212.25 |
338.87 |
163.59 |
44.53 |
52.81 |
803.28 |
Mavinahole |
178.7 |
291.96 |
144.72 |
42.68 |
65.12 |
712.04 |
Haridravati |
125.9 |
217.48 |
135.84 |
42.98 |
63.57 |
576.13 |
Nandihole |
119.75 |
205.33 |
131.17 |
39.17 |
56.17 |
544.55 |
Upstream |
220.16 |
360.62 |
200.06 |
55.44 |
59.33 |
886.71 |
The determination of groundwater volumes and flow rates requires a thorough knowledge of the geology of the groundwater basin (Viessman 1989). The geologic structure of a groundwater basin governs the occurrence and movement of the groundwater beneath it. Base flow contribution to stream flow varies widely according to the geologic nature of the aquifer. The two major rock types occurring in the basin are gneisses /granites and greywackes. Gneisses and granites have the lowest specific yield (3%) and occur in the eastern portion of the study area such as Mavinahole, Haridravati and Nandihole. Hence, streams here are ephemeral indicating baseflow only during monsoon season. Western sub basins have perennial streams, which is an indication of the rock types present in the area. The region consists of greywackes, which has higher specific yield of 27%. Another important reason for better discharge in western sub basins is the good vegetation cover. Natural forests retard much of the overland flow facilitating in enhanced infiltration and thus recharge. In other words, regardless of the geology the amount of water entering an aquifer is dependent first on the vegetation and soil present in the area. Forestlands cleared for agriculture or other purposes increases overland flow thus decreasing recharge and subsequent discharge into the streams.
Mean monthly water table levels in the select observation wells showed similar seasonal fluctuations that is water table rises during monsoon season and thereafter decreases. Water table is almost steady during August to September and decreases with the maximum decline in the month of May. Decrease in water levels is partly due to natural discharge or base flow and partly due to artificial extraction of groundwater. Streams located south of the basin receive substantial base flow during non-monsoon season. The amount of base flow decreases from south to east such as Nandihole and Haridravati. It is observed that wells in the region have reported decrease in water levels and as such fail to provide base flow during the lean season. Streams in these sub basins are ephemeral. The total change in storage for each sub basin is given in Table 14. Storage consists of the water contained in soil and the underlying rock. Higher storage in western sub basins is responsible for the lush vegetation present in these areas. Mean annual volumes of hydrological components in each sub basin are given in Table 15.
Table 14: Total Storage in Sub Basins
Sub basins |
Mean Total Storage (x 106 M cu.m) (June-Oct) |
Yenneholé |
233.09 |
Nagodiholé |
171.56 |
Hurliholé |
86.80 |
Linganamakki |
834.69 |
Hilkunji |
68.55 |
Sharavathi |
70.54 |
Mavinaholé |
48.03 |
Haridravathi |
51.21 |
Nandiholé |
17.6 |
The evergreen forests have high humidity thereby are the major driving forces in determining the amount of rainfall in these regions. Thus in the upstream, heavy rainfall occurs along Nagodi, Kogar and Aralagodu raingauge stations. Forest cover in these regions is also high (land cover analysis, land use analysis) indicating the close relationships between rainfall in Western Ghats regions with the type (evergreen, semi-evergreen, etc.) and spatial extent of vegetation cover (Table 16). Within the catchment area of Linganamakki, the areas surrounded by rich vegetation like Nagara, Karimane, Byakodu etc. receive high rainfall compared to fragmented, poorly vegetated eastern regions like Ulluru, Anandapura and Ripponpet.
Table 15: Mean Annual Volumes of Hydrological Component ( x 106 m3)
Sub basins |
R |
I |
ET |
E |
SR |
Pf |
GR |
GD |
Yenneholé |
983.6 |
191.96 |
80.7 |
25.37 |
281.78 |
0.67 |
286.79 |
26.47 |
Nagodiholé |
374.68 |
86.63 |
32.22 |
6.7 |
88.91 |
0.79 |
115.75 |
16.98 |
Hurliholé |
413.69 |
85.32 |
42.13 |
12.74 |
111.88 |
0.62 |
200.72 |
11.55 |
Linganamakki |
2915.53 |
379.06 |
265.12 |
228.73 |
815.2 |
- |
749.01 |
78.05 |
Hilkunji |
337.85 |
77.31 |
39.45 |
7.72 |
83.03 |
0.8 |
99.38 |
9.23 |
Sharavathi |
358.68 |
61.53 |
50.4 |
17.89 |
119.0 |
0.26 |
105.46 |
9.46 |
Mavinaholé |
254.41 |
42.71 |
33.16 |
13.58 |
78.81 |
0.3 |
64.97 |
1.17 |
Haridravathi |
555.82 |
77.56 |
90.3 |
51.25 |
188.13 |
- |
184.79 |
3.25 |
Nandiholé |
31.08 |
49.84 |
61.24 |
29.67 |
125.3 |
- |
97.37 |
1.86 |
Table 16: Land-use pattern (%) and associated annual rainfall in the sub-basins of Sharavathi River upstream.
Locality |
Annual |
Forests |
|
Plantation |
Grassland |
Agri |
Open |
Sett |
rainfall (mm) |
EVG/SE |
MD |
Nandiholé |
1715.2 |
1.25 |
27.34 |
2.93 |
29.73 |
10.55 |
23.14 |
5.05 |
Haridravathi |
1776.49 |
1.30 |
21.77 |
3.91 |
26.82 |
16.76 |
24.63 |
4.81 |
Mavinaholé |
2157.88 |
2.44 |
35.09 |
5.04 |
21.19 |
10.66 |
18.72 |
6.85 |
Sharavathi |
3382.4 |
11.54 |
28.80 |
10.03 |
11.58 |
13.72 |
19.34 |
5.00 |
Hilkunji |
4801.25 |
29.84 |
34.74 |
6.45 |
7.56 |
5.72 |
11.46 |
4.25 |
Huruliholé |
4410.05 |
22.94 |
31.54 |
8.28 |
13.85 |
1.28 |
18.92 |
3.19 |
Nagodi |
5597.5 |
40.51 |
23.54 |
13.73 |
4.78 |
0.05 |
13.03 |
4.35 |
Yenneholé |
4933.01 |
27.32 |
22.94 |
14.75 |
11.50 |
1.04 |
19.40 |
3.05 |
Linganamakki |
3423.25 |
8.51 |
34.14 |
9.35 |
2.26 |
8.51 |
32.88 |
4.34 |
* Water body constitutes 15.8% of the region
Note: EVG/SE: Evergreen/semi evergreen; MD: Moist deciduous; Agri: Agriculture; open: open area; sett: settlements
It is found that western side sub-basins (Nagodiholé, Huruliholé, Yenneholé) have rain fall ranges from 4500-6500 mm and their stream flow is quite high having grade of A (perennial streams). Sub-basinwise stream flow is given in Table 17. South east region (Sharavathi, Hilkunji) has rain fall of around 5000mm with stream flow moderate to high having grading of B-C (stream flow for 6 – 9 months). Finally sub-basins of eastern side (Nandiholé, Haridravathi and Mavinaholé) have rain fall of 1400-3000 mm which is very less and their stream flow is also quite low, graded C-D (4 – 6 months: mostly during monsoon).
Table 17: Stream flow data for major tributaries of streams in the Linganamakki catchment.
Stream |
Location |
Stream flow measurement
(Discharge m3/sec) |
Stream Grading* |
Oct. |
Nov. |
Dec. |
Jan |
Nandiholé |
Northeast |
01.23 |
03.68 |
0.09 |
0 |
D |
Haridravathi |
East |
16.23 |
03.02 |
0.46 |
0 |
D |
Mavinaholé |
East |
05.93 |
03.00 |
0.44 |
0 |
D |
Sharavathi |
Southeast |
26.73 |
5.83 |
1.08 |
0.964 |
C |
Hilkunji |
Southeast |
46.27 |
10.64 |
2.64 |
1.67 |
B |
Nagodiholé |
West |
22.56 |
4.84 |
1.90 |
1.42 |
A |
Hurliholé |
West |
06.30 |
1.37 |
0.78 |
0.661 |
A |
Yenneholé |
West |
NM |
13.40 |
1.81 |
1.68 |
A |
Natural and artificial forces operating over a watershed or a basin ultimately impacts its stream flow regime. Western clusters enjoy the benefit of good rainfall, vegetation and geology to give rise to stream flow even during the lean season. A contrast is seen on the eastern side as volume of stream progressively decreases from Hilkunji to Nandiholé sub basins. Modification of land by agriculture and other uses, unfavourable geology, clearcutting of natural forests and poor rainfall have resulted in decline in base flow during the non-monsoon months and significant decrease during summer (Mar-May). The study shows that spatial and temporal variation in rainfall corresponding to land use changes has significant role in the water yield in the catchment and hence the reservoir yield. Higher rainfall and the presence of perennial streams (and higher drainage density) in the Western side compared to the eastern side (relatively lower rainfall, poor drainage density and seasonal streams) is due to the large scale land use changes in the east.
|