Data and Methods
Remote sensing and collateral data used for the analysis are:
Satellite data
Table 2 gives information on the satellite data used in the study.
Satellite/sensor |
Date of Pass |
Path/Row |
Bands |
Source |
Landsat TM |
Nov, 1989 |
146/50 |
2,3, 4,5,6 and 7 |
http:// glcf.umiacs.umd.edu |
IRS LISS III |
Mar, 1999 |
97/63 |
1,2,3 and 4 |
NRSA, Hyderabad |
Note: Data for March 1989, was not available for IRS LISS III, while for 1989, only Landsat data was available.
Table 2: Satellite/Sensor Details
Ground truth and ancillary data
GPS points along with attribute information were collected in upstream to determine the type of land cover and land use such as vegetation, which includes evergreen-semievergreen and moist deciduous forests and plantations, degraded vegetation, agricultural activities, settlements, etc.
Maps and other ancillary data used for the study include:
i. Forest Map of South India (1982) by J.P. Pascal, French Institute of Pondicherry.
ii. Soil map published by the National Bureau of Soil Survey.
iii. Topographic maps of scale 1:50000 and 1:250000 from the Survey of India (SOI)
iv. Reconnaissance Soil Map of Forest Area, Western Karnataka and Goa
v. Geology map, Department of Mines and Geology
v Bio-climate of the Western Ghats (1982), J.P.Pascal, French Institute of Pondicherry.
Climate data
i. IMD Talukwise rainfall data (1901-2001) for Sagara, Hosanagara, Soraba and
Tirthahalli (Shimoga) and Honnavara, Kumta and Siddapur (Uttara Kannada).
ii. Daily rainfall data from Karnataka Power Corporation Limited for 18 rain gauge stations in Sharavathi river basin (1989-1999).
iii. IMD maximum and minimum temperature data (1969-2000) for Shimoga.
iv. IMD extraterrestrial solar radiation and number of sunshine hours for Shimoga
(1989-1999).
v. Water table level data (1989-1999) for selected wells in and around the study area from Dept. of Mines and Geology.
Remote sensing data analysis
This involved the initial processing of remote sensing data to correct for geometric distortions, to calibrate the data radiometrically and to eliminate the noise present in the data. Creation of false colour composite (FCC) consisted of assigning primary colours to gray values from near infrared, red and green bands (Figures 7 and 8). This helped in identifying heterogeneous patches, which were chosen for ground data collection (training polygons). Common classification procedures like supervised classification and unsupervised classification were adopted. Unsupervised classification involves clustering algorithms that examine the unknown pixels in an image and aggregate them into a number of classes based on the natural groupings or clusters present in the image values (Lillesand and Kiefer 2002). Supervised classification was done using Gaussian maximum likelihood classifier (GMLC) to classify the remote sensing data. GMLC uses the mean, variance and covariance data of the signatures to estimate a probability that a pixel belongs to each class. It tends to be more accurate if a large number of training sites are available. Here, the distribution of reflectance values in a training site is described by a probability density function, developed on the basis of Bayesian statistics.
Estimation of hydrological components
The aim here has primarily been to predict the amount of discharge from a basin apart from modelling water movement with in the basin through spatially distributed models. Attempts have been made in the development and application of hydrological models at a range of spatial levels, from plot to catchment, and temporal scales from event based models to annual water budgeting (Skidmore 2000). Figure 9 gives the flow chart of the method used in estimating each hydrological component. In order to capture the movement of water with in the basin, a spatially explicit approach using temporal remote sensing data is appropriate. It aids in quantifying land surface parameters that serves as input to the model in a spatially continuous fashion. Water budgeting of a basin describes the water movement with in the basin and the relation between the input, storage and output of water, which is given as:
Input –Output = Change in Storage in the system ……… 1
The following factors combine to express the water balance equation
Input: Direct precipitation (R) and Groundwater discharge (GD)
Output: Interception (I); Surface runoff (SR); Pipeflow (Pf: sub surface flow); Transpiration (ET: Evapo-transpiration from vegetation); Evaporation (E: evaporation from soil and open water); Groundwater recharge (GR). Equation 1, can be written as
P ±GWD ±I ± SR ± Pf ±ET ±E±GR = ±DS ……… 2
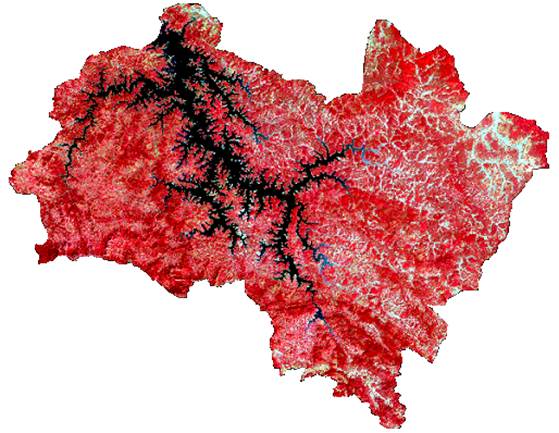
Figure 7: Landsat TM, 1989 FCC
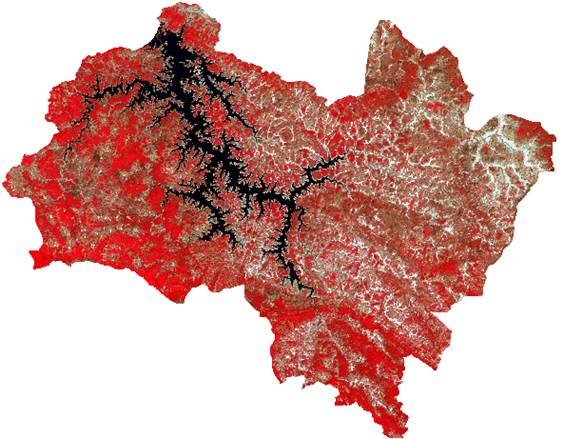
Figure 8: IRS LISS III, 1999 FCC
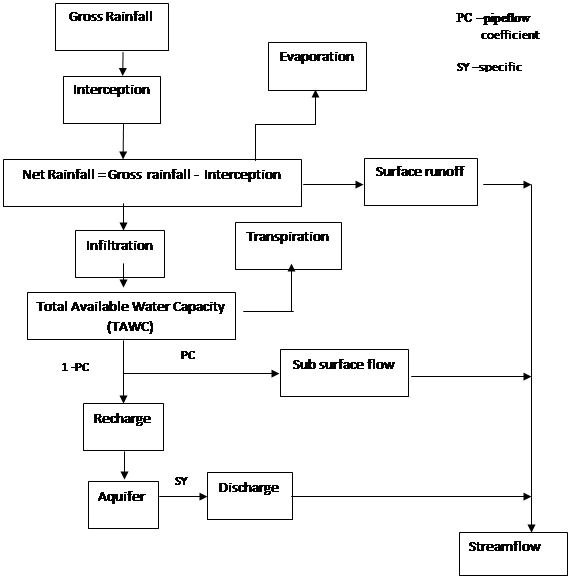
Figure 9: Estimation of Hydrological Components
Methods adopted for quantifying various hydrological constituents (Darcy 1856; Saint-Venant 1871; Singh 1992) are: P (Singh 1992; Raghunath 1985), I (Rutter et al. 1971; Calder and Newson 1979; Gash 1979; Singh 1992), SR (Horton 1933; Brakensiek 1967; Raghunath 1985), Pf (Putty and Prasad 2000), ET (Penman 1948; Turc 1961; Homes 1961; Monteith 1965; Shuttleworth and Calder 1979; Shuttleworth 1993), GR (Raghunath 1985; GWEM 1997), GD (Barnes 1939; Bruijnzeel 2004).
|