Materials and Method
Study area: The location of three micro watersheds, which form a part of Chandrabagha, Sutlej and Yamuna river basins is given in Figure 1. Details of the geography of the study area are given in Table 1. Plate 1 depicts the panoramic view of the studied watersheds.
Table 1: Geographical details of studied micro watersheds
Micro watersheds |
District |
Main watershed |
Latitude
(°N) |
Longitude (°E) |
Altitude
(m amsl) |
Area (sq.km) |
Mandhala |
Solan |
Yamuna |
30.87-30.97 |
76.82-76.92 |
400-1100 |
14.5 |
Moolbari |
Shimla |
Sutlej |
31.07-31.17 |
77.05-77.15 |
1400-2000 |
10 |
MeGad |
Lahaul and Spiti |
Chandrabhaga |
32.64-32.74 |
76.46-76.74 |
2900-4500 |
45 |
Mandhala: This area has mixed deciduous forests in an altitude below 1100 m. The prominent trees and shrubs found here are Flacourtia montana, Acacia catechu, Grewia optiva, Toona ciliata, Albizia procera, Haldina cordifolia, Acacia sp., Lannea coramandelica, Mitragyma parviflora, along with Nyctanthus arbor-tristis, Carissa apaca, Dodonaea viscose and Woodfordia fruticosa. Most of the forests here have been deforested and hill ranges are completely covered with Lantana camera an exotic invasiveweed. Also scattered trees of Holoptelia integrifolia, Dalbergia sisoo, Morus nigra, etc. occur along the field bunds and other open lands. Figure 1 depicts the drainage network in Mandhala watershed.
Moolbari: Vegetation in this watershed consists of mixed deciduous (till an altitude of 1500 m) and sub-tropical pine forest (beyond 1500 m). Apart from Pinus,other species are Pyrus pashia, Rubus ellipticus, Berberis sp, and in moist localities species of Quercus leucotrichophora and Q. glauca and Rhododendron arboretum. Exposed hill slopes in pine forests have Euphorbia royleana. Between 1800-2300 m, oak forests species such as Quercus leucotrichophora, Q. glauca dominate along with Rhododendron arboretum, Lyonia ovalifolia, Persia sp., Myrica esculenta, Acer oblongum, Cedrus deodar, etc.
MeGad: This watershed lies in cold desert and comprises of temperate, sub-alpine and alpine vegetation. Temperate vegetation consists of woody trees at an altitude of 2500-3200 m such as Pinus wallichiana, Juniperus recurva, Picea smithiana, Abies pindrow, Cedrus deodara. Along the streams and irrigated canals are planted trees of Salix and Poplar sp. Sub-alpine vegetation include stunted, scattered bushes of Juniperus communis, Berberis sp., etc along with herbaceous species such as Ranunculus, Pedicularis, Potentilla, Polygonum, Geranium, Anemone, Corydalis, etc. Up to 4000 m consists Alpine Vegetation of herbaceous species such as Swertia, Silene, Potentilla, Cordalis, Taraxacum, Astralagus, Rheum, Polygonum, Artimisia, Primula etc., occur. Alpine meadows provide one of the most spectacular and colourful view. Majority of the alpine meadows are perennial in nature and perenate through rhizomes, root stocks, runners, suckers, bulbs, tubers or bulbils. Common herbaceous species here are Saxifraga, Arenaria, Aster, Polygonum, Primula, Potentilla, Selinum, Taraxicum, Astralagus, Geranium, Senecio, Saussurea, Swertia, Erigeron, Corydalis, Rheum, etc. Terrestrial orchids such as Goodyera, Malaxis, etc., are also seen here (Murti, 2001; Aswal and Mehrotra, 1994).
Figure 1: Moolberi, Mandhala and Me Gad-Lahul & Spiti watersheds, Himachalpradesh

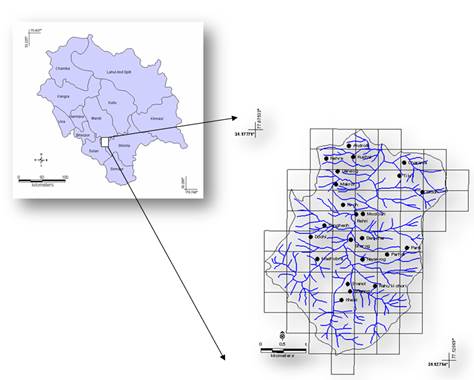
* indicates the location of villages in the watershed
Methods:
Vegetation Sampling: Systematic sampling was carried out in all three micro watersheds (Moolbari, Mandhala, and MeGad) with belt transects of 250 x 4 m. In each transect, for each tree GBH in cm (Girth at Breast Height, approximately at 130 cm above ground) and height in m is noted along with its identification. Unidentified plants were labelled and pressed in herbaria for later identification. Coordinates were marked using GPS (Global Positioning System) at every 100 metres interval and at the start and end points in each transect. Litter weight is measured in four 1 m X 1 m quadrat within each transect. Using densiometer, canopy cover is measured at start, end point and at 100 metre intervals in each transect. Also, relative humidity and air temperature was taken at every 100 m and at the start and end of the transect.
Faunal Sampling: Focus of faunal studies are on bioindicator taxa such as butterflies, amphibians and birds.
Butteflies: In selected localities, transect based sampling (250x4 m) as well as opportunistic sampling of butterflies was carried out. Most of the butterflies were identified in the field and others were photographed and identified later with the available keys (Evans, 1932; Wynter-Blyth, 1940-1946, 1957; Erhardt, 1985; Thomas and Malorie, 1985; Mani, 1986; Leps and Spitzer, 1990; New 1991; Scoble, 1992; Wood and Samways, 1992; Kim, 1993; Pollard and Yates, 1993; Samways, 1994; New et al., 1995; Molina and Palma, 1996; Parmesan, 1996; Swengel, 1996; Blair and Launer, 1997; Spitzer et al., 1997; Manel, et al., 1999; Stork et al., 2003; Arora, et. Al., 2005). The data was analyzed (Table 2) to calculate species diversity (using Shannon-Weiner diversity index), importance value index (IVI), etc. (Ramachandra et al., 2007)
Amphibian: Amphibians are highly seasonal and majority of them breed during monsoon. Hence, field work was carried out and identified amphibians during July-August 2007 in major land-use categories like waterbodies (streams of 1° and 2°), forests, agriculture fields, and open area between 19:00-21:00 h. We have invested 2 man-hour searches on each night. Number of individuals, sampling co-ordinates and habitat characteristics were also noted (Gaston, et al., 1983; Kremen, 1992; Manel, et al., 1999; Mehta, 2005a,b; Beebee and Griffiths, 2005).
Birds: Time constrained sampling of 1 hour in each habitat types during morning and evening was carried out and cataloged using standard keys (Ali, 1989; Grimmet, et al., 1998; Laiolo, 2003; Manel, et al., 1999). The co-ordinates were taken at the start and end point of transects using GPS and species alongwith their numbers were also recorded
Table 2: Indices computed to assess the biodiversity status
Index |
Equation |
Remarks |
Density |
Number of species A
-------------------------
Area sampled (m2) |
Compactness with which a species exists in an area. |
Relative Density |
Density of species A x 100
------------------------------------
Total density of all species |
|
Dominance |
Basal area of species A
-------------------------------
Area sampled (m2) |
The occupancy of a species over an area |
Relative dominance |
Dominance of species A x 100
-----------------------------------------
Total dominance of all species |
|
Frequency |
Number of quadrats with species A
--------------------------------------------
Total number of quadrats sampled |
The repeated occurrence of a species |
Relative Frequency |
Frequency of species A x 100
-------------------------------------
Total frequency of all species |
|
Important Value Index (IVI) |
R. density + R. frequency + R. basal area |
Abundance |
Number of individuals of a species x 100
--------------------------------------------------
Number of sampling units |
Numerical species Richness |
S-1
------
log N |
S= Number of species
N= Number of Individuals |
Simpson Diversity index |
∑ni (ni-1)
-----------
N(N-1) |
Ni= Number of individuals in each species
N= Total number of individuals |
Simpson dominance index |
Dominence = ∑(ni/N)2 |
|
Shannon Weiner’s Index |
H’ = -∑Piln Pi |
Pi= ni/N |
Pielou’s evenness measure |
E=H’/log S |
H’= Shannon-Weiner’s index
S= Number of species |
| * Corresponding Author : |
| |
Dr. T.V. Ramachandra
Energy & Wetlands Research Group, Centre for Ecological Sciences, Indian Institute of Science, Bangalore – 560 012, INDIA. |
|
Tel : 91-80-23600985 / 22932506 / 22933099,
Fax : 91-80-23601428 / 23600085 / 23600683 [CES-TVR]
E-mail :
cestvr@ces.iisc.ac.in, energy@ces.iisc.ac.in
Web : http://ces.iisc.ac.in/energy. |