|
ENVIS Technical Report 91, April 2015 |
ENVIRONMENTAL FLOW ASSESSMENT IN YETTINAHOLE:
WHERE IS 24 TMC TO DIVERT?
|
T.V. Ramachandra1,2,3 Vinay S1 Bharath H.Aithal1,2 |
1Energy & Wetlands Research Group, Centre for Ecological Sciences,
2Centre for Sustainable Technologies (astra),
3Centre for infrastructure, Sustainable Transportation and Urban Planning [CiSTUP],
Indian Institute of Science, Bangalore, Karnataka, 560 012, India.
E Mail: cestvr@ces.iisc.ernet.in; vinay@ces.iisc.ernet.in; bharath@ces.iisc.ernet.in,
Tel: 91-080-22933099, 2293 3503 extn 101, 107, 113
|
|
Results
Land use analysis: Land use analysis was carried out using remote sensing data of 2013, and results are given in figure 17 and table 11. Major portion of the catchment is covered with evergreen forest (45.08%) followed by agriculture plantations (29.05%) and grass lands (24.06%). The valleys along the stream are dominated by agriculture lands and horticulture plantations, the hill tops dominated by grass lands, slopes covered with forest cover. The accuracy of the land use classification is 87% with kappa of 0.82.
Table 11: Land use in Yettinaholé catchment
Land use |
Area (%) |
Built up |
0.07 |
Agriculture Plantation |
29.25 |
Evergreen |
45.08 |
Forest Plantation |
0.001 |
Water |
0.002 |
Open land |
0.91 |
Agriculture |
0.62 |
Grassland |
24.06 |

Figure 17: Land use in Yettinaholé catchment


Yettinaholé is a tributary of Gundia river. Temporal land use in the Gundia river catchment during 2000, 2006, 2010 and 2014 are depicted in Figure 18 and details are provided in table.12. Results reveal that area under forests has reduced from 70.74% (in 2000) to 61.15% (in 2014).
Variability of rainfall was assessed based on 11 rain gauge stations in the catchment and is given in Figure 19. Month-wise rainfall variations are depicted in Figure 20. The region receives annual rainfall ranging from 3000 mm to 4500 mm.


![]](f31.png)
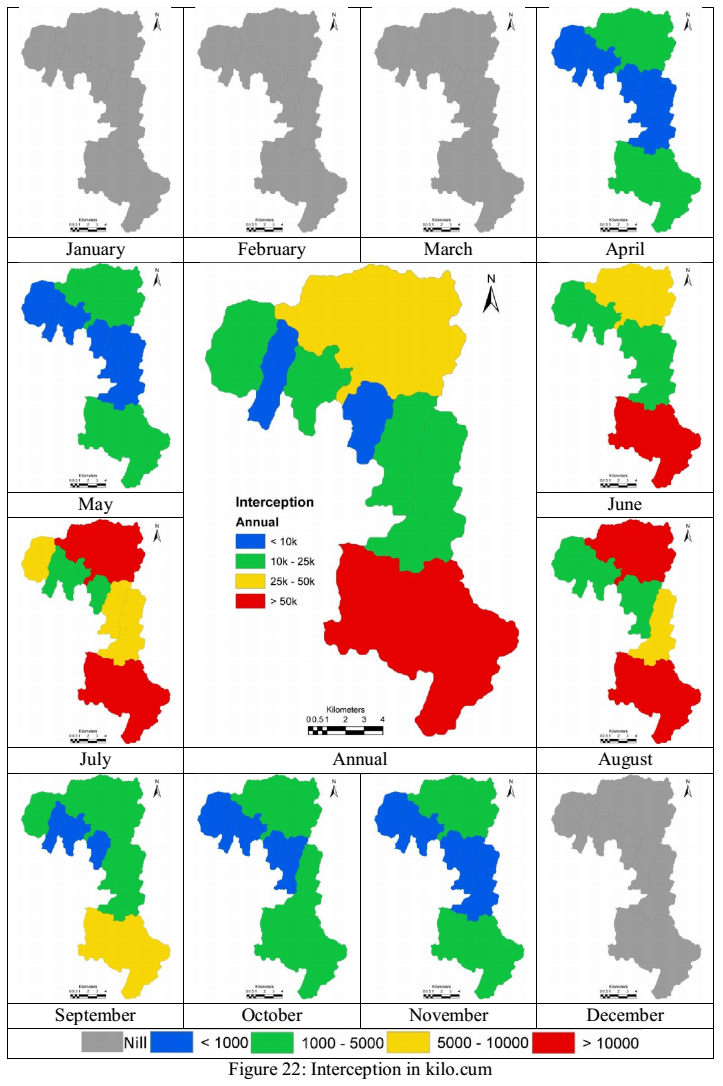
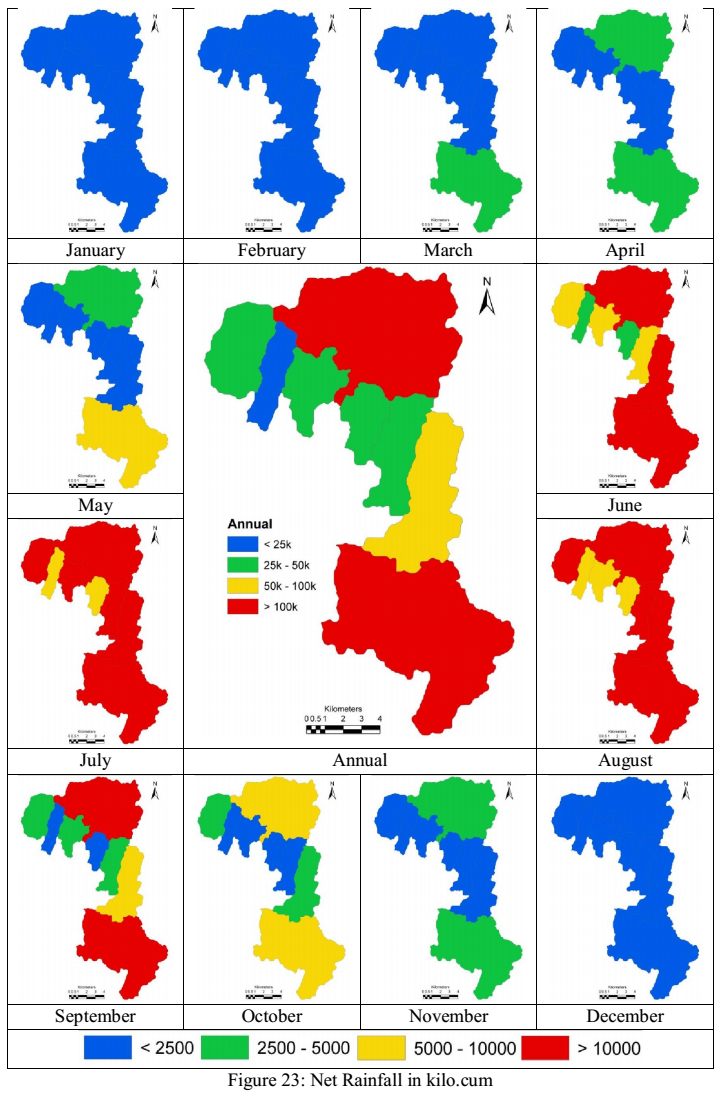
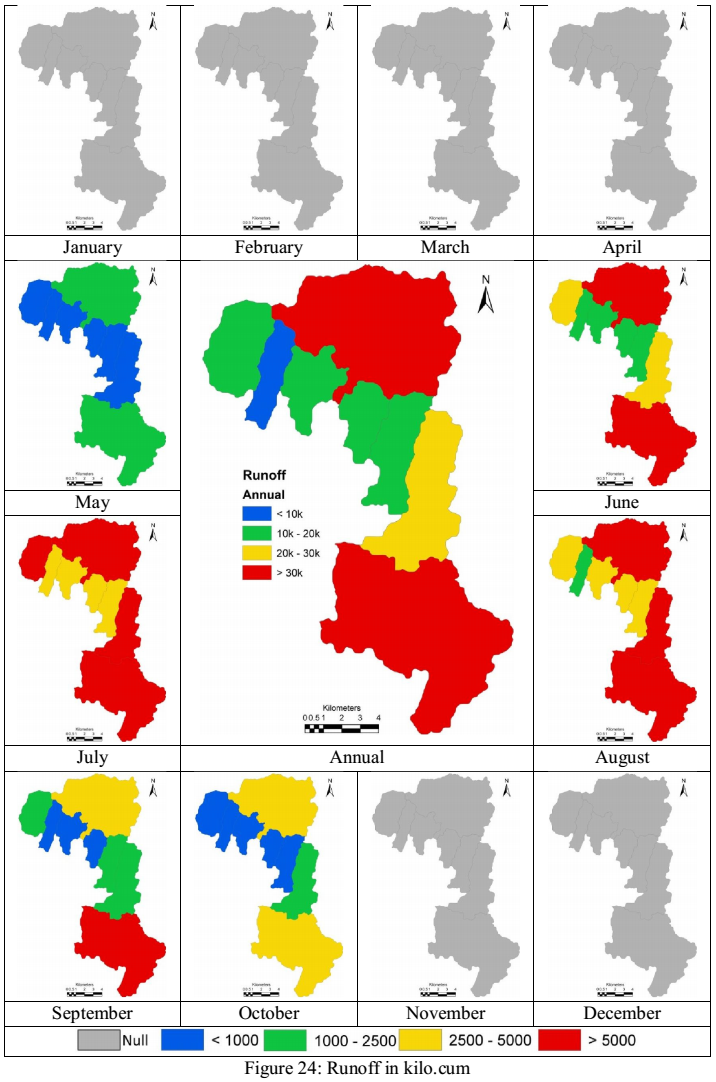
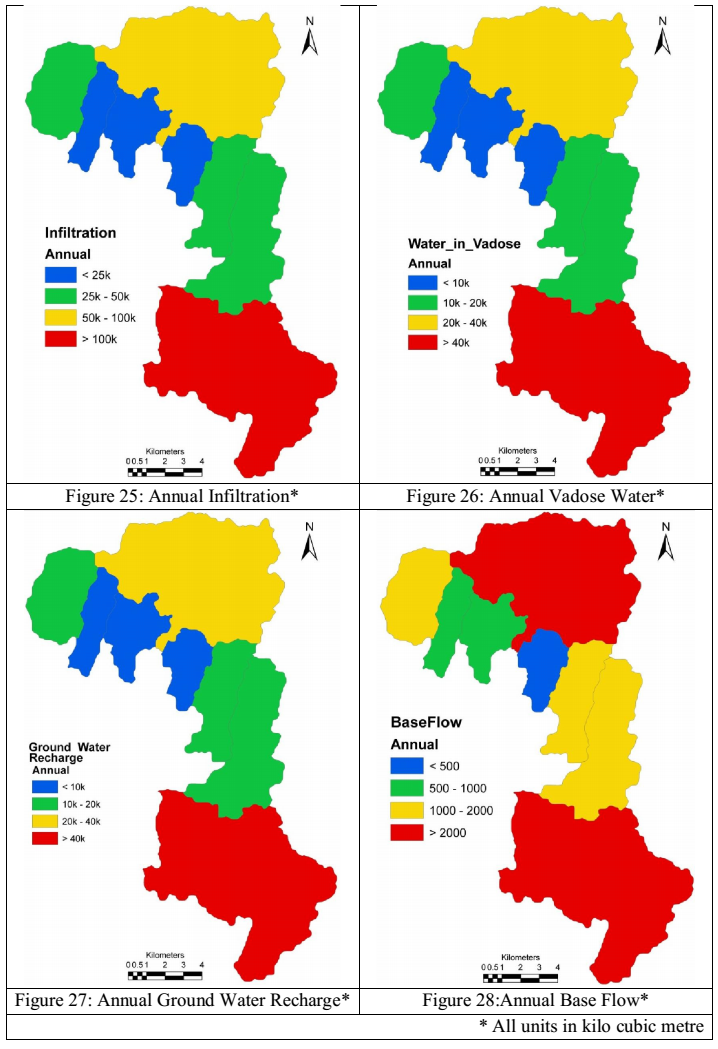
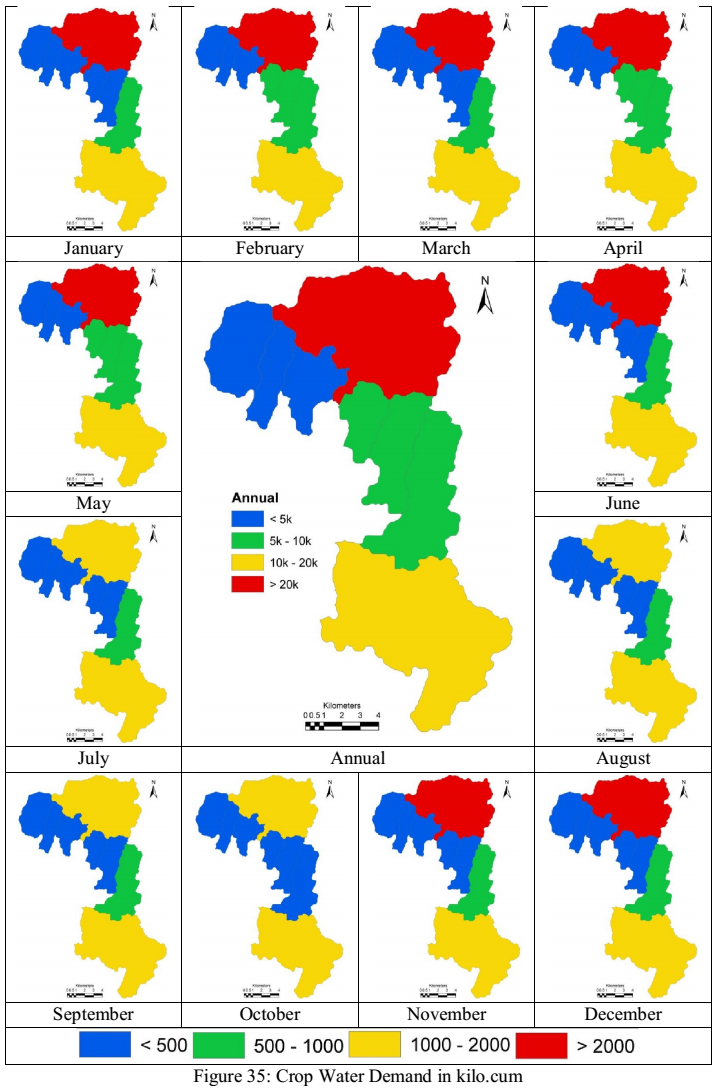
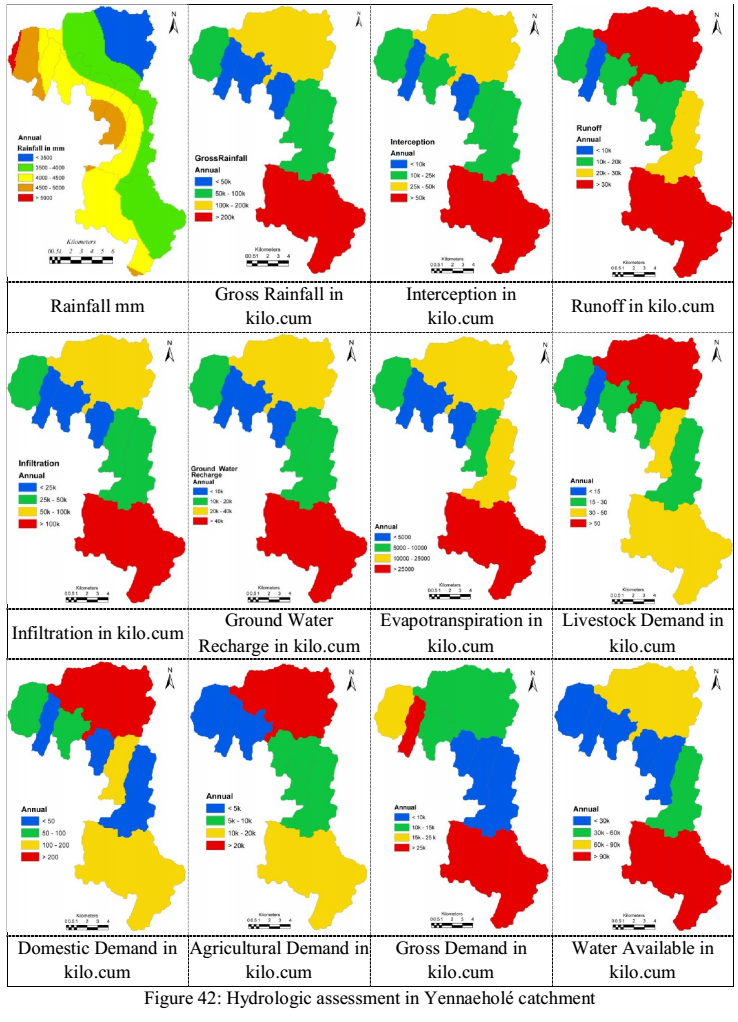
Figure 21 to Figure 41 describes monthly variability of hydrological parameters for understanding the hydrological regime. Gross rainfall (Figure 21), estimated as product of catchment area and rainfall. The gross rainfall varies from 33232 kilo.cum (in Kadumane holé 2 and Yettina holé 2) and over 2000000 kilo.cum (in Yettina holé and Hongada halla catchments). Portion of the water doesn’t reach the earth surface, but is intercepted by the earth features namely the tree canopy, building tops, pavements etc. (Figure 22), which contributes to evaporation. In regions where monthly rainfall less than 50 mm, interception losses are assumed to be zero, and is accounted directly in the evapotranspiration estimates. Net rainfall was estimated for each of the sub catchments is given in Figure 23, accounting the interception losses. Runoff (Figure 24) in the basin is estimated as a function of catchment characteristics along with rainfall. Yettin holé, catchment is covered predominantly by evergreen forests, has aided in recharging groundwater zone (Figure 25) and sub surfaces (Figure 26). Infiltration of significant amount of precipitation to underlying layers, has reduced the overland flow and thus retarded the flash floods. The infiltration of water to sub-surface takes place during monsoon, and overland flow (surface runoff) happens during the monsoon (rainfall > 50 mm per month) and quantity depends on the catchment characteristics namely land use / land cover in the catchment, soil porosity, texture, presence of organic matter (leave debris, decayed matter etc.). The portion of water percolates through the sub surfaces and thus recharges ground water resources (Figure 27). Water stored in vadoze zone (sub-surface) moves laterally (Figure 28) to streams with cessation of rain. Forests in the catchment have played a prominent role in maintaining stream flow, water holding capacity of soil, ground water discharge (base flow), which also plays a pivotal role in catering the ecological and environmental demand of water. Sub basin wise yields are listed in table 13; the surface runoff during the monsoon is estimated to be 9.55 TMC.
Table 13: Catchment yield
Sub basin |
Average Annual Rainfall mm |
Gross Rainfall TMC |
Runoff yield as TMC |
Yettina holé |
3539.73 |
5.98 |
2.62 |
Yettina holé T2 |
4311.44 |
1.23 |
0.58 |
Yettina holé T1 |
4109.99 |
1.33 |
0.57 |
Kadumane holé 2 |
4364.85 |
1.20 |
0.53 |
Kadumane holé 1 |
4725.54 |
1.79 |
0.70 |
Keri holé |
4000.77 |
6.70 |
2.68 |
Hongadahalla |
4013.09 |
2.69 |
1.17 |
Yettina holé lower reach |
4385.25 |
1.81 |
0.69 |
GROSS Yield (TMC) |
|
9.55 |
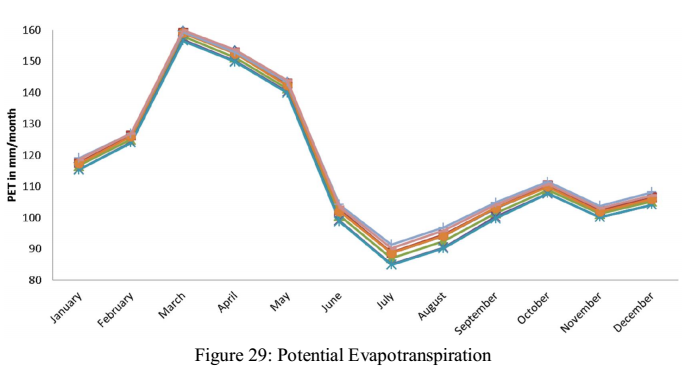
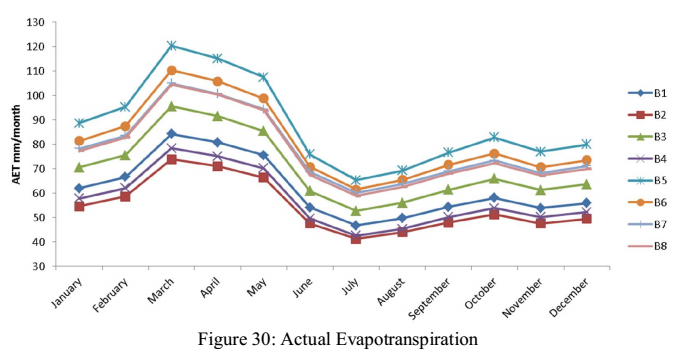
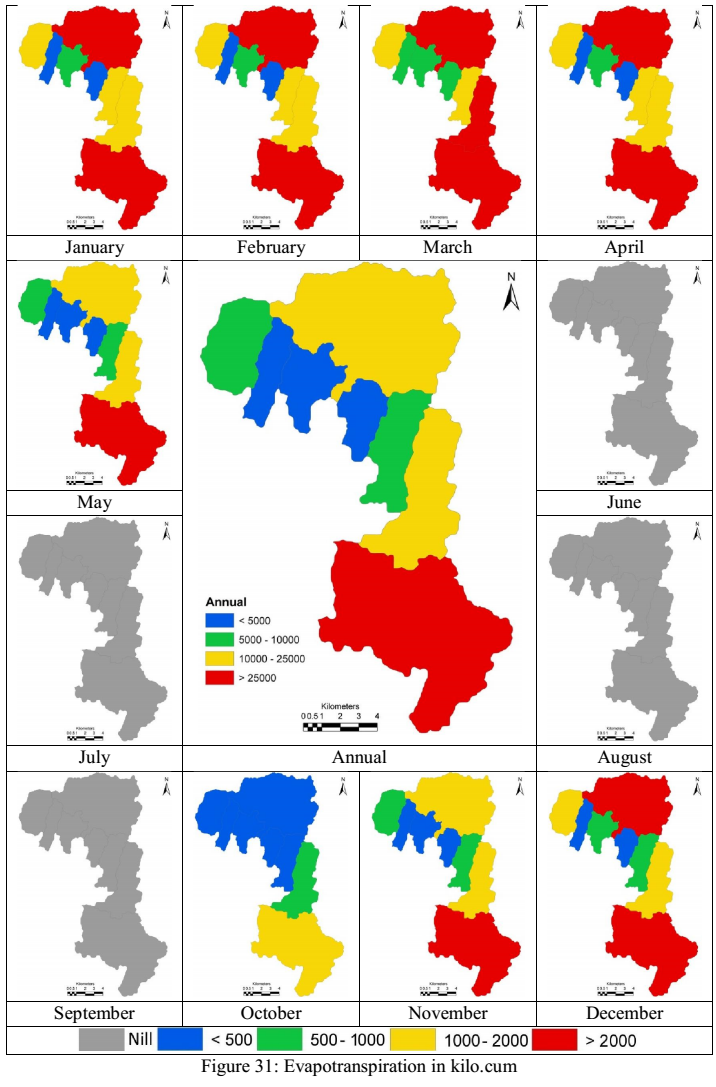
Evapotranspiration in the catchment depends on the land use, solar radiation, variations in temperature, precipitation, etc. Potential evapotranspiration (Figure 29) was estimated using Hargreaves method. PET indicates the maximum possible water that can evaporate, PET varies between 160 mm/month (March) to 85 mm/month (monsoon season). Considering the various land use characteristics in the catchments, actual evapotranspiration (Figure 30) was estimated in the catchments show variation of 40mm/month (monsoon) to 120mm/month (March). Considering the interception losses, net evaporation (Figure 31) was computed as a difference between actual and interception, which highlights that intercepted water, takes care of evaporation during monsoon. Similarly, evaporation from the crops (horticulture and agriculture) is also accounted.
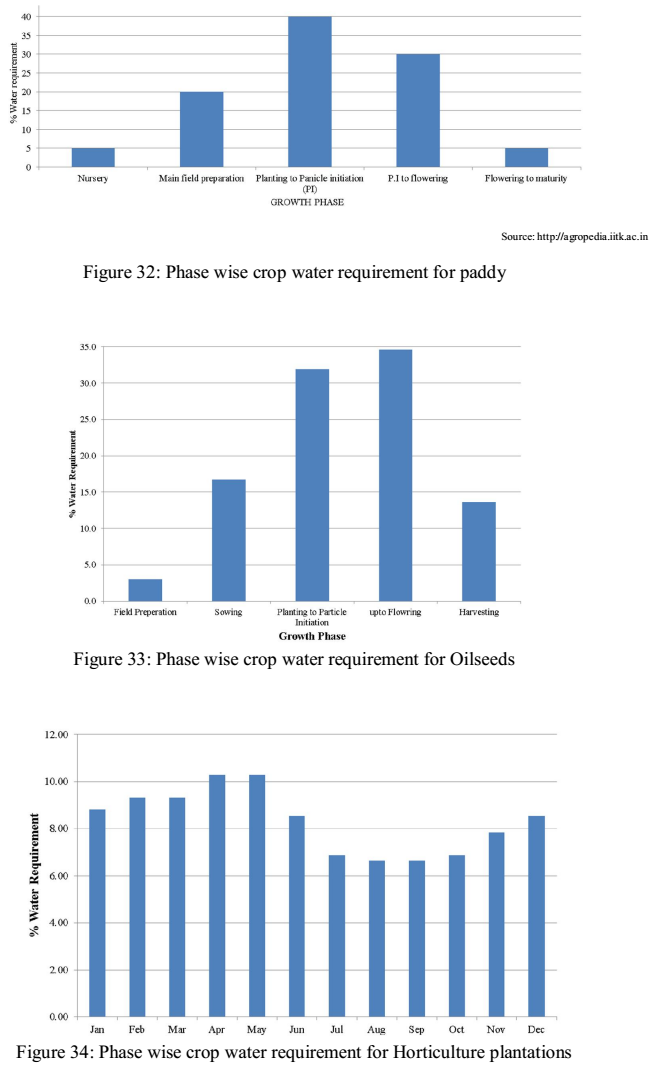
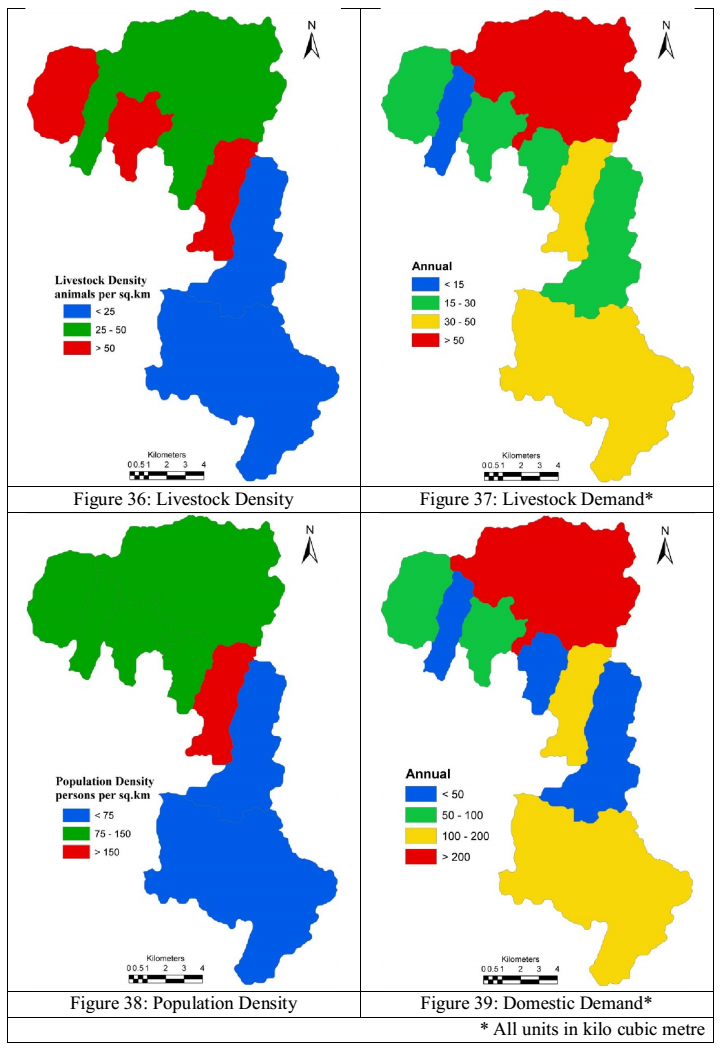
Crop water demand (Figure 35) was calculated for each catchment based on cropping pattern, area under each crop, and water required across the growth phases of the crops, which were compiled from various literatures (local, national and international) public opinions, practices and experiences. Table11 and Figure 32 - 35, details season-wise crop water requirements and growth phases. The agricultural water demand of 2.6 TMC in the catchments is due to the horticultural and paddy cultivation. Livestock water demand given in Table 10 (Figure 37) was estimated based on the livestock population (Figure 36) compiled from District at a glance of Hassan (2012-13).
Census data for the year 2001 and 2011 with the decadal rate of change in population was used compute the population for 2014. Catchment had a population of 17005 (in 2001), which decreased to 16345 (in 2011) at a decadal decline of 3.88%. Population for the year 2014 was estimated as 16156 persons. The population density (Figure 38) in the catchments varies from 33 persons per sq.km (in Keriholé) to about 150 persons per sq.km holé (Yettinaholé lower reach). Overall population density in the catchment is about 89 persons per sq.km. Based on the population and seasonality, monthly water demand was computed for each of catchments and is given in Figure 39.
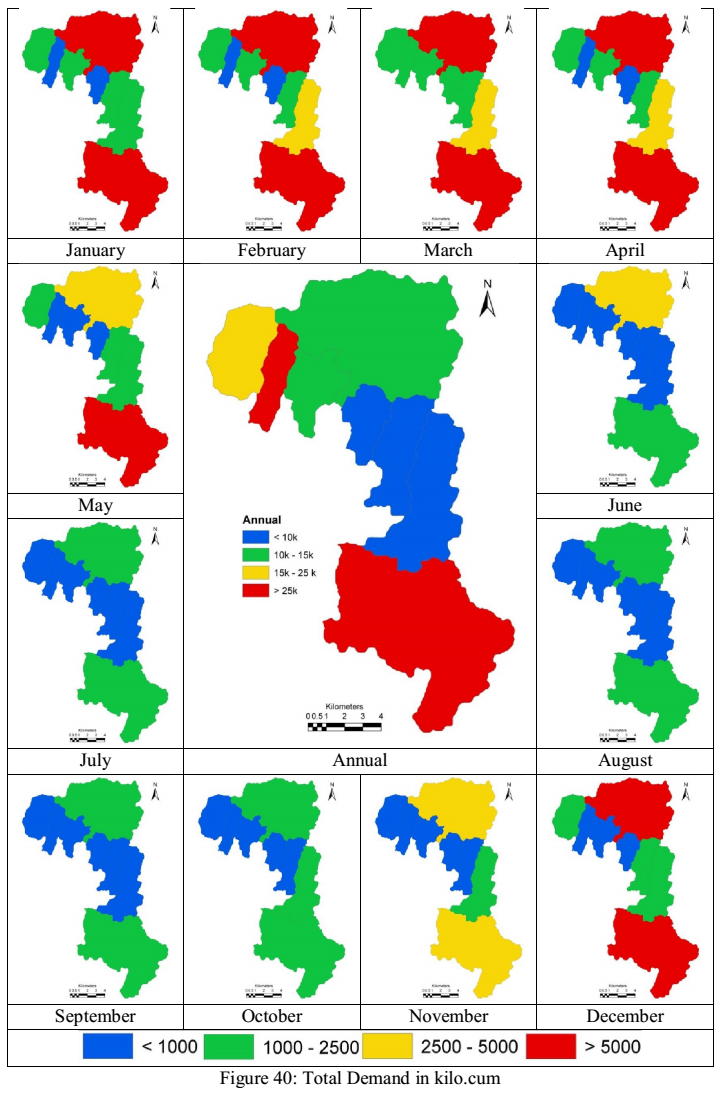
Total demand (5.84 TMC of water) across the catchments was obtained as a function of evaporation, livestock, and domestic and agriculture demands and is depicted in Figure 40. Availability of water in the catchment was assessed as a function of runoff, water in vadose, base flow, etc. and are depicted in Figure 41.
The assessment showed that the currently available water is sufficient only to cater existing water demand (social, ecological and environmental) throughout the year and most streams in the forested catchment are perennial. The summary of the hydrological analysis are as described in table 14 and in Figure 42.
Table 14: Hydrological findings in the catchment
Description |
Quantity |
Gross Area |
179.68 sq.km |
Average Annual Rainfall |
3500 – 4500 mm |
Water Yield in the catchment |
268828 kilo.cum (9.55 TMC) |
Ground Water Recharge |
13745.4 kilo.cum (0.49 TMC) |
Evapotranspiration |
89053.1 kilo.cum (3.16 TMC) |
Irrigation Water Requirement |
74372.5 kilo.cum (2.64 TMC) |
Domestic Water Requirement |
795.6 kilo.cum (0.03 TMC) |
Livestock Water Requirement |
258.7 kilo.cum (0.01 TMC) |
Total Water Demand |
164479.9 kilo.cum (5.84 TMC) |
* Conversion of Units, kilo.cum to TMC
Note: 1 ft = 0.3048m, 1cft = 0.028317 cum,
1 TMC = 1 Thousand Million Cubic feet (1000000000 cft), 1TMC = 28316847 cum, 1TMC = 28316.847 kilo.cum, 164479.9 kilo.cum = 5.84 TMC
TMC (is one thousand million cubic feet) is a term used by the British to quantify water supply. It is roughly equal to 30 million cubic metres of water.
.
|
Dr. T.V. Ramachandra
Centre for Sustainable Technologies, Centre for infrastructure, Sustainable Transportation and Urban Planning (CiSTUP), Energy & Wetlands Research Group, Centre for Ecological Sciences, Indian Institute of Science, Bangalore – 560 012, INDIA.
E-mail : cestvr@ces.iisc.ernet.in
Tel: 91-080-22933099/23600985,
Fax: 91-080-23601428/23600085
Web: http://ces.iisc.ernet.in/energy
Vinay .SEnergy & Wetlands Research Group, Centre for Ecological Sciences, Indian Institute of Science, Bangalore – 560 012, INDIA.
E-mail: vinay@ces.iisc.ernet.in
Bharath H. AithalEnergy & Wetlands Research Group, Centre for Ecological Sciences, Indian Institute of Science, Bangalore – 560 012, INDIA.
E-mail: bharath@ces.iisc.ernet.in
Citation: Ramachandra T.V., Vinay S and Bharath H. Aithal, 2015. Environmental Flow Assessment in Yettinaholé, Sahyadri Conservation Series 48, ENVIS Technical Report 91, EWRG, CES, Indian Institute of Science, Bangalore 560012, India.
Contact Address : |
|
Dr. T.V. Ramachandra
Energy & Wetlands Research Group,
Centre for Ecological Sciences, TE 15, New Biology Building, Third Floor, E Wing, [Near D Gate], Indian Institute of Science, Bangalore – 560 012, INDIA.
Tel : 91-80-22933099 / 22933503-extn 107
Fax : 91-80-23601428 / 23600085 / 23600683 [CES-TVR]
E-mail : cestvr@ces.iisc.ernet.in, energy@ces.iisc.ernet.in,
Web : http://wgbis.ces.iisc.ernet.in/energy |
|