 |
Sankey Lake: waiting for an Immediate Sensible Action
| 
|
| T.V. Ramachandra* |
Asulabha .K S |
Sincy .V. |
Vinay .S |
Sudarshan p. Bhat |
Bharath H. Aithal
|
|
|
FOUL ODOUR IN SANKEY LAKE: CAUSAL FACTORS AND REMEDIAL
Status |
Contaminated water, sediment and air |
Cause |
- Sustained inflow of untreated or partially treated sewage;
- Encroachment of lakebed, flood plains, and lake itself;
- Loss in lake interconnectivity - Encroachment of rajakaluves / storm water drains and loss of interconnectivity;
- Lake reclamation for infrastructure activities;
- Topography alterations in lake catchment;
- Removal of shoreline riparian vegetation; and unabated construction activities in the valley zone has threatened these urban wetlands.
- Pollution due to enhanced vehicular traffic;
- Too many para-state agencies and lack of co-ordination among them.
- Too many para-state agencies and too less governance
|
Solution |
- Good governance (too many para-state agencies and lack of co-ordination)
- Single agency with the statutory and financial autonomy to be the custodian of natural resources (ownership, regular maintenance and action against polluters (encroachers as well as those contaminate through untreated sewage and effluents, dumping of solid wastes)
- Digitation of land records (especially common lands – lakes, open spaces, parks, etc.) and availability of this geo-referenced data with query based information system to public.
- Removal of encroachment near to lakes after the survey based on reliable cadastral maps;
- Effective judicial system for speedy disposal of conflicts related to encroachment;
- To make land grabbing cognizable non-bail offence;
- Letting off only treated sewage into the lake (as in jakkur lake model);
- Regular removal of macrophytes in the lakes;
- Implementation of ‘polluter pays’ principle as per water act 1974;
- Plant native species of macrophytes in open spaces of lake catchment area;
- Aeration will help in maintaining high dissolved oxygen levels and likely reduction in toxic effect.
- Stop solid wastes dumping into lakes; Ensure proper fencing of lakes;
- Complete ban on construction activities in the valley zones.
- Regular monitoring of the lake for assessing its water quality and for taking precautionary measures.
- Avoid entry of sewage into the lake, which brings in excess nutrients that induces profuse algal growth.
- Leave only treated sewage through construction wetlands and algal ponds (to remove nutrients)
- Removal of sediments accumulated over a period, which is rich in the phosphorus (P), nitrogen (N) and carbon (C).
- The harvesting and removal of cyanobacterial biomass during the early morning (when the algal scum is concentrated and at the top layer of water) through fine pore nets and pumping of the concentrated scums.
- Introduction of Herbivorous fishes like silver carp (Hypophthalmichthys molitrix) and bighead carp (Aristichthys nobilis).
- Avoid sewage entry, throwing of solid wastes to the lake and frequent fish feeding by the local people.
- Ensure proper evaluation of inflow to the lake and proper maintenance of outflow.
- Public awareness and public participation is necessary.
|
The restoration and conservation strategies has to be implemented for maintaining the ecological health of aquatic ecosystems, aquatic biodiversity in the region, inter-connectivity among lakes, preserve its physical integrity (shorelines, banks and bottom configurations) and water quality to support healthy riparian, aquatic and wetland ecosystems. The regular monitoring of water bodies and public awareness will help in developing appropriate conservation and management strategies. |
SUMMARY
Mitigation of deterioration of aquatic ecosystems integrity requires regular monitoring of the physico-chemical and biological characteristics of fresh water bodies, which helps in evolving appropriate management strategies. Physico-chemical parameters of Sankey lake in Bangalore District, Karnataka, India monitored since December, 2012. The various water quality parameters analyzed were water temperature, pH, electrical conductivity, total dissolved solids, dissolved oxygen, nitrate, orthophosphate, total alkalinity, calcium and magnesium hardness, total hardness, chloride, chemical oxygen demand, sodium and potassium. Algae being the primary producers play an important role in aquatic ecosystems and aid as indicators of water pollution. The distribution and diversity of algae in a water body are dependent on the its integrity based on physical and chemical factors. The entry of sewage into Sankey lake had raised its nutrient levels. Three algal species belonging to Cyanophyceae, Chlorophyceae and Bacillariophyceae were found in Sankey lake. Though Cyanophycean members dominated throughout the study period, Chlorophycean members represented the most diverse group. Excessive growth of toxin producing Microcystis sp. and Planktothrix sp. were evident, which had suppressed the growth of other algal groups. The algal species like Microcystis sp., Planktothrix sp., Chlorella sp., Scenedesmus sp., and Nitzschia sp. are indicators of organic pollution. In order to understand the factors affecting the massive growth of Cyanophyceae in Sankey lake. Multivariate statistical technique PCA and CCA , reveal that COD, DO, sodium and potassium influenced the growth of Cyanophyceae. The massive growth of Cyanophyceae inhibited the growth of other algal genera. In order to avoid this profuse algal growth and to ensure a healthy aquatic ecosystem, effective and most appropriate control measures have to be taken. The taste and odour problems and fish death in Sankey lake can be tackled only by adopting measures for the efficient removal of cyanobacteria from the lake. Aeration of Sankey lake and letting only treated sewage would minimize the instances of cyanobacteria bloom.
Keywords: Physico-chemical parameters, Microcystis, PCA, CCA, control measures.
INTRODUCTION
Wetlands: Bangalore Scenario: Wetlands are diverse and highly productive ecosystems providing array of goods and services to millions of people, either directly or indirectly. Wetlands function as ecotones, i.e., transitions between different habitats and have characteristics of both aquatic and terrestrial ecosystems, supporting diverse flora and fauna. Wetlands include habitats partially submerged by water like marshes, swamps, ponds, lakes, reservoirs etc. (Ramachandra, 2005). The differences in wetland characteristics may be due to regional and local variations in climate, soil type, topography, hydrology, water chemistry, vegetation and other factors. The depth and duration of inundation differs greatly among wetlands and varies yearly within a single wetland type (Ramachandra and Rajinikanth, 2005).
In case of Bangalore, wetlands occupy about 4.8% of the geographical area (640 sq km) which covers both urban and non-urban areas. Bangalore has no natural wetlands but possess many man-made wetlands that were built for various hydrological purposes as well as for irrigation in agricultural lands (Ramachandra, 2001). The anthropogenic activities to a large extent impairs ecosystem functioning by bringing about changes in the physical, chemical and biological entities of aquatic ecosystems, causing a decline or degradation of ecosystem services and also loss of economic value of wetlands (Ramachandra et al., 2011). The temporal analysis of wetlands indicated a sharp decline of 58% in Greater Bangalore due to intense urbanization which was evident from a 466% increase in the built-up area of Greater Bangalore from 1973 to 2007 (Ramachandra and Kumar, 2008). Recent studies reveal 925% increase in built-up with 79% decline in water bodies and 78% decline in vegetation. About 54% of lakes were unauthorized encroached for illegal buildings. According to the field surveys (held during July - August 2007), nearly 66 % of lakes were sewage fed, 14 % surrounded by slums and 72% of lakes showed loss of catchment area. The lake catchments had become dumping yards for either municipal solid waste or building debris (Ramachandra, 2010).
Need for conservation of Aquatic ecosystems: Wetlands (lakes) are very complex and dynamic ecosystems that interact with the environment and connected to the hydrological cycle through both the inflows and outflows from surface and underground layers, as well as via evaporation or precipitation fluxes. These interactions with the local environment also include chemical constituents and mineral phases, transported from the catchment area to the lake. Thus, the lake experiences either an outflow of water or accumulation in the lake sediments (Mook, 2001).
Lake ecosystems, being the most productive ecosystems in the biosphere play a significant role in the ecological sustainability of the region. These habitats are of great human importance as they provide the essential components for the sustenance of life on earth, such as water (agriculture, drinking, etc.), food (protein production, fodder, etc), biodiversity (diverse flora and fauna), energy (fuel wood, etc), recreation (tourism), transport, water purification, pollutant sink, flood control and climate stabilizers (Ramachandra et al., 2003). Lakes and tanks also acts as sediment traps and prevent clogging up of natural valleys and reduce erosion by regulating run off (Sivakumar and Karuppasamy, 2008). Biological (biomass, population numbers and growth) characteristics of lakes depend on their physical (intensity of light, temperature and water currents), chemical (composition of nutrients, major ions and contaminants) characteristics (Ramachandra and Ahalya, 2001). The environmental impacts on wetlands are loss of wetland area, changes to water regime, changes in water quality, overexploitation of wetland products and introduction of exotic or alien species. The variations in quality and quantity of water have contributed to a decline in the biological diversity of flora and fauna, migratory birds, and productivity of wetland ecosystems. The improper management of point sources of pollution (such as letting untreated sewage and effluents) has lead to problems of pollution, eutrophication, invasion of exotic species and toxic contamination by heavy metals, pesticides and organic compounds (Ramachandra, 2001). The pressure of population growth and the need to satisfy human demand for water, food and energy had resulted in intensive exploitation of wetland (Karthick and Ramachandra, 2006). In order to regain and protect the physical, chemical and biological integrity of wetland ecosystems, implementation of appropriate management and restoration mechanisms are necessary. The management of wetlands requires an intense and periodic wetland monitoring, increased interaction and co-operation among the various para-state agencies (Ramachandra, 2001; Ramachandra, 2009a). The key recommendations for the better conservation and sustainable management of urban wetlands are:
- Mapping of water-bodies
- Demarcation of the boundary of water bodies
- Carrying capacity studies for all macro cities
- Holistic and integrated approaches – conservation and management
- Documentation of biodiversity
- Preparation of management plans for individual water bodies
- Implementation of sanitation facilities
- Management of polluted lakes
- Restoration of lakes
- Valuation of goods and services
- Regulation of boating
- Protection of riparian and buffer zone vegetation
- Restoration of linkages between water bodies
- Rainwater harvesting
- Protection of sacred grove-water body system
- Environment Education
- Adopt Inter-disciplinary Approach
SANKEY LAKE: A CASE STUDY:
Sankey Lake is an artificial tank or lake, built by Col. Richard Hieram Sankey of the Madras Sappers Regiment in the western part of Bangalore city, Karnataka in the year 1882, to meet the water supply demands of Bangalore. It is located closely to the middle of the suburbs of Vyalikaval, Malleshwaram and Sadashivanagar. The lake covers a total area of about 42.76 acres of land and catchment area of 1.254 km (0.8 mile) with one island within its premise. At its widest, the lake has a width of 800 m (2,624.7 ft) and a maximum depth of 9.26 m (30.4 ft). The Sankey Lake was earlier known as Gandhadhakotikere since the Government Sandalwood Depot is located close to the lake (Ravikumar et al., 2013). Bangalore Water Supply and Sewerage Board (BWSSB) and Bruhut Bengaluru Mahanagara Palike (BBMP) had now changed Sankey Lake from a reservoir to a park. Sankey Lake also includes a park and a swimming pool toward its south, along with a Forest Department nursery in the northern direction and an exclusive tank for idol immersion during Ganesh Chaturthi festival (Ravikumar et al., 2013). The importance of Sankey Lake lies in maintaining the ground water level in its surrounding areas, that includes Malleswaram, Palace Orchards, Rajamahal Vilas, Vyalikaval, Palace Guttahalli and Yeshwanthpur. The study of morphology, hydrodynamics and sedimentation of the lake showed that the water percolating through the soil is not lost but helps in recharging the natural underground reservoir, which in turn, supplies water to the wells and bore wells in the nearby areas. This lake has great fish potential, supports human needs and contributes to climatic stability. It harbors a rich biodiversity that includes aquatic plants, birds, fishes, and microbes (Benjamin et al., 1996).
The Sankey Lake is a perfect example for a stagnant water bodywith more complex and fragile ecosystems compared to running water bodies as they lack self-cleaning ability (Patel and Patel, 2012). The contamination of water in Sankey Lake accounts to sewage inflow from seven points that are connected to storm water drains, choking of drains with sewage and garbage and also leakage of sewage pipes connected to the toilet at park area. These contaminants degrade the quality of water and in turn affect the aquatic life (Ravikumar et al., 2013). Water bodies get enriched with nutrients when, partially treated or untreated sewage enters the lakes, resulting in obnoxious algal blooms (Mahapatra et al., 2012). This brings about variations in different physico-chemical and biological characteristics of water bodies.
Nutrient enrichment affects water quality and phytoplankton growth: The water quality, especially the nutrients influence the abundance and diversity of phytoplankton. The physico-chemical characteristics play an important role in the assessment of water quality and trophic status of a water body. The phytoplankton survey also indicates the trophic status and the presence of organic matter in the ecosystem (Ramachandra and Solanki, 2007). Cyanobacterial dominance in lakes is an increasing problem that affects ecosystem integrity, recreation, human and animal health (Downing et al., 2001). Cyanobacteria, also known as blue-green algae includes single-celled algae that proliferate in water bodies such as ponds, lakes, reservoirs, and slow-moving streams when the water is warm and essential nutrients are available (Butler et al., 2009). A number of environmental factors influence the growth of cyanobacteria cells. These include quality and quantity of light, temperature, pH, nutrient conditions, such as nitrate and phosphate levels, dissolved oxygen, iron concentration and the salinity of the surrounding environment (Sember, 2002). The excessive growth/bloom formation of cyanobacteria persists in water bodies that contain adequate levels of essential inorganic nutrients such as nitrogen and phosphorus and increased levels of organic matter. Other important physical factors that determine the sensitivity of aquatic ecosystems to nutrient impacts are water residence time, temperature, mixing rates and turbidity (Sember, 2002).
Taste and odour problems in lakes: The primary sources of taste and odor problems in drinking water are algae and bacteria. Taste and odour (T&O) problems due to the release of several odorous compounds (above the threshold level) are frequently recorded during cyanobacterial bloom in natural waters. There are four basic taste types: sour, sweet, salty and bitter. The environmental factors such as nutrient concentrations, water clarity, water temperature and pH favor cyanobacterial blooms and thus, trigger T&O emissions. These odorous compounds can affect water supplies, decrease the aesthetic quality and consumer acceptability of drinking water, and increase the costs of water treatment. This necessitates the identification and quantification of these odorous compounds (Ma et al., 2013). The earthy and musty odours generated by Geosmin (trans-1, 10-dimethyl-trans-9-decalol) and MIB (2-methylisoborneol) are common odorous chemicals. Actinomycetes and cyanobacteria produce geosmin and MIB. Green algae blooms produce a grassy or fishy odor. Golden-brown algae (Synura sp.) can produce a cucumber, melon, or fishy odor. Biological activity in surface waters can produce 2,4-heptadienal and decadienal, which have a fishy, rancid odour. In addition, dissolved metals such as zinc, manganese, copper, and iron can produce a metallic taste. Other odorous sulfur compounds produced from blue-green algae blooms are methyl mercaptan, dimethyl sulfide, isobutyl mercaptan, and n-butyl mercaptan. Decaying vegetation (of algae, leaves, and aquatic weeds) is another source of odour in lakes. Bacterial activities in relation to mineral matter are the chief causes of tastes and odours. Iron bacteria are responsible for tastes and odours in groundwater as well as in water supplies. Sulfate-reducing bacteria are responsible for the production of odoriferous compounds, namely hydrogen sulfide (emits a rotten egg odour). Microcrustacea can produce intense fishy tastes and odours in small reservoirs. Daphnia, Ceratium, Condonella and Anurea when, in large numbers may impart a fishy odour to water (Lin, 1977). The odours produced by organic compounds from the wastes of industries, cities, and agricultural activities affects public water supplies, food chain, and causes off-flavours in fish flesh, and is toxic to fish and causes taste and odour problems (Lin, 1977). The decay of cyanobacterial blooms causes an anoxic water condition, increases nutrient loading and releases higher concentrations of volatile organic sulfur compounds such as DMTS (dimethyl trisulfide) and DMS (dimethyl sulfide) to the lake water. The concentration of taste and odour compounds in the water column changes with varied pH, DO, TN, TP, and NH4+-N. Thus, preventing anaerobic decomposition of cyanobacterial blooms is an important strategy against the recurrence of a malodor crisis in Lake Taihu (Ma et al., 2013).
Bloom formation and toxin production by algae: Microcystis sp.: Microcystis is a commonly found planktonic freshwater cyanobacterium that forms mass developments in surface waters used for recreation and as drinking water source (Ordorika et al., 2004). The growth of Microcystis produces bad-smelling and unsightly scum, preventing recreational use of water bodies, clogging irrigation pipe and hampering the treatment of water for drinking purposes (Yoshinaga et al., 2006). The colonies of Microcystis sp. are microscopic to macroscopic that are characterized by irregularly agglomerated spherical cells with colourless mucilage. The cell division occurs mainly in three different planes that are perpendicular to one another in successive generations. The daughter cells formed will be hemispherical, which later on grows into spherical form before the next cell division (Komarek and Komarkova, 2002; Visser et al., 2005). During the dominance of Microcystis sp., colonies appear largely within the epilimnetic and metalimnetic zones of water bodies (Reynolds and Rogers, 1976).
The Microcystis colonies are present in large numbers in the sediments during winter and spring. When Microcystis dies, the toxin microcystins releases into the water. Upon ingestion, fishes, birds and mammals actively absorb toxic microcystins. Microcystin primarily affects the liver, depending on the amount of toxin absorbed. The death of pets and livestock after drinking the water contaminated with microcystins was reported earlier, (Butler et al., 2009). Thus, the toxicity of Microcystis cells negatively affects phytoplankton, zooplankton and fish production either, directly or indirectly through the transfer or accumulation of toxins in the food web. Microcystis also affects aquatic community structure, mainly through impacts on feeding habits or food quality for zooplanktons and fishes. The profuse growth of cyanobacteria further affects total carbon production by causing a shift from large to small zooplankton species (Lehman et al., 2008).
The abundance of Microcystis sp in diverse water bodies attributes to: i) high nutrient loadings; ii) increased pH and decreased CO2 conditions; iii) the interaction between light and stability of the water column; iv) tolerance of low O2-concentrations and low redox potential affecting the availability of sulphur, iron and other metals; v) greater resistance to zooplankton grazing, either through size or toxicity; vi) a low N:P ratio; vii) superior competitiveness at high temperature; viii) ability to regulate buoyancy; ix) ability for phosphorus sequestration during sedimentary phase (Reynolds et al, 1981; Zohary and Breen, 1989; Dokulil and Teubner, 2000; Visser et al., 2005; Mc Carthy et al., 2009; Islam and Islam, 2012). In 1989, Microcystis sp. was dominant among algae in Sankey lake (Benjamin et al., 1996).
Fish death in lakes: Fish deaths in lakes occur due to variations in environmental and biological factors. The fish kill are common during a sudden change in temperature (thermal stress), oxygen depletions during summer and winter, vulnerable to diseases and parasite attacks and due to water pollution. In addition, fish deaths occur during prolonged cloudy weather, drought conditions, high ammonia concentrations and hydrogen sulphide, overcrowded fish population and excessive algae or other plant growth in lakes.
Fish death was reported in Ulsoor lake due to chemicals that flushed into the lake after cleaning of swimming pool, introduction of different varieties of fishes and due to phosphorus loading in the lake. The insufficient oxygen levels in water affects fish population as oxygen has a low solubility in water (0.5%) than in air (21%) and, diffusion of oxygen is slower in water than air. Fish death associated with stinking odour resembling rotten eggs, was characteristics of the presence of hydrogen sulphide (H2S). H2S (odour is perceptible in a dilution of 0.002 mg/l) is a colourless gas produced by respiration of certain bacteria and is highly toxic to most respiratory organisms with the ability to kill animals, plants and microorganisms in micromolar range by coming into contact with the respiratory enzyme, cytochrome c oxidase 7 (Maheshwari, 2005). The fish kill in Sankey lake (Etroplus suratensis, Chanda ranga, Puntius sp., Nandus nandus and Amblypharyngodon mola) during June – July, 1995 was due to sudden fall in DO levels in some locations (at sewage inlet) resulting in asphyxiation, not due to infection (Benjamin et al., 1996).

OBJECTIVE OF THE STUDY
- The primary goal of this study was to assess the physico-chemical characteristics of water in Sankey lake and identify the algal population present in the Lake.
- Understanding the prevailing taste and odour problems and fish death at Sankey lake.
- To understand the growth conditions of the abundant algae present and the various control measures taken so far to prevent cyanobacterial blooms.
MATERIALS AND METHODS
Study Area: Bangalore has three major watersheds, namely the Hebbal Valley, Vrishabhavathi Valley and the Koramangala and Challaghatta Valleys. There are two rainy periods in Bangalore i.e. from June to September (South-West Monsoon) and November to December (North-East Monsoon). The mean annual total rainfall in Bangalore is about 880 mm with about 60 rainy days a year over the last ten years. The summer temperature ranges from 18°C – 38°C, while the winter temperature ranges from 12°C – 25°C (Ramachandra et al., 2012). The Sankey Lake, situated in western part of Bangalore, Karnataka (India) is a man-made lake or tank. It lies in the Vrishabhavathi valley (Lat.:13° 00’24”-13° 00’41”N; Long.:77° 33’53”-77° 34’5”E (figure 2.1); altitude: 929.8 m MSL; maximum water spread area: 17.2 ha; maximum depth: 30.4 ft; average depth: 9 ft). It is a 500 year old, perennial water body and supports a significant biotic community (Benjamin et al., 1996).
Water Sample Collection: Water samples were collected from the three different sites in polypropylene bottles for a period of four months from December, 2012 to March, 2013 for the analysis of physico-chemical parameters and phytoplankton identification. The Site 1(S1; Inflow end), Site 2 (S2; rear end) and Site 3 (S3; opposite to raw sewage wet well) were the sampling locations chosen in the Sankey Lake and the sampling were done between 7:30 to 9:00 a.m. All samples were taken to the laboratory for further analysis.
Algal Identification and Enumeration: Phytoplankton samples collected from the surface water of Sankey lake at S1, S2 and S3 were identified (table 2.1) and counted microscopically. 100 ml of sample were collected from the selected locations. About, 15 ml of the sample was centrifuged at 3000 rpm at room temperature. From the concentrate, ~ 20 µl of the sample was transferred to glass slide, identified and counted under light microscope (Trivedy and Goel, 1986). The algal species were identified based on their key morphological features, according to Prescott (1954) and Desikachary (1959).
Table 2.1: Different sampling locations in Sankey lake
No. |
Sites |
Latitude |
Longitude |
1 |
S1 |
13°00’32” N |
77° 34’31” E |
2 |
S2 |
13° 00’ 41” N |
77°34’ 29” E |
3 |
S3 |
13° 00’ 29” N |
77° 34’ 21” E |
Analysis of Physico-chemical Parameters: The water quality parameters like water temperature, pH, electrical conductivity, total dissolved solids and dissolved oxygen (DO) were determined on site during sampling. Other parameters like total alkalinity, calcium and magnesium hardness, total hardness, chlorides, nitrate, orthophosphate, chemical oxygen demand (COD), sodium and potassium were analyzed using standard methods prescribed by Trivedi and Goel (1986), APHA (1998).
Statistical Analysis: The correlation coefficient was calculated to understand the relationship among different physico–chemical parameters. Correlation gives the mutual relationship between two variables. The correlation is said to be positive when increase in one parameter results in the increase of the other. The negative correlation occurs when the increase in one parameter causes the decrease in the value of the other. To find the relationship between two parameters x and y, the Karl Pearson’s correlation coefficient, r is used and it is determined as follows
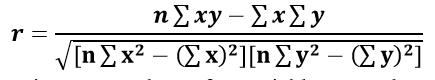
where, n = number of data points ; x = values of x–variable; y = values of y–variable.
The water quality data sets were also subjected to multivariate techniques like principal component analysis (PCA) and canonical correspondence analysis (CCA). All the statistical computations were made using PAST3 software.
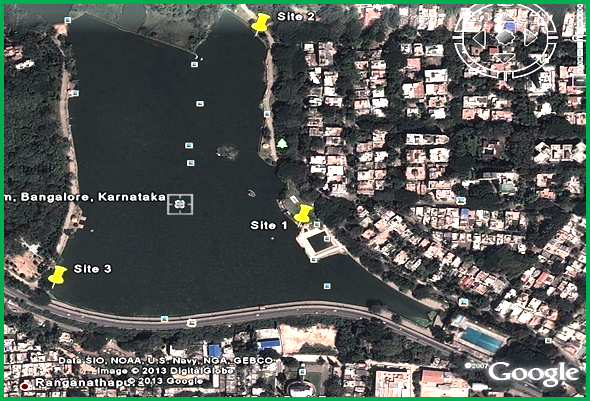
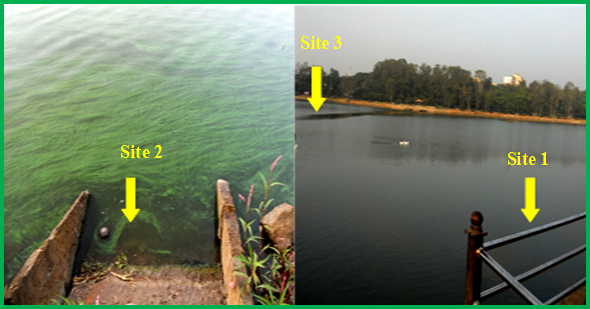
Figure 2.1: Sankey Lake, Bangalore, Karnataka, India
RESULTS AND DISCUSSION
Physico-chemical characteristics: The physico-chemical parameters play an important role in estimation of the constituents in water and the concentration of pollutants in water. Some parameters like temperature, dissolved oxygen, turbidity, hardness, alkalinity and nutrients (nitrogen and phosphorus) are the determinants of profuse growth of phytoplanktons. On contrary, parameters like biological oxygen demand and chemical oxygen demand indicates the pollution load in an aquatic ecosystem (Khanna et al., 2010). The interaction of both physical and chemical properties of water plays a significant role in composition, distribution and abundance of aquatic community. The water quality parameters of the three samples (S1, S2 and S3) collected from Sankey Lake have been presented and discussed with reference to their seasonal variations (figures 2.2 and 2.3).
Temperature: Temperature plays an important role in the wetland ecosystem, since it regulates the various physico-chemical as well as biological activities. The temperature of surface waters is influenced by climate, season, latitude, altitude, air circulation, cloud cover, flow, depth of water body and also the time of sampling, thereby, affecting various parameters like pH, alkalinity, dissolved oxygen, electrical conductivity etc. (Parashar et al., 2006; Savitha and Yamakanamardi, 2011). All these parameters in turn affect the various chemical and biological reactions such as solubility of oxygen, carbondioxide, carbonate – bicarbonate equilibrium, and increases the metabolic rate. The seasonal change in the productivity of a water body is related to the variation in temperature and photic conditions (Rani and Sivakumar, 2012). The water temperature did not vary much between sites during the four months study. It varied as 21.3°C (January) – 26.2°C (March) at S1; 21.23°C (January) – 26.4°C (March) at S2 and 21.8°C (December) – 26.5°C (March) at S3. The temperature increased towards the summer at all the three sites. The higher water temperature noted at all the sites during summer was due to reduction in the water level because of increased evaporation, high solar radiation and atmospheric temperature (Puri et al., 2010).
pH: pH indicates the measure of acidity or alkalinity of a solution and measures the concentration of hydrogen ions in water. The three main processes affecting the pH of aquatic ecosystems are photosynthesis, respiration and nitrogen assimilation. pH is also governed by the equilibrium between carbondioxide or bicarbonate or carbonate ions. It increases largely due to photosynthesis (uptake of carbondioxide) and lowers down during increased respiration (release of carbondioxide) (Ramachandra and Ahalya, 2001). The pH was alkaline throughout the study period. The pH varied from 9 (February) - 9.5 (January) at S1; 9 (March) - 9.8 (January) at S2 and 8.9 (March) - 10.3 (December) at S3. The highest pH (10.3 in December) was due to low water levels and increased photosynthetic activity. A decreased pH in March was due to decreased algal biomass and comparatively lesser rate of photosynthesis as evident during the study period. The desirable limit of pH recommended by Drinking Water Specification Indian Standard - IS 10500: 1991 is 6.5-8.5.
Electrical Conductivity (EC): EC is the measure of the ability of an aqueous solution to conduct an electric current. This ability depends upon the presence of ions, their total concentration, mobility and temperature. The greater the conductivity greater is the amount of ions such as calcium, magnesium, sodium, chloride, sulphates, bicarbonates and carbonates in water (Kumar and Oommen, 2011). High conductivity may arise through natural weathering of certain sedimentary rocks or may have an anthropogenic source, e.g. sewage effluent (Alobaidy et al., 2010). The electrical conductivity values at different sites were recorded as 446.67 (January) - 493 μS/cm (December) at S1, 447(January) - 504 μS/cm (December) at S2 and 420.33 (January) - 501 μS/cm (December) at S3. In the present study, the conductivity declined little bit in month of January and increased towards March, due to dilution of lake water with sewage water inflow in January and increased rate of evaporation during March.
Total dissolved solids (TDS): TDS is the term used to describe the inorganic salts and small amounts of organic matter present in solution in water. The increase or decrease in TDS may be attributed to the concentration of principal constituents that are usually calcium, magnesium, sodium, and potassium cations and carbonate, bicarbonate, chloride, sulfate, and nitrate anions (Chandra et al., 2012). The TDS at S1 varied from 198.33 (January) - 220 mg/l (December). The values at S2 ranged between 197.67 (January) - 228 mg/l (December), while at S3 between 197 (January) - 224mg/l (December).
Dissolved oxygen (DO): Dissolved oxygen is another vital parameter regulating growth and survival of aquatic life. The dissolved oxygen content in water varies with temperature, turbulence, salinity, photosynthetic activity of aquatic plants and the atmospheric pressure. DO in water affects the oxidation – reduction state of many other chemical compounds such as nitrate and ammonia, sulphate and sulphite, and ferrous and ferric ions (Trivedy and Goel, 1986). The lower concentration of DO in water attributes to addition of effluents containing oxidizable organic matter and consequent biodegradation and decay of vegetation at higher temperature leading to consumption of oxygen from water (Thakor et al., 2011). It varied as 6.9 (February) - 14.92mg/l (January) at S1, 4.9 (December) - 17.25 mg/l (January) at S2 and 5.71 (February) - 18.78 mg/l (January) at S3. Low DO levels during summer may be due to higher temperature, affecting the solubility of oxygen in water (Verma and Singh, 2010); increased oxygen demands of fishes and increased bacterial decomposition of dead aquatic plants and algae (Gandhi, 2012). The variations in DO concentration in lake are directly relating with the abundance and diversity of prevailing phytoplankton (Verma et al., 2012).
Chemical oxygen demand (COD): Chemical Oxygen Demand (COD) measures the oxygen equivalent of the organic and inorganic matter in a water sample that is susceptible to oxidation. COD indicates the extent of pollution in water, determined by the various organic and inorganic materials like calcium, magnesium, potassium, sodium, and so forth (Ramachandra, 2001). The COD at S1 varied from 12 (March) – 360 mg/l (January). The COD values at S2 ranged between 16 (March) – 680 mg/l (January), while at S3 between 8.0 (March) – 440 mg/l (January). The higher values of COD in lakes create turbid conditions. Higher turbidity shows the presence of higher concentrations of organic and non-biodegradable components in the lake water that requires larger amounts of oxygen for the decomposition process (Sharma and Capoor, 2010).
Sodium and Potassium (Na and K): Sodium is ubiquitous in natural waters and in plant and animal matter. It is present in the ionic form, which is highly soluble in water. The concentration of sodium in surface waters (inclusive of the lakes having sewage inflow) is usually below 50 mg/l (Ramachandra and Ahalya, 2001). The sodium values varied from 21.6 (January) -122.8 mg/l (March) at S1, 87.6 (February) -156.8 mg/l (March) at S2 and 98.8 (December) -144.8 mg/l (March) at S3. Potassium (in ionic form) is readily soluble in water and also incorporated into minerals and accumulated by aquatic biota in aquatic ecosystems. The concentration of potassium in surface waters is usually less than 10 mg/l (Ramachandra and Ahalya, 2001). The potassium values varied from 12.4 (February) -35.6 mg/l (January) at S1, 14.4 (February) -28.8 (January) mg/l at S2 and 12.4 (February) - 23.6 (January) mg/l at S3. The Sankey lake had high concentrations of sodium and potassium (above the permissible limits), which indicates sewage contamination.
Total Alkalinity (TA): Alkalinity is primarily a function of carbonates, bicarbonates and hydroxides content in water. Borates, phosphates, silicates and other bases also contribute towards alkalinity. It is the measure of capacity of water to neutralize a strong acid. A higher value of total alkalinity indicates the high trophic status of the lake. It is estimated that the high productive waters generally have total alkalinity above100 mg/l (Rao et al., 2010).The total alkalinity throughout the study period was observed as 130 (February) -160 mg/l (March) at S1, 136(February) -156 mg/l (December) at S2 and 140 (December) -174 mg/l (January) at S3. The high alkalinity attributes to the increased rate of organic decomposition during which, carbon dioxide releases and then reacts with water to form bicarbonates, thereby, increasing the total alkalinity of the aquatic body (Shinde et al., 2011).
Chloride: Chloride is one of the most important parameter in assessing the water quality. High chloride contents in freshwater is an indicator of high organic pollution (Savitha and Yamakanamardi, 2011). The salts of sodium, potassium and calcium contribute chlorides in water. The discharge of sewage wastes result in high chloride level in fresh water (Mohanta and Potra, 2000). The chloride concentration was observed as 60.35 (January) - 68.16 mg/l (March) at S1, 63.9 (January) - 70.29 mg/l (March) at S2 and 63.9 (December) - 70.29 mg/l (March) at S3. The chloride content in all the three sampling sites of the Sankey lake during the study period was within the permissible limit of 250 mg/1. Higher chloride content towards summer was due to the high atmospheric temperature and increased rate of evaporation.
Total hardness (TH), Calcium hardness (CaH) and Magnesium hardness (MgH): Hardness is caused by the presence of calcium and magnesium ions (bivalent cations) in water. The polyvalent ions of some other metals like strontium, iron, aluminium, zinc and manganese, etc. contributes to hardness in fresh water ecosystems (Ramachandra and Solanki, 2007). The average total hardness in Sankey lake was observed as 91 (January) - 94 mg/l (December and March) at S1, 91 (January) - 106 mg/l (December) at S2 and 87 (December) - 98 mg/l at S3 (January). The addition of sewage might be the cause of increased levels of hardness (Mohanta and Potra, 2000). The increased photosynthetic activity, loss of CO2 and precipitation of calcium carbonate increases the water temperature and contributes to the depletion of calcium (Chapman, 1992). The values of calcium hardness varied at all sites: 14.43 (March) - 24.85 mg/l (December) at S1, 13.63 (March) - 24.05 mg/l (December) at S2 and 12.83 (March) - 22.45 mg/l (December) at S3. Magnesium is essential for chlorophyll growth and acts as a limiting factor for the growth of phytoplankton. Therefore, depletion of magnesium reduces the number of phytoplankton population. The monthly value of magnesium hardness in Sankey lake was 16.8 (December) - 19.34 mg/l (March) at S1, 18.71 (January) - 19.91 mg/l (December) at S2 and 18.02 (March) - 20.02 mg/l (January) at S3.
Nitrate: Nitrate is the most highly oxidized form of nitrogen compounds commonly present in water bodies. It is the product of aerobic decomposition of organic nitrogenous matter. The nitrate levels varied from 0.038 (March) - 0.399 mg/l (February) at S1, 0.036 (March) -0.553 mg/l (December) at S2 and 0.032 (March) -0.505 mg/l (January) at S3. The inflow of sewage to the Sankey lake increased the nitrate level and in turn had enhanced the productivity of the system. A drop in the nitrate levels was evident at all the sites in March, due to profuse growth of algae. The higher concentration of nitrate may be due to the higher phytoplanktonic production, decaying phytoplankton and concentration of nutrients because of the increased evaporation of lake water. The nitrogen levels (as nitrates) indicate the trophic status of the water bodies. Higher concentration of nitrates is an indicator of organic pollution and eutrophic conditions (Mahapatra et al., 2011; Rao et al., 2010).
Ortho-phosphate (OP): Phosphorus controls algal growth and productivity as it acts as a limiting nutrient in aquatic ecosystems. Excess amounts of phosphorus along with nitrates and potassium in fresh water ecosystems leads to excessive algal growth (Ramana et al., 2008). Ortho-phosphate is the form of phosphorus that is readily soluble in water and directly utilized by aquatic biota for their growth and reproduction. The phosphate values varied from 0.028 (December) -0.087 mg/l (February) at S1, 0.025 (December) -0.082 mg/l (February, March) at S2 and 0.032 (February) -0.12 mg/l (January) at S3. The decrease in phosphate content towards March is due to increased utilization of phosphate by the phytoplankton present in the lake. Table 2.2 lists surface water standards for various categories.

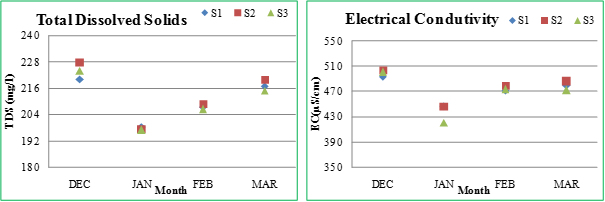
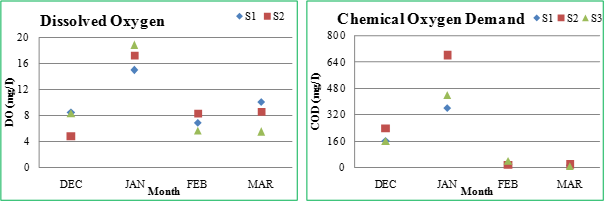
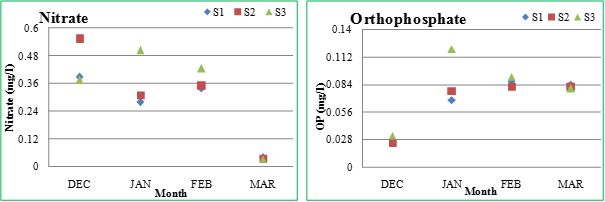
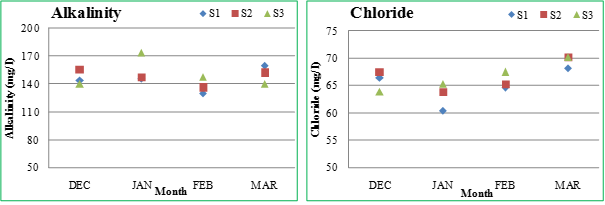
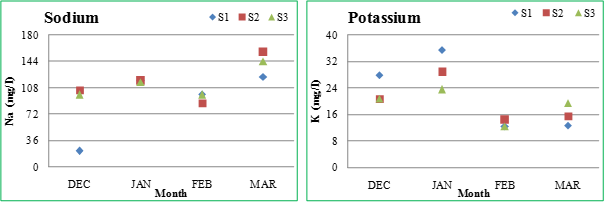


Figure 2.2: Physico-chemical parameters of Sankey lake at S1, S2 and S3 (December-March)
Table 2.2: Surface water quality standards (IS: 2296)
Sl No. |
Parameter and Unit |
Class A |
Class B |
Class C |
Class D |
Class E |
Drinking water without treatment but after disinfection |
Water for outdoor bathing |
Drinking water with conventional treatment followed by disinfection |
Water for fish culture and wild life propagation |
Water for Irrigation, industrial cooling and controlled waste disposal |
1 |
pH (min : 6.5) |
8.5 |
8.5 |
8.5 |
8.5 |
- |
2 |
Conductivity (25oC) µS/cm |
- |
- |
- |
1000 |
2250 |
3 |
DO (mg/L)(minimum) |
6 |
5 |
4 |
4 |
- |
4 |
BOD (3d, 27oC) (mg/L) |
2 |
3 |
3 |
- |
- |
5 |
Total Hardness (mg/L as CaCO3) |
300 |
- |
- |
- |
- |
6 |
Calcium (mg/L) |
80.10 |
- |
- |
- |
- |
7 |
Magnesium (mg/L) |
24.28 |
- |
- |
- |
- |
8 |
Chlorides (mg/L as Cl) |
250 |
- |
600 |
- |
600 |
9 |
Nitrates (mg/L as NO3) |
20 |
- |
50 |
- |
- |
10 |
Free NH3 (mg/L as N) |
- |
- |
- |
1.2 |
- |
11 |
Sodium Absorption Ratio |
- |
- |
- |
- |
26 |
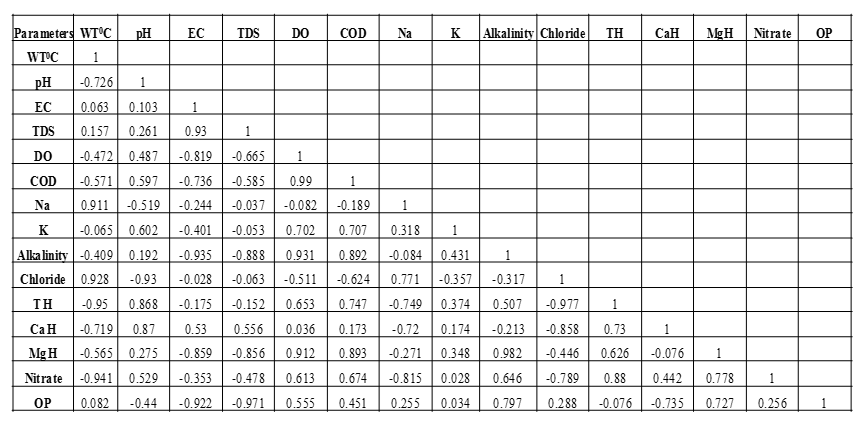
Correlation among different physico – chemical parameters: In order to understand the relationship among different physico–chemical parameters, correlation coefficient was calculated. The correlation coefficient showed that at Site 1 (table 2.3), high positive correlation was found between water temperature and chloride; water temperature and MgH; pH and Na; EC and TDS; EC and chloride; EC and TH; TDS and TH; TDS and chloride; DO and COD; DO and K; COD and K; Na and MgH; Na and OP; chloride and TH; MgH and OP. High negative correlation was observed between water temperature and COD; water temperature and K; water temperature and nitrate; pH and EC; pH and TDS; pH and TH; pH and CaH; EC and DO; COD and chloride; Na and CaH; alkalinity and nitrate; CaH and MgH; CaH and OP; MgH and nitrate.
At Site 2 (table 2.4), high positive correlation was found between water temperature and chloride; water temperature and Na; pH and COD; pH and K; EC and TDS; EC and CaH; EC and TH; EC and MgH; TDS and chloride; TDS and TH; TDS and MgH; DO and COD; DO and K; COD and K; TH and CaH; TH and MgH; TH and nitrate; CaH and MgH; CaH and nitrate.
High negative correlation was observed between water temperature and pH; water temperature and nitrate; EC and DO; EC and COD; TDS and DO; DO and TH; DO and MgH; Na and nitrate; TH and OP; CaH and OP; MgH and OP; nitrate and OP.
At Site 3 (table 2.5), high positive correlation was found between water temperature and chloride; water temperature and Na; pH and TH; pH and CaH; EC and TDS; DO and COD; DO and K; DO and alkalinity; DO and MgH; COD and K; COD and alkalinity; COD and TH; COD and MgH; Na and chloride; alkalinity and MgH; alkalinity and OP; TH and CaH; TH and nitrate; MgH and nitrate; MgH and OP.
High negative correlation was observed between water temperature and pH; water temperature and TH; water temperature and CaH; water temperature and nitrate; pH and chloride; EC and DO; EC and COD; EC and alkalinity; EC and MgH; EC and OP; TDS and alkalinity; TDS and MgH; TDS and OP; Na and TH; Na and CaH; Na and nitrate; chloride and TH; chloride and CaH; chloride and nitrate; CaH and OP.
Algal Identification and Enumeration: The common algal species found in the Sankey Lake were Cyanophytes such as Microcystis sp., Planktothrix sp., Merismopedia sp.; Chlorophytes like Scenedesmus sp, Ankistrodesmus sp, Chlorella sp., Cosmarium sp, Pediastrum sp., Tetraedron sp., Crucigenia sp., Monoraphidium sp. and Bacillariophytes that includes both centric and pennate diatoms (Nitzschia sp., Navicula sp., Cyclotella sp.), listed in Table 2.6. The sampling site S2 harbored more algal species compared to the other two sites (S1and S3) as seen in figure 2.3.The site S2 supported more Cyanophyceae members with an average cell density of 37.15 x 10⁶cell/l whereas S3 had more Chlorophyceae (average cell density of 25.3 x 10⁶cell/l) and Bacillariophyceae (average cell density of 25.5 x 10⁶cell/l) members. The algal species like Microcystis sp., Planktothrix sp.,Chlorella sp., Scenedesmus sp. and Nitzschia sp. are indicators of organic pollution thus, making water unfit for drinking and recreational purposes (Roselene and Paneerselvam, 2008). The presence of large population of algae in Sankey lake, especially in the month of January and March is due to an increase in photosynthetic activity, releasing a considerable amount of oxygen in water. The occurrence of bloom of Microcystis sp. indicates organic pollution. The factors affecting cyanobacterial bloom formation include light intensity and total sunlight duration, nutrient availability (especially phosphorus), water temperature, pH, water flow (whether water is calm or fast-flowing), an increase in precipitation events and water column stability (USEPA, 2012). Temperature also plays a major role in influencing the occurrence, periodicity and abundance of life (Sonawane, 2011).
Table 2.3. Correlation Coefficient among various physico-chemical parameters at sampling site 1 of Sankey lak

Table 2.4. Correlation Coefficient among various physico-chemical parameters at sampling site 2 of Sankey lake

Table 2.5: Correlation Coefficient among various physico-chemical parameters at sampling site 3 of Sankey lake
Aquatic organisms are affected by pH variations because most of the metabolic activities are pH dependent. Optimal pH range for sustainable aquatic life is pH 6.5 - 8.2. The main factors affecting pH are photosynthesis, respiration, temperature and entry of sewage (Verma et al., 2012). In the study conducted by Sincy et al. (2012), Microcystis grew well at temperature ranging between 21.9°C - 27.3°C and pH ranging from 7.9 - 9.68, which is in accordance with our study. The excessive growth of Cyanophycean members appeared in lakes when the phosphate and nitrate concentrations are present at moderate to high levels, especially during winter and summer months (Kumar and Oommen, 2011).The water bodies contaminated with sewage harbor more Cyanophycean members due to the presence of excessive amount of nutrients (N and P) in the system (Ansari et al., 2008). The high turbidity, pH, bicarbonate, orthophosphate, alkalinity and chloride may be responsible for the Cyanophyceae growth and bloom formation. The higher concentration of nitrate, calcium and phosphate in lakes are favorable for the growth of Chlorophytes (Tiwari and Chauhan, 2006). The concentration of nutrients present in water due to high evaporation rate towards and during summer promotes algal growth. The factors controlling distribution of Cyanophyceae are temperature, pH, alkalinity and phosphate whereas, the growth of Chlorophyceae and Diatoms are determined by high water temperature, phosphate, nitrate, low DO and CO2, which is in accordance with the present study. Microcystis sp. was dominant among the Cyanophycean members throughout the study period (Figure 2.3) as its colonies were resistant to grazing population due to their toxin content as well as their large sized colonies. These algae, being excellent competitors of nutrients suppresses the growth of other algal groups in the lake. The Microcystis colonies can survive for longer periods and may accumulate at the lake bottom (over wintering). Even though certain amount of the Microcystis cells might die and decompose, most of them would still float upward back to the water from sediments to re-grow next year (Brunberg and Blomqvist, 2002; Feng et al., 2011). Thus, the biotic and abiotic factors either directly or indirectly influence the overall phytoplankton composition in water bodies.
Table 2.6: Different algal groups present at S1, S2 and S3 in Sankey lake
|
|
S1 |
S2 |
S3 |
|
|
Dec |
Jan |
Feb |
Mar |
Dec |
Jan |
Feb |
Mar |
Dec |
Jan |
Feb |
Mar |
I |
Cyanophyceae |
|
|
|
|
|
|
|
|
|
|
|
|
1 |
Cylindriospermopsis sp. |
- |
- |
- |
- |
- |
+ |
- |
- |
- |
- |
- |
- |
2 |
Merismopedia sp. |
- |
- |
- |
+ |
+ |
+ |
- |
+ |
+ |
- |
- |
+ |
3 |
Microcystis sp. |
+ |
+ |
+ |
+ |
+ |
+ |
+ |
+ |
+ |
+ |
+ |
+ |
4 |
Planktothrix sp. |
+ |
- |
+ |
+ |
+ |
+ |
+ |
+ |
+ |
- |
+ |
+ |
II |
Chlorophyceae |
|
|
|
|
|
|
|
|
|
|
|
|
1 |
Ankistrodesmus sp. |
- |
- |
- |
- |
- |
- |
- |
- |
- |
- |
- |
+ |
2 |
Chlorella sp. |
+ |
- |
+ |
- |
+ |
- |
+ |
- |
+ |
- |
+ |
- |
3 |
Closterium sp. |
+ |
- |
+ |
+ |
+ |
- |
+ |
+ |
+ |
- |
+ |
+ |
4 |
Cosmarium sp. |
+ |
- |
+ |
+ |
+ |
- |
+ |
+ |
+ |
- |
+ |
+ |
5 |
Crucigenia sp. |
+ |
- |
- |
- |
+ |
- |
- |
- |
+ |
- |
- |
- |
6 |
Monoraphidium sp. |
+ |
- |
- |
+ |
+ |
+ |
- |
+ |
+ |
- |
- |
+ |
7 |
Pediastrum sp. |
+ |
+ |
+ |
- |
+ |
+ |
+ |
+ |
+ |
- |
+ |
+ |
8 |
Scenedesmus sp. |
+ |
+ |
+ |
+ |
+ |
+ |
+ |
+ |
+ |
- |
+ |
+ |
9 |
Tetraedron sp. |
+ |
- |
+ |
+ |
+ |
- |
+ |
+ |
+ |
- |
+ |
+ |
III |
Bacillariophyceae |
+ |
+ |
+ |
+ |
+ |
+ |
+ |
+ |
+ |
- |
+ |
+ |
Figure 2.3: Algal distribution at the three sites of Sankey Lake
In order to understand the factors affecting the massive growth of Cyanophyceae in Sankey lake, multivariate statistical technique such as PCA (Principal Component Analysis) and CCA (Canonical Correspondence Analysis) were used.
Principal Components Analysis (PCA) was performed on normalized data of lake water samples described by eighteen physical, chemical and biological parameters (18 variables). PCA is an established statistical technique that aims to transform the observed variables to a new set of variables (as Principal Components) which are uncorrelated and arranged in the decreasing order of importance that explain the actual variability and importance of the data and variables by simplifying the actual problem. Principal components (PCs) are derived from eigenvalue(s) that gives a measure of the significance of the factor/variable derived. Eigenvalues of 1.0 or greater are considered significant (Shrestha and Kazama, 2007). Table 2.7 represents the initial PCs and its eigenvalues and percent of variance contributed in each PC. When the eigenvalues are plotted against the corresponding PC, a screeplot is produced which shows the rate of change in the magnitude of the eigenvalues for the PC. The ‘elbow’ or the point at which the curve bends indicates the maximum number of PC to extract. Figure 2.4 shows the scree plot of the eigenvalues for each component.
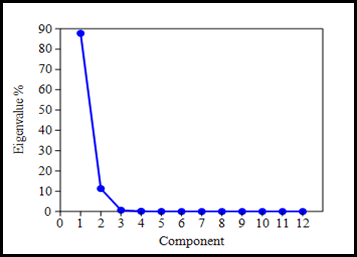
Figure 2.4: Scree plot of the eigenvalues of principal components
Table 2.7: Loadings and eigenvalues of water quality parameters on significant principal components for water samples collected from Sankey lake
|
PC 1 |
PC 2 |
Water temperature (°C) |
-0.494 |
-0.215 |
pH |
-0.614 |
-0.172 |
EC (µS) |
3.409 |
-0.785 |
TDS (mg/l) |
1.141 |
-0.421 |
DO (mg/l) |
-0.615 |
-0.101 |
COD (mg/l) |
0.580 |
3.937 |
Sodium (mg/l) |
0.224 |
-0.292 |
Potassium (mg/l) |
-0.524 |
-0.059 |
Alkalinity (mg/l) |
0.576 |
-0.158 |
Chloride (mg/l) |
-0.122 |
-0.252 |
Total Hardness (mg/l) |
0.120 |
-0.210 |
Ca Hardness (mg/l) |
-0.545 |
-0.166 |
Mg Hardness (mg/l) |
-0.533 |
-0.182 |
Nitrate (mg/l) |
-0.692 |
-0.170 |
Phosphate (mg/l) |
-0.694 |
-0.172 |
Cyanophyceae |
-0.294 |
0.143 |
Chlorophyceae |
-0.496 |
-0.335 |
Bacillariophyceae |
-0.430 |
-0.390 |
Eigenvalue |
10.54 |
1.36 |
% variance |
87.79 |
11.32 |
PCA of the data sets yielded 2 PCs with eigenvalues >1 (Chatfield and Collins 1980; Mazlum et al., 1999), with eigenvalues of 10.54 and 1.36 and the % variance of 87.79% and 11.32% for PC1 and PC2 respectively and were considered to explain the variability in the data. Liu et al. (2003) classified the factor loadings as ‘strong’, ‘moderate’ and ‘weak’, corresponding to absolute loading values of >0.75, 0.75-0.50 and 0.50-0.30, respectively. PC1 has strong positive loading on EC and TDS and moderate positive loading on COD and alkalinity, whereas, moderate negative loadings on pH, DO, potassium, nitrate, phosphate, calcium hardness and magnesium hardness. PC2 has strong positive loadings on COD and strong negative loadings on EC. PC1 indicates the presence of both mineral and organic pollution. PC2 indicated that the components were related to organic pollutants from domestic wastewater (Figure 2.5).

Figure 2.5: Principal component analysis for physico-chemical and biological parameters
Figure 2.5 shows that EC, TDS and COD are the major components governing water quality and indicate the presence of organic matter in the lake water. The prolific growth of Cyanophyceae is independent of all the physico-chemical and biological parameters. The growth of Bacillariophyceae and Chlorophyceae are affected by other parameters like water temperature, pH, DO, potassium, chloride, nitrate, phosphate, calcium hardness and magnesium hardness.

Figure 2.6: Canonical correspondence analysis for the physico-chemical parameters and different algal species in Sankey lake
Canonical Correlation Analysis is chosen here as it allows us to calculate and to understand relationships by removing unnecessary statistics and computing lesser number of statistics while preserving the relationships among variables under consideration. Canonical Correspondence Analysis also known as canonical correlation analysis (CCA) or reciprocal averaging is a multivariate ordination technique that shows the chi-square distance widely used in environmental and ecological studies. CCA is an analysis of measuring the linear relationship between two multidimensional entities or variables. Basically, it determines two centers, one center for each multidimensional variable optimized based on correlating variable determining corresponding correlations, and dimensionality of the variables would be equal or smaller than the smallest dimensionality of the two variables. CCA is better than any other correlation analysis since these have no influence of description of variables. In the output graph (figure 2.6), the lengths and positions of the arrows provide information about the relationship between the original environmental variables and the derived axes. The arrows that are parallel to an axis indicate a correlation and the length of the arrow tells us about the strength of that correlation.
The environmental variables closely correlated to the first axis were EC, TDS, calcium hardness, total hardness, sodium and Cyanophyceae while, the variables strongly correlated to axis 2 were Bacillariophyceae and Chlorophyceae. COD, DO, sodium and potassium influences the growth of Cyanophyceae (figure 2.6). The massive growth of Cyanophyceae inhibited the growth of other algal genera. Bacillariophyceae and Chlorophyceae are influenced by other variables. Table 2.8 below shows the output of correspondence analysis with axis values in two dimension and eigenvalue representing each of the values.
Table 2.8: Output of correspondence analysis
Parameters |
Abbr |
Axis1 |
Axis2 |
Water temperature |
WT |
-0.162 |
-0.045 |
pH |
pH |
-0.266 |
0.055 |
EC |
EC |
-0.606 |
0.01 |
TDS |
TDS |
-0.556 |
-0.018 |
DO |
DO |
0.383 |
0.285 |
COD |
COD |
0.393 |
0.032 |
Sodium |
Na |
0.439 |
-0.305 |
Potassium |
K |
0.121 |
0.259 |
Alkalinity |
Alk |
-0.065 |
0.006 |
Chloride |
Chl |
-0.358 |
-0.035 |
Total Hardness |
TH |
-0.616 |
0.073 |
Ca Hardness |
CaH |
-0.825 |
0.132 |
Mg Hardness |
MgH |
-0.27 |
0.048 |
Nitrate |
Nitrate |
-0.183 |
0.051 |
Ortho-Phosphate |
OP |
-0.157 |
0.046 |
Cyanophyceae |
Cy |
1.775 |
0.4 |
Chlorophyceae |
Ch |
-0.301 |
-1.164 |
Bacillariophyceae |
Ba |
-0.804 |
1.067 |
|
Eigenvalue |
0.176 |
0.014 |
|
% |
92.8 |
7.2 |
Note: Abbr - abbreviation
Figure 2.7 shows the physico-chemical characteristics of Sankey lake in the month of December, 2012 (D12); January, 2013 (J13); February, 2013 (F13); March, 2013 (M13); August, 2013 (A13); October, 2013 (O13); November, 2013 (N13); April, 2014 (A14); December, 2014 (D14) and March, 2015 (M15). During these periods, Microcystis sp. dominated during the study period except in December, 2014 and March, 2015, a time period. The introduction of aerators led to the prevalence of mixed algal groups indicating the functioning of Lake Ecosystem. The massive Microcystis growth during August - October, 2013 had reduced the levels of total dissolved solids, electrical conductivity, nitrate, sodium and potassium but gradually increased the pH, alkalinity, hardness and orthophosphate levels. The organic matter, carbonates, bicarbonates as well as ions play an important role in Microcystis growth. The values are in accordance with other studies as in table 2.10.
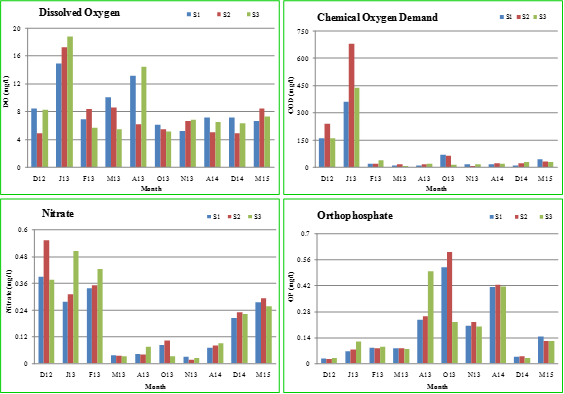

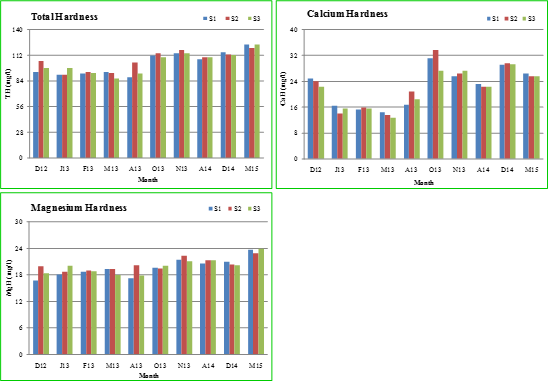
Figure 2.7: Physico-chemical characteristics of Sankey lake from December, 2012 – March, 2015.
VARIATIONS IN PHYICO-CHEMICAL CHARACTERISTICS AMONG DIFFERENT SITES AND DIFFERENT MONTHS OF SANKEY LAKE: 2012 TO 2015
The adverse ecological effects observed in Sankey lake were: (i) taste and odor problems, (ii) decreased water transparency, (iii) depletion of dissolved oxygen levels, (iv) massive growth of toxic phytoplankton species (Cyanobacteria), (v) increased incidences of fish kills and death of ducks, (vi) decrease in aquatic biodiversity, (vii) decrease in aesthetic value of the water body, etc.
During January, 2015, pH became slightly alkaline; total hardness, alkalinity, DO and nitrate levels gradually increased. In August, 2013 and March, 2015, fish death was reported in Sankey Lake due to toxic algal blooms as well as increased ammonia levels (8.74 mg/l) indicating higher organic load in the lake (Table 2.9). Ammonia enters the aquatic ecosystem via anthropogenic sources such as sewage entry, agricultural runoff, nitrogen fixation and the excretion of nitrogenous wastes from animals. The ammonia is released into lakes even during the breakdown of proteins in fish (USEPA, 2013). Fish digest the protein in their feed and excrete ammonia through their gills and in their feces. The amount of ammonia excreted by fish depends on the feeding rate and protein content in the feed. Ammonia also enters the lake through diffusion from the sediments. In the sediments at the lake bottom, the bacterial decomposition of organic matter such as uneaten feed, dead algae, aquatic plants and fecal solids excreted by fish, releases ammonia to the surface water (Hargreaves and Tucker, 2004). Excess ammonia (NH4) levels accumulate in organisms and cause alteration of metabolic activities or increases in body pH harming the aquatic life. At extreme ammonia levels, fish may experience convulsions, coma, and death. A short-term exposure to toxic un-ionized ammonia at about 0.6 mg/l (ppm) is capable of killing fish over a few days. But, chronic exposure to toxic un-ionized ammonia as low as 0.06 mg/l (ppm) can cause gill and kidney damage, growth reduction, brain malfunctioning and reduction in the oxygen-carrying capacity of the fish (Durborow et al., 1997). Joung et al., (2011) reported the rapid growth rate of Microcystis sp. during summer due to the presence of increased TP and water temperature. The Microcystis sp. bloom occurred during August to September, 2006. Water temperature, NH4-N:NOX-N ratio, TN:TP ratios are the important factors determining the dominance of Microcystis sp. In Taihu lake, Microcystis sp. became dominant among all phytoplanktons as they are superior competitors at elevated temperatures. Microcystis sp. bloom (Figure 2.8) accompanied elevated suspended solid concentration (exceeding 10 mg/l) and pH (above 8.0) (Liu et al, 2011). The pH, dissolved oxygen and temperature at the sediment and water interface influences the P release from sediments to great extent. The soluble P present in the sediments is higher than that in the overlying water. The release rate of P increased with the increase of pH from 8 - 10. The P release also increased with increase in temperature. The TP concentration increases as DO concentration decreased. TP reached the maximum under anaerobic conditions (DO < 1 mg/l) with the increase of time and took longer time to reach the equilibrium (Li et al., 2013). Xie et al., (2003) found that Microcystis bloom resulted in high pH (due to increased rate of photosynthesis by algae) and induced P (phosphorus) pollution in lakes due to massive release of P from the sediments to the water column but decreased the concentration of nitrate nitrogen (NO3-N) in an enclosure experiment conducted in the hyper-eutrophic subtropical lake, Donghu. Profuse growth and bloom of Microcystis occurred between August and September.
Table 2.9: Minimum and maximum values of physico-chemical parameters during the whole study period
Parameters |
Min |
Max |
Water Temperature (°C) |
21.23 |
27.7 |
pH |
7.7 |
10.3 |
EC (µS) |
399 |
504 |
TDS (mg/l) |
193 |
228 |
DO (mg/l) |
4.88 |
18.78 |
COD (mg/l) |
8 |
680 |
Sodium (mg/l) |
21.6 |
256.8 |
Potassium (mg/l) |
7.2 |
41.2 |
Total Alkalinity (mg/l) |
124 |
216 |
Chloride (mg/l) |
55.38 |
70.29 |
Total Hardness (mg/l) |
87 |
124 |
Calcium Hardness (mg/l) |
12.83 |
33.67 |
Magnesium Hardness (mg/l) |
16.8 |
23.9 |
Nitrate (mg/l) |
0.019 |
0.553 |
Ortho-phosphate (mg/l) |
0.025 |
0.601 |
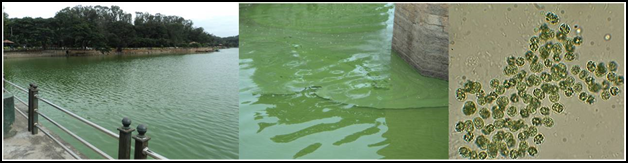
Figure 2.8: Microcystis sp. in Sankey lake
Table 2.10: Favourable conditions reported for Microcystis sp. bloom
Sl.No |
Lakes |
Place |
WT °C |
pH |
Nitrate (mg/l) |
Phosphate (mg/l) |
COD (mg/l) |
DO (mg/l) |
Reference |
1 |
Aras -dam reservoir |
Iran |
27 |
9.16 |
1 |
0.6 |
- |
17.2 |
Mohebbi et al, 2012 |
2 |
Taihu |
China |
2.0- 32.3 |
7.0- 9.67 |
0.017 - 3.05 |
0.001- 0.039 |
- |
- |
Chen et al , 2003 |
3 |
Vellayani |
India |
25 - 34 |
8.3 - 9.5 |
0.06 - 1.3 |
0.01 - 0.04 |
- |
6.4 - 10.2 |
Aneesh and Manilal , 2013 |
4 |
Kukkarahalli |
India |
- |
9.41 - 9.5 |
2.66 -2.81 |
- |
153.6 - 160 |
2.2 - 3.2 |
Udayashankara et al., 2013 |
6 |
Dabeerkulam Pond |
India |
- |
7.3 |
9.9 |
5.5 |
- |
0.8 |
Muthukumar et al., 2007 |
7 |
Unkal |
India |
24.9 - 27.5 |
- |
3.0 - 11 |
0.006 - 0.08 |
17.5 - 24.3 |
6.1 - 7.0 |
Ansari et al., 2008 |
8 |
Ambazari |
India |
23.00–33.00 |
- |
0.445–1.01 |
0.011–0.065 |
- |
7.32–10.4 |
Maske et al, 2010 |
9 |
Phutala |
India |
22.00–31.00 |
- |
0.286–0.979 |
0.011–0.066 |
- |
5.93–10.46 |
Maske et al, 2010 |
10 |
Bathi tank |
India |
- |
7.8-7.9 |
8.9-23 |
0.12-3.6 |
12.0 -18.0 |
2.9-5.3 |
Suresh et al, 2011 |
11 |
Udaisagar |
India |
20 - 29 |
- |
0.50 - 0.80 |
0.56 - 0.90 |
- |
5 - 6.5 |
Vijayvergia, 2008 |
12 |
Munshi Hussain Khan |
India |
21.8 |
7.2 |
7.114 |
5.64 |
178 |
8.8 |
Napit, 2013 |
13 |
Siddiqui Hussain Tank |
India |
22.1 |
6.9 |
5.563 |
8.42 |
188 |
8.4 |
Napit, 2013 |
14 |
California lakes |
USA |
21.4 - 25 |
9.24 - 10.0 |
0.01 - 0.33 |
0.06 - 0.18 |
- |
7.8 - 16.3 |
Backer et al., 2009 |
15 |
Brno reservoir |
Czech Republic |
13.8 - 26.0 |
7.49 - 9.37 |
- |
- |
- |
6.69 - 16.62 |
Strakova et al., 2013 |
16 |
Qinshan Lake |
China |
19.1 |
6.98 |
2.71 |
- |
- |
- |
Zhang et al., 2011 |
Effects of persistence of Cyanobacteria in aquatic ecosystems:
- Discoloration makes water unpleasant and water would be non-potable;
- Oxygen depletion due to bloom respiration or decomposition;
- Accumulation of toxins in aquatic organisms through food chains;
- Poor light penetration to the depths (shading effects);
- Mortality of aquatic organisms (fish, zoo planktons) due to toxin production;
- Diversity of aquatic organisms decreases; Lowers algal and in particular native diversity;
- Competes with other algae for nutrients and thrives well under adverse conditions;
- Economic losses due to off- flavor in fishes caused by cyanobacteria
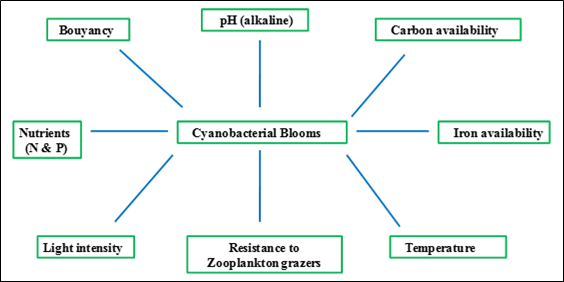
Figure 2.9: Factors favoring cyanobacterial growth
General cellular structure of Cyanobacteria (Microcystis sp.)
Cyanobacteria are the most primitive group of organisms on Earth and has a fossil record traced back to 3.5 billion years. They are also known as blue- green algae, blue- green bacteria or cyanophytes. They are gram negative bacteria that contain photosynthetic pigments like chlorophyll as in algae. The ability of cyanobacteria to perform oxygenic photosynthesis had gradually converted the primitive Earth’s atmosphere from an anaerobic to an aerobic one and had paved way to the rapid evolution and dominance of aerobic organisms which represents the huge global biodiversity prevailing as now (Dietrich and Hoeger, 2005).
Cyanobacterial bloom (figure 2.9) occurs in fresh water bodies to oceans and produces a wide variety of toxins (cyanotoxins), broadly categorized into hepatotoxins, neurotoxins and cytotoxins. Microcystins are present in the genera Microcystis, Planktothrix, Anabaena,and Nostoc,whereas Nodularin is present only in Nodularia (Hitzfeld et al., 2000). These cyanobacterial blooms accompanies unappealing odours and a pungent taste due to the presence of the chemical geosmin (Sember, 2002).
Ultrastructure of Microcystis cell
The protoplast of Microcystis cell is delimited by a tripartite plasmalemma outside which lie the cell wall made up of three uniform peptidoglycan layers and an outer proteinaceous S-layer. The S-layer constitutes about 10% of the total cyanobacterial protein and consists of crystalline arrays of protein or glycoprotein subunits forming oblique, square or hexagonal lattices on the cell surface. S-layers may serve as protective coats, molecular sieves and molecule and ion traps, cell adhesion and surface recognition structures and as frameworks that determine and maintains cellular shape and rigidity (Rachel et al., 1997).
The cyanobacterial cells (Figure 2.10) possess a number of cell inclusion bodies that may or may not have a limiting membrane but serve as energy reserves under certain culture conditions. These may include phycobilisomes, carboxysomes, glycogen granules, polyphosphate granules, poly-β –hydroxybutyrate granules, cyanophycin granules and gas vesicles.

Figure 2.10: General structure of Cyanobacterial cell
α glycogen α-granules, β high electron density lipid β-granules, CG cyanophycin granules, CM cytoplasmic membrane, Cs carboxysome, CW cell wall, GV gas vesicles, OM outer membrane, Pg peptidoglycan, PBS phycobilisome, Phb poly-β-hydroxybutyrate granules, Pi pili, PP polyphosphate granules, PS periplasmic space, R ribosomes, SS-layer, Sh sheath, Sp spines, T thylakoid(s), TM thylakoid membrane (Baulina, 2012).
Phycobilisomes: Cyanobacteria are aerobic phototrophic organisms that can perform photosynthesis as they possess Chlorophyll a and photosystem II. These photosynthetic pigments and electron transport chain components are situated in thylakoid membranes. Thylakoids in cyanobacteria are freely located in the cytoplasm arranged concentrically and equidistantly near to the cell periphery and are typically not stacked. Phycobilins are complex photoreceptor pigments seen attached to protein moieties by covalent bonds to the sulphur of cysteine residues forming phycobiliproteins. The light harvesting accessory pigments (phycobiliproteins) are located in phycobilisomes attached to the surface of thylakoids. Phycobilisomes pass the light energy to photosystem II for the splitting of water and generation of oxygen during photosynthesis. There are four types of phycobiliproteins that renders colour to cyanobacterial cells namely, allophycocyanin (absorption maximum at 650 – 680 nm), phycocyanin (620 – 635 nm), phycoerythrocyanin (575 nm) and phycoerythrin (545 – 565 nm). Cyanobacteria can alter the constituents of phycobiliproteins and the size of light harvesting antennae in accordance to the quality and quantity of light and other environmental factors. This chromatic adaptation help them in efficient light absorption and enhanced photosynthetic rates (Sember, 2002).
Carboxysomes: Carboxysomes (or polyhedral bodies) appear as black polyhedral bodies about 200-300 nm in diameter. They are made up of CO2-fixing enzymes like ribulose - 1, 5 - bisphosphate carboxylase oxygenase (RUBPC’ase or RuBisCO) and carbonic anhydrase that plays an important role in photosynthesis. These are found in large numbers under low carbondioxide concentrations (Sember, 2002).
Glycogen granules: Under light microscope, glycogen granules (or polyglucose bodies or cyanophycean starch) appear as white, irregularly spherical forms with a dimension of 16 x 33 nm. They are the first visible product of photosynthesis in cyanobacteria. These are located between the thylakoids and are made up of polysaccharide containing only glucose molecules with α-1,4 linkages and α-1,6 linked branched oligosaccharide chains. The accumulation of glycogen in cyanobacterial cells occur during nutrient deficient or slow growth conditions or at stationary phase, mainly when a huge utilizable carbon source is present in the aquatic system (Sejnohova, 2008; Reynolds et al, 1981).
Polyphosphate granules (volutin granules or metachromatic granules): Polyphosphate granules were observed independently by Paul Ernst (1888) and Victor Babes (1889) in bacterial cells, that can be stained with methylene blue or toluidine blue. These granules are aggregates of high molecular weight linear phosphate molecules with a size ranging from 100-400 nm in diameter. They are rich sources of phosphate, which plays a major role in the phospholipid and nucleic acid synthesis and serve as an energy source for ATP synthesis. They are thought to contain metals, mainly potassium, calcium, magnesium and some heavy metals. The polyphosphate bodies are formed in the presence of excess phosphate in the growth media and are found to decrease in large numbers in phosphorus deficient cells (Shively, 2006).
Poly-β –hydroxybutyrate granules (PHB): PHB is a lipid polymer that forms vesicles about 200 nm in diameter and has a limiting monolayer of 3 nm. These serve as storehouses of carbon and energy during nutrient stress conditions but in the presence of excess carbon source. The PHB helps Microcystis cells to survive during dark periods (Sejnohova, 2008).
Cyanophycin granules: These granules are high molecular weight with highly refractile bodies of diameter >1.0µm. Simon (1971) had isolated and tried to elucidate the chemical composition of cyanophycin granules. It is composed of co-polymers of aspartate and arginine (Shively, 2006). It serve as a store house of nitrogen and energy and accumulates in cells grown at low temperature, poor illumination intensities and also under phosphorus and sulfur deficient conditions, mainly in the late log phase of growth. They may also serve as a reserve carbon source under carbondioxide deficient conditions. Thus, the nutrient deprivation posed by cells is characterized by the accumulation of glycogen with decreased levels of structured granules and polyphosphate bodies.
Gas vesicles: They are minute, rigid and water proof hollow cylindrical structures with conical end caps. The wall of GVs are made up of proteins that are self-assembled to form firstly a biconical structure which enlarges to a critical diameter and then continues to grow by the extension of the cylindrical middle section. The GV in Microcystis sp. may reach to their maximum length of about 600 nm within 12 hours. The membrane of gas vesicles in Microcystis sp. are three layered, about 3 nm wide. In Microcystis sp., mainly two types of gas vesicle membrane protein are present – GvpA and GvpC. GvpA is the main hydrophobic small protein arranged in a linear crystalline array along ribs and forms the hollow shell of GV. GvpC is the large hydrophilic protein on the outer surface, which binds to GvpA and stabilizes the GV structure. The pores in the GV membrane are very small with a diameter of 0.36 nm. Thus, the surface of gas vesicles is freely permeable to gas molecules like H2, N2, O2, CO2, CO, CH4 and Ar, due to which the internal gas composition will be equal to the external gas composition present in the surrounding media. A reduction in the GV volume occurs at low pressure, whereas GV collapses and cells loose their buoyancy at high-pressure conditions (Visser et al, 2005).
Geosmin and MIB: Blue-green algae and actinomycetes produce or secrete certain volatile metabolites like 2-methylisoborneol (2- MIB) with a molecular weight of 168 g/mol and geosmin (trans-1, 10-dimethyl-trans-9-decalol) with a molecular weight of 182 g/mol, that imparts an earthy or musty odour even at extremely low level (ng/l). They are relatively stable to chemical and biological degradation and persist as dissolved form in water for longer periods. Geosmin (Figure 2.11) is trapped inside cells and are released at high concentrations upon death of the bacteria whereas, MIB is produced during their life cycle. Both of these volatile metabolites are detectable by human olfaction at concentrations of 5 ng/l for 2-MIB and 30 ng/l for geosmin (Juttner and Watson, 2007; Mamba et al., 2007; Smith et al., 2008).
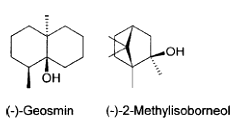
Figure 2.11: Structure of geosmin (C12H22O) and MIB (C11H20O)
Microcystins (MCYSTs): Cyanotoxins are produced in the actively growing cyanobacterial cells and are released into water bodies when the cells age and break down. They are readily soluble in water. The concentration of toxins will be higher in declining blooms (Chorus and Bartram, 1999). Microcystins (Figure 2.12) are potent hepato-toxins produced by many cyanobacterial genera like Microcystis, Nostoc, Anabaena, Planktothrix, Hapalosiphon, Anabaenopsis, Aphanizomenon ovalisporum. MCYSTs are cyclic heptapeptides with a molecular weight of 909 - 1067 Daltons. Microcystins are made up of five invariant amino acids that are not found in proteins and two variant amino acids found in proteins. MCYSTs have the general structure: cyclo (– D-Ala(1)– X(2)–D-MeAsp(3)– Z(4)– Adda(5)–D-Glu(6)–Mdha(7)), where, X and Z are variable L-amino acids, D-Ala and D- Glu are alanine and glutamic acid (in D - configuration) respectively. D-MeAsp is D-erythro-β-methyl-aspartic acid, Mdha is N-methyl-dehydroalanine and Adda is a novel amino acid (2S, 3S, 8S, 9S)-3-amino-9-methoxy - 2, 6, 8-trimethyl-10-phenyldeca-4, 6-dienoic acid. About 70 structural variants of MCYSTs are present. Microcystins are named by their two variant protein amino acids. For example, microcystin-LR (MC-LR) refers to microcystin containing the amino acids leucine (L) and arginine (R), MC-YR refers to tyrosine (Y) and arginine (R) and MC- RR indicates 2 arginine (R) amino acids. MC-LR is the most common and toxic microcystin than the other variants (Dietrich and Hoeger, 2005 and Hu et al., 2009; Butler et al, 2009).
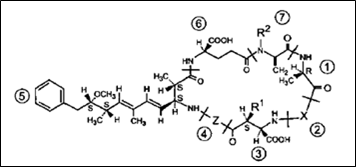
Figure 2.12: General structure of microcystins
Table 2.11: Different types of Microcystins
Name |
X-position Amino Acid |
Z-position Amino Acid |
Molecular Weight |
Microcystin LA |
Leucine (L) |
Alanine (A) |
910.06 |
Microcystin YR |
Tyrosine (Y) |
Arginine (R) |
1045.19 |
Microcystin RR |
Arginine (R) |
Arginine (R) |
1038.2 |
Microcystin LR |
Leucine (L) |
Arginine (R) |
995.17 |
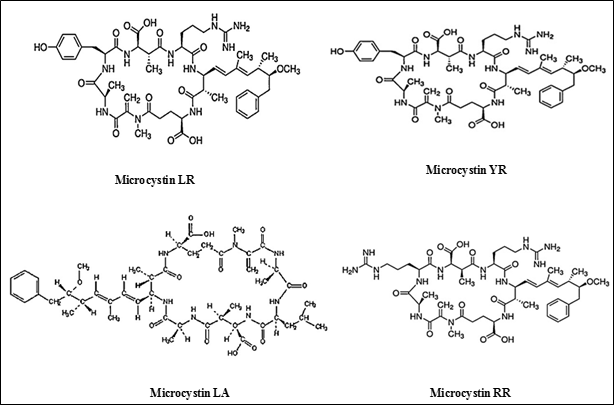
Figure 2.13: Chemical structure of different MCYNs (Babica, 2006; Tran et al., 2013)
Microcystins can persist for months or even years in natural waters without light. They are extremely stable in water and can tolerate periodic changes in water chemistry, including pH. They remain potent even after boiling. A decline in the microcystin concentration occurs under conditions such as dilution of water bodies, photolysis, biological degradation and decomposition triggered by altered temperature and pH. The variations in day length, temperature, wind mixing, rainfall, flushing and nutrient loading rates also affects phytoplankton distribution and species diversity, including bloom formation in water bodies. Ni et al., 2012 found that MCYST concentrations were positively correlated to water temperature, TP, Chl-a, cyanobacteria biovolume and Microcystis biovolume and negatively correlated to TN, TN/TP ratios, DO, and conductivity. Thus, the control of TP can mitigate cyanobacteria dominance and microcystin production in lakes during summer.
MCYSTs enter the human body through ingestion of food and water (plants, fish, shellfish etc.) and to a lesser extent, through inhalation and skin contact. The exposure to cyanotoxins can cause short-term health effects including nausea, vomiting, rashes, eye and ear irritation and fever. The inactivation of protein phosphatases disturbs the normal cell function and induces cell proliferation and cancer production. The death of animals occur due to severe liver damage as a result of cytoskeletal disorganization which includes cell blebbing, cellular disruption, DNA damage, lipid peroxidation, loss of membrane integrity, necrosis, apoptosis, intraheptic bleeding and hemorrhagic shock (Agrawal et al., 2006; Hu et al., 2009). The MC helps in defense mechanism against plankton grazers, ferrous iron (Fe2+) chelation and allelopathic function related to cyanobacterial interactions with phytoplankton, zooplankton and bacteria in an aquatic ecosystem (Gagala, 2012).
Effects of Microcystin (MCYST) in living organisms: Microcystin (MCYST) enters into the tissues of fishes either actively during feeding or passively through the gills during breathing. MCYST released into the water bodies by cyanobacteria get accumulated in consumers at higher trophic levels of food chain. The consumption of these MCYST exposed or affected fishes may pose a great threat to human beings (Vasconcelos et al., 2013). Hepatocyte rounding, derangement of hepatic architecture and progressive necrosis of liver was observed due to microcystin concentration injected intra-peritoneally as well as in gavage trials conducted in rainbow trout or Oncorhynchus mykiss (Tencalla et al., 1994). The MCYST concentrations in water of lakes Doirani, Kastoria, Koronia, Pamvotis, Mikri Prespa Petron and Zazari were above the WHO guide level for drinking water. The results suggest that it is unsafe to consume Carassius gibelio harvested in lakes Koronia, Kastoria, Pamvotis, and Mikri Prespa due to the high concentration of accumulated MCYST in their tissues. Among all tissues of C. gibelio, liver and kidney had the highest average content of MCYST (124.4 ± 23.4 ng/g and 63.3 ± 12.2 ng/g, respectively), followed by brain, intestine and ovaries (43.8 ± 10.2 ng/g, 35.3 ± 15.7 ng/g and 9.27 ±5.2 ng/g, respectively). Muscle had the lowest values (7.1 ± 2.5 ng/g) (Papadimitriou et al., 2009).
Two Microcystis sp. i.e. Microcystis aeruginosa and M. ichthyoblabe dominated water bloom (total microcystins in the cyanobacterial biomass ranged from 1,187–1,211 µg/g dry weight which corresponded to 17.4–25.4 µg of total microcystin/l of water) resulted in significant microcystin accumulation in the hepatopancreas (350 ng/g fresh weight) whereas, its concentration in muscle were generally below the detection limit (2 ng/g fresh weight) of Nile tilapia (Oreochromis niloticus). The basic parameters of the dietetic quality (i.e. dry matter, ash, content of proteins and fats) were not significantly affected by the exposure to cyanobacteria (Palikova et al., 2011). The hatching rate of zebrafish embryos was strongly inhibited or decreased with high MCYST (200 μg/l) crude extracts. The mortality rate of the zebrafish larvae increased after 11 days of incubation even though, they were grown in non-toxic medium. Non-MCYST crude extract and 50 μg MCYST/l did not show any inhibitory effects on their hatching rate. The malformation of the fish embryos and larvae occurred during the experiments (Dao et al., 2013).
Microcystin accumulated in the fish, Oreochromis niloticus ranging from 16.01 - 37.09 ng/g in muscle and 228.2 - 804.0 µg/g in liver and exhibited potential mutagenic effects. Microcystin level in the fish was well above the WHO (0.04 mg/kg body weight/d) tolerable daily intake, indicating a serious risk to consumers (Vasconcelos et al., 2013; Pouria et al., 1998). Lake Karla supported cyanobacterial species such as Anabaenopsis elenkinii, Sphaerospermopsis and Planktothrix agardhii, which produces MCYST. MCYST were detected in the tissues of the species Cyprinus carpio in the following order: liver>kidney>brain>intestine>muscles, which suggest a high risk for fish consumption and the lake water is not apt for recreational activities (Papadimitriou et al., 2013). Toxin producing cyanobacterial blooms are an important water quality issue in zoos. The death of yellow-bellied slider (Trachemys scripta scripta), bighorn sheep (Ovis canadensis) and stillborn elephant (Loxodonta africana) calf had microcystin concentrations of 166 ng/g, 0.5 ng/g and <0.3 ng/g respectively, in the liver (Doster et al., 2014). A dog exposed to toxin producing Microcystis sp., developed lethargy and anorexia within hours of exposure and then showed symptoms like severe depression, vomiting, etc. (Rankin et al., 2013).
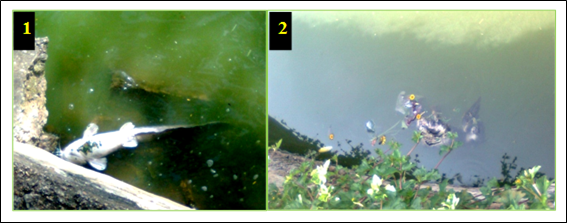
Figure 2.14: Death of fish (1) and duck (2) in the Sankey lake, August (2013)
In August (2013), large scale fish mortality occurred at Sankey lake (Figure 2.14). The different factors affecting fish death are oxygen depletion, toxic algal blooms and sudden changes in temperature, salinity and light availability. Certain infections by bacteria, fungi, virus and parasites also cause fish death. Fish death due to oxygen depletion occurs when the algae bloom die-off, lower photosyn thetic activities and increased microbial respiration in lakes.
Metabolites of Microcystis aeruginosa: Cyanobacteria produce some secondary metabolites, which possess anti-viral as well as anti-bacterial activities. Nowotny et al., (1997) reported of the antiviral activity of Microcystis aeruginosa against influenza-A virus. About, 11µg dry extract/ml of crude aqueous extract of Microcystis accounted for about 50% inhibition of virus replication in MDCK cell. Ishida et al, (1997) isolated Microcystis sp. from Lake Kawaguchi and cultured under laboratory conditions and then isolated and structurally elucidated Kawaguchipeptin B (C58H76N16O18), colourless amorphous powder on the basis of 2D NMR data and chemical degradation. It was found that Kawaguchipeptin B exhibited antibacterial activity and thus, inhibited the growth of the Gram positive bacteria, Staphylococcus aureus at a concentration of 1 µg/ml (MIC).
Zainuddin et al, 2002 evaluated the antiviral activity of aqueous and methanolic extracts of several genera of cyanobacteria like Microcystis, Nodularia, Oscillatoria, Scytonema, Lyngbya and Calothrix against influenza-A virus in Madin Darby canine kidney cells. The extracts were nontoxic to MDCK cells. The inhibitory concentration (IC50) of antiviral activity ranged between 20 to 79µg/ml. The extract of Microcystis sp. was most effective. The methanolic extracts of M. aeruginosa, M. ichthyoblabe and M. wesenbergii showed notable antiviral activity against influenza-A virus with survival rate of cells of 73.0%, 45.9% and 55.4%, respectively. This effect was associated with protease inhibitory activity of approximately 90%, which could be the plausible reason for the reduction of viral replication.
Cyanopeptolin954 and Nostopeptin BN920 isolated from Microcystis aeruginosa inhibited the bovine chymotrypsin with an IC50 value of 44.5 and 31.2 nM respectively. These compounds also showed protease inhibitor activity (Von Elert et al., 2005). Kisugi and Okino, (2009) isolated four different micropeptins from Microcystis aeruginosa and elucidated their structure. Micropeptins C (C53H69N7O14), D (C55H73N7O14), E (C50H71N7O14), and F (C52H75N7O14) inhibited chymotrypsin with IC50’s of 1.1, 1.2, 1.0 and 1.5μg/ml respectively. These peptides did not inhibit trypsin and thrombin at 20μg/ml. Yamaki et al., (2005) also structurally elucidated two new chymotrypsin inhibitors by the analyses of 1D and 2D NMR spectra, and chemical degradation methods, namely Micropeptins 88-N and 88-Y from Microcystis aeruginosa.
M. aeruginosa can produce a natural BHT (butylated hydroxytoluene) which exhibits the antioxidant activity. Synthetic antioxidants are added to food products to prevent lipid oxidation caused due to the presence of reactive oxygen species (ROS) such as superoxide anion, hydrogen peroxide and hydroxyl radicals. ROS decreases the nutritional value and appearance of food. The increased production of BHT was achieved in cultures grown under the highest irradiances (150 µmolphotons/m2/s). The production of BHT in cells is light dependent and thus protects the cells from photooxidation (Babu, 2008). M. aeruginosa can degrade many organophosphorous and organochlorine insecticides present in the aquatic ecosystem (Vijayakumar, 2012).
Life cycle of Microcystis aeruginosa: The life cycle of M. aeruginosa includes four phases (figure 2.15): Overwintering (winter), Reinvasion (spring), Bloom formation (summer) and Sinking (autumn). These stages appear due to changes in the buoyancy of cells as well as marked seasonal variations. The cyanobacterial cells are denser than water (998 kg/m3 at 20°C). The densities of major constituents like protein, carbohydrate and glycolipid of M. aeruginosa cells are 1330 kg/m3, 1600 kg/m3and 1050 kg/m3 respectively, which makes cell denser than water. The cellular water content accounts to about 70 – 80% of wet mass of the cell. Therefore, in order to reduce the density of cells, they accumulate large amount of gas vesicles. The buoyancy of cells also depends on irradiance, accumulation of storage products (eg. polyphosphate bodies) and nutrient availability (Sember, 2002).
Figure 2.15: Life cycle of M. aeruginosa cell

When the M. aeruginosa cells become over buoyant due to low light intensities, about 10% of cell protein encodes for the production of gas vesicles. The accumulation of carbohydrates at reduced temperature conditions may be a cause for reduced rate of protein synthesis during the light period. The sedimentation of Microcystis sp. cells during autumn may be due to increased carbohydrate levels and decreased buoyancy at lower temperatures. Cyanobacterial cells with gas vacuoles become buoyant on exposure to low irradiances (at night) and then loose their buoyancy at high irradiances (daytime). Buoyancy of cells also increases at high nutrient (phosphorus or nitrogen) conditions and vice versa.
After the reinvasion of benthic colonies to the water column during spring, about 20% of overwintering benthic stock get entrapped in the lake sediments and thus serves as an inoculum for the next algal population that develops during summer (Sejnohova, 2008). The recruitment of colonies depend on several factors like number of cells that had overwintered to the lake bottom, resting period of colonies in the hypolimnion and the development of favorable environmental conditions for recruitment. The initiation of bloom formation in aquatic bodies occurs when favorable environmental conditions return like increasing light and temperature conditions, low N: P ratio, prevalence of anoxic environment and limitation of CO2. As M. aeruginosa cells depend on endogenous respiration of stored carbohydrates, they are able to survive prolonged dark periods. The autumnal sedimentation also occurs due to the co-precipitation of buoyant cells with suspended particles like clay and iron compounds. A yellow colour precipitate is formed when reduced iron compounds that are soluble in anaerobic water of hypolimnion become oxidized upon aeration or mixing of water from epilimnion. This precipitate sticks to the cells of blue green algae and allows them to sink to the bottom (Reynolds et al, 1981; Sejnohova, 2008; Sember, 2002).
Measures to control cyanobacterial growth in lakes:
Chorus and Bartram (1999), Drabkova (2007) and Teichreb (2012) focused on the effectiveness, advantages and limitations of various management strategies to be adopted for the control of Cyanobacteial bloom in lakes, which includes both the watershed control and in-lake controls.
- Arresting nutrient entry to the lake: Watershed controls help to prevent the delivery of nutrients (mainly phosphorus and nitrogen) to a lake from non-point (runoff, etc.) and point sources (municipal wastewater). It includes implementing improved stormwater treatment, riparian restoration, development of wastewater lines and suitable tanks and adopting wetlands best management practices.
- Improving aeration: The physical control involves the physical modification of in-lake elements to remove accumulated nutrients or disturbing the conditions that are favourable for Cyanobacterial growth. These include strategies so as to achieve increased circulation (using air or water to prevent thermal stratification); dilution (reduces nutrient levels without altering the load) and flushing (to minimize response to pollutants and algal growth); dredging (removal of sediments by wet or dry excavation and its deposition in a containment area for dewatering); creating light limiting conditions in lakes by the use of light-limiting; water- soluble dyes and surface covers (opaque sheet material) and mechanical removal of blooms from water bodies by using booms, nets or other devices.
- Chemical control involves the application of certain chemicals to destroy algal cells and lower nutrient levels to prevent excessive algal growth. These include application of algaecides, aeration or oxygenation of the water column (to maintain oxic conditions and stratification), phosphorus inactivation (using the salts of aluminium, iron or calcium) and sediment oxidation (addition of oxidants, binders and pH adjusters so as to oxidize sediment, reduce phosphorus supply to algae, alters N:P ratio and decreases sediment oxygen demand). The algaecides mainly used includes liquid or granular formulations of copper in conjunction with chelators, polymers, surfactants or herbicides (cellular toxicant that disrupts photosynthesis, nitrogen metabolism and cellular membrane transport); synthetic organic herbicides (disrupts cell metabolism and structural deterioration) and oxidants (attacks membranes and disrupts cell functions). Mostly, chemical controls are inapplicable to aquatic ecosystems harboring various fish communities.
- The biological controls comprises of modification of the biological components of an aquatic ecosystem to produce unfavourable conditions that will affect growth of the dominant and harmful algae and to achieve grazing control over algae. These may include enhanced grazing by stocking zooplankton species, introduction of bottom-feeding fish and inoculation of pathogens.
Xie and Liu, 2001 suggested the applicability of a new food-web manipulation for eliminating and controlling the unsightly and odorous cyanobacterial blooms in hypereutrophic lakes by increasing the filter-feeding silver and bighead carp through stocking. Both silver and bighead carp are filter-feeders that collect food by passing water through their filtering apparatus and feeds on phytoplankton, suspended detritus, and also zooplankton. This new integrated method is applicable to nutrient rich lakes where nutrient inputs cannot be reduced effectively and where zooplankton cannot control the massive phytoplankton production. In the hypereutrophic and subtropical lake, Donghu, Microcystis surface blooms did not occur even though abundant P and N were present in the lake which was due to the high grazing pressure by silver and bighead carp (Xie et al., 2003).
The control measures taken so far have their own advantages and disadvantages as well as varied in their own efficiencies. Visser et al., (2005) suggested three different ways to control the excessive growth of Microcystis sp. in different aquatic ecosystems. These include: (a) destroying or collapsing of the gas vesicles by using pressure devices like ultrasonic transducer, explosives and deep concentric pipes, so that the cells may sink to the aphotic zone where they will not be able to recover buoyancy and rejoin the population in the epilimnion; (b) artificial mixing of water reduces Microcystis biomass as it in turn, affects the cellular buoyancy. A shift in the cyanobacterial dominance to negatively buoyant green algae and diatoms was observed as the artificial mixing reduced their sedimentation losses and also lowered the pH thus increasing the carbondioxide (CO2) levels; (c) reducing the phosphorus (P) loading in lakes.
Oberholster et al., (2004) suggested artificial water mixing of Sheldon lake using aerators placed at the bottom of the lake, so as to manipulate the physical environment, thus, making it less favourable for the cyanobacterial growth and more favourable for the growth of other algal species. A pilot study done by Magrann et al., (2012) achieved about 97% reduction in Microcystis cells, 72% reduction in chlorophyll-a, and 96% reduction in phosphate content in Mason lake water using the Blue ProTM water treatment facility. Daly et al., 2007 discouraged the use of chlorine as a pretreatment step to conventional water treatment as it causes cell lysis in Microcystis sp (by exposure to 7-29 mgmin/l chlorine) and releases the microcystin toxins. Chlorine degraded the microcystin toxin released from the cells but it depends on the pH conditions, exposure time and abundance of Cyanobacterial cells. Aluminum sulphate (at concentrations used in water treatment practice) and mechanical stirring did not damage the cell integrity of cultured M. aeruginosa cells and additional release of microcystin was not evident. However, the water treatment through alum flocculation resulted in the efficient removal of M. aeruginosa cells without any release of toxin (Chow et al., 1999). Hoeger et al., (2002) concluded that the provision of safe drinking water from surface waters can only be ensured through regular monitoring of total organic carbon (TOC)/dissolved organic carbon (DOC), residual ozone concentration in conjunction with efficient filtration steps and determination of Cyanobacterial cell densities. TOC or DOC is one of the most important factors found to affect the ozonation capacity. They suggested water treatment with ozone concentrations of at least 1.5 mg/l to provide enough oxidation potential to destroy the toxin present in about 5 x 10⁵Microcystis aeruginosa cells/ml [total organic carbon (TOC), 1.56 mg/l]. The presence of high TOC in water reduced the efficiency of oxidation and destruction of toxin. The ozonation of raw waters having high Cyanobacteria cell densities will result in cell lysis and liberation of intracellular toxins. Another method for the effective removal of cyanobacterial bloom is the use of H2O2 for the treatment of lake water. The H2O2 has algaecidal activity causing disaggregation of larger Microcystis colonies to smaller ones with the dissociation of PBS (phycobilisomes) from the thylakoid membrane in PSII core complexes. Thus, PSII gets irreversibly inactivated and the existing Microcystis population could not serve as an inoculum for the next bloom. After H2O2 treatment, further removal of H2O2-inactivated Microcystis colonies was through flocculation and sedimentation of the cells by the addition of lake sediment clay (2 g/l) and polymeric ferric sulfate (20 mg/l). This integrated method enhanced the DO levels in lake sediment (Wang et al., 2012).
Jurczak et al., (2005) estimated the efficiency of water treatment processes in the removal of microcystins. The continuous and stepwise water treatment processes like preoxidation, coagulation, sand filtration, ozonation and chlorination were done in the Sulejow-Lodz waterworks system, whereas, coagulation, sedimentation, sand filtration, ozonation and chlorination were done in the Tomaszow-Lodz waterworks system. These stepwise treatments were effective in the elimination of extracellular and cell-bound microcystins in both the water systems.
Nanotechnology can provide novel nanomaterials for treatment of surface water, groundwater, and wastewater contaminated by toxic metal ions, organic and inorganic solutes and microorganisms. These include production of nanomaterials for water filtration, remediation and disinfection. The nanomaterials developed for water remediation include Biopolymers, Carbon nanotubes, Iron nanoparticles, Zeolites etc. The microcystin variants are removed to above 90%, whereas, Geosmin and 2 methylisoborneol (MIB) are effectively removed about >75% by tight nanofiltration (NF) membranes (Jain, 2012).
Sui et al, 2014 synthesized the Ag3PO4 photocatalyst and checked the degradation capacity of Ag3PO4 for MC-LR under visible light. Ag3PO4 catalysts were found to exhibit the best photocatalytic performance for MC-LR degradation (99.98% within 5 hours) at pH of 5.01, Ag3PO4 concentration of 26.67 g/l and MC-LR concentration of 9.06 mg/l. They also proposed 3 main degradation pathways of microcystin, based on the molecular weight of the intermediates and the reaction mechanism: (1) hydroxylation on the aromatic ring of Adda, (2) hydroxylation on the diene bonds of Adda and (3) internal interactions on the cyclic structure of MC-LR.
Jiang et al., 2010, studied the M. aeruginosa removal efficiency of polyferric chloride (PFC), magnetic nanoparticles/PFC (MPFC) and magnetic Fe3O4 under different initial pH conditions and coagulant dosages. The removal mechanism of PFC and magnetite suspensions was through charge neutralization and adsorption, induced by electrostatic attraction respectively. In case of MPFC, the removal of M. aeruginosa occurs through the combined effect of PFC and magnetic nanoparticles. The magnetic nanoparticles in MPFC enhance the efficiency of coagulation by inducing the formation of large and magnetic flocs with fast settling velocity through adsorption. The added magnetic nanoparticles adsorbs and surrounds natural organic matter (NOM) and easily settles down and then nanoparticles and iron polymers together act on the M. aeruginosa cells and result in better removal efficiency.
The ability of bacteria in degradation and removal of microcystin has studied earlier. The ability of specific strains of probiotic bacteria to remove the cyanobacterial peptide toxin microcystin-LR from aqueous solutions was determined by Nybom et al., 2007. Lactobacillus rhamnosus strains GG and LC-705, Bifidobacterium longum 46, Bifidobacterium lactis 420 and Bifidobacterium lactis Bb12 has found to be most effective in toxin removal. Bifidobacterium lactis Bb12 showed the highest removal percentage of microcystin-LR i.e. 58.1%. The removal of microcystin-LR was dependent on both temperature and bacterial concentration.
Lee et al., 2006 assessed the degradation of microcystin by bacteria adsorbed on GAC (granular active carbon) filter from a water treatment system. About, 90% of toxin got degraded within 9-10 days and about 99% of toxin degraded within 18-21 days. This biological degradation along with the existing purification systems could increase the efficiency of water purification. A similar study carried out by Manage et al., (2009) to assess the degree of biodegradation of microcystin-LR by natural microbial populations isolated from Loch Rescobie, Forfar Loch and river Carron under aerobic conditions. About 3 strains from Forfar Loch, 4 strains from Loch Rescobie and 2 strains from river Carron showed strong MC-LR degradability when they were grown at three different concentrations of MC-LR (10 μg/ml, 1.0 μg/ml and 0.1 μg/ml) as sole carbon source.
All these control measures have disadvantages such as: (a) causes cell lysis resulting in the release of toxins into the water body; (b) they may be toxic to non-target species; (c) may disrupt ecological functions; (d) increases oxygen demand; (e) brings about fluctuations in the water chemistry during the treatment; (f) may be toxic to aquatic flora and fauna; (g) the excessive use of these chemicals in turn results in its accumulation in the tank or lake (Teichreb, 2012).
These reviewed control measures has both merit as well as demerits. Best options for Sankey lake are (i) letting only treated sewage to the lake, (ii) provision of wetlands and algal ponds to remove nutrients and (iii) improving aeration in the lake, (iv) removal of phosphates trapped in sediments through de-silting of the lake (wet dreadging). Excessive nutrient and organic inputs from anthropogenic activities into lakes and their watersheds lead to eutrophication, characterized by increase in phytoplankton biomass, nuisance algal blooms, loss of water clarity from increased primary production and loss of oxygen in bottom waters (Ramachandra, 2009b). The ability of microalgae in efficient removal of nutrients like nitrogen, phosphorus and toxic metals under controlled environmental conditions and from a wide variety of wastewaters is well known. The algae grown in wastewater are suitable for biodiesel production due to their higher growth rate, requiring lesser area for cultivation and higher content of essential fatty acids and biomass production efficiencies (Ramachandra et al., 2013).
Water hyacinth in aquatic ecosystems are found to be capable of removing high levels of BOD, suspended solids (SS), nitrogen and phosphorus. Duckweeds have the ability to remove the organic materials because of their ability to use simple organic compounds directly and form carbohydrates and various amino acids or proteins. Thus, the nutrient removal from water bodies in turn reduces the risk of harmful phytoplankton overgrowth (Abdel-Raouf et al., 2012).
Aeration introduces air into water, thus, increasing the oxygen content of lakes and reducing the carbon dioxide content. Aeration also removes hydrogen sulphide, methane and various volatile organic compounds responsible for bad taste and odour in lakes. The harmful algal blooms deplete nutrients and causes shading effects that allow poor light penetration in lakes or ponds, resulting in the death of other algal groups and other aquatic organisms, which later on sink to the bottom and promotes high bacterial growth and activity. When there is a lesser rate of photosynthetic (O2 producing) activity and higher rate of microbial respiration (O2 consuming) in lakes, oxygen depletion occurs. This oxygen deficiency can be tackled mainly through aeration in lake. Aeration improves the quality of water used for domestic and industrial purposes and decreases the treatment costs. Aeration also provides an aerobic environment for the degradation of organic matter by microorganisms and allows them to come in close contact with the organic matter. In order to meet the growing demands for water (domestic, irrigational and industrial purposes), the fresh water resources should be properly maintained, restored and conserved. Different laws indirectly protect wetlands in India:
- The Indian Fisheries Act - 1857
- The Indian Forest Act - 1927
- Wildlife (Protection) Act - 1972
- Water (Prevention and Control of Pollution) Act - 1974
- Territorial Water, Continental Shelf, Exclusive Economic Zone and other Marine Zones Act - 1976
- Water (Prevention and Control of Pollution) Act - 1977
- Maritime Zone of India (Regulation and fishing by foreign vessels) Act - 1980
- Forest (Conservation act) - 1980
- Environmental (Protection) Act - 1986
- Coastal Zone Regulation Notification – 1991
- Wildlife (Protection) Amendment Act - 1991
- National Conservation Strategy and Policy Statement on Environment and Development – 1992
- Wetlands Regulatory Framework 2008 (Wetland Conservation Rules)
In addition, India is a signatory to the Ramsar Convention on Wetlands and the Convention of Biological Diversity. This necessitates conservation of the ecological character of various aquatic ecosystems along with its associated varied biodiversity of flora and fauna (Ramachandra, 2009a).
CONCLUSION
The taste and odour problems due to massive cyanobacterial growth as well as fish death in Sankey Lake have affected its aesthetic value. The analysis of physicochemical characteristics and the phytoplankton communities present in Sankey lake revealed excessive nutrient entry due to sewage, thereby bringing about a change in its physico-chemical properties and promoting the growth of phytoplanktons. Microcystis sp. was present throughout the study period at all the three sites. The excessive growth of toxin producing cyanobacteria like Microcystis sp., Planktothrix sp. and Merismopedia sp. may produce harmful effects to all other aquatic plants and animals. The algal species like Microcystis sp., Planktothrix sp., Chlorella sp., Scenedesmus sp. and Nitzschia sp. are indicators of organic pollution. The sewage entry to the lake should be stopped as an immediate step to control the excessive growth of Cyanobacteria in Sankey Lake. The PCA results revealed that TDS, EC and COD are the major factors governing water quality and indicate the presence of organic matter in the lake water. The CCA results showed that COD, DO, sodium and potassium, mostly influence Cyanophyceae growth. The growth of Cyanophyceae inhibited the growth of other algal genera like Bacillariophyceae and Chlorophyceae. After the introduction of aerators, DO, total hardness, alkalinity and nitrate levels had increased gradually. The application of various control measures to the lakes depends on the area of the lake, the biotic components present including the fishes. Even though, many control measures for preventing Cyanobacterial growth was developed, its related problems in water bodies was not solved yet.
RECOMMENDATION
- Regular monitoring of the lake for assessing its water quality and for taking precautionary measures.
- Aeration will help in maintaining high dissolved oxygen levels and likely reduction in toxic effect.
- Avoid entry of sewage into the lake, which brings in excess nutrients that induces profuse algal growth.
- Leave only treated sewage through construction wetlands and algal ponds (to remove nutrients)
- Removal of sediments accumulated over a period, which is rich in the phosphorus (P), nitrogen (N) and carbon (C).
- The harvesting and removal of cyanobacterial biomass during the early morning (when the algal scum is concentrated and at the top layer of water) through fine pore nets and pumping of the concentrated scums.
- Introduction of Herbivorous fishes like silver carp (Hypophthalmichthys molitrix) and bighead carp (Aristichthys nobilis).
- Avoid sewage entry, throwing of solid wastes to the lake and frequent fish feeding by the local people.
- Ensure proper evaluation of inflow to the lake and proper maintenance of outflow.
- Public awareness and public participation is necessary.
REFERENCES
- Abdel-Raouf, N., Al-Homaidan, A. A., and Ibraheem, I. B. M., 2012, Microalgae and wastewater treatment. Saudi Journal of Biological Sciences, Vol. 19, pp. 257-275.
- Agrawal, M. K., Ghosh, S. K., Bagchi, D., Weckesser, J., Erhard, M., and Bagchi, S. N., 2006, Occurrence of microcystin-containing toxic water blooms in Central India. Journal of Microbiology and Biotechnology, Vol. 16(2), pp. 212-218.
- Alobaidy, M. H. A., Al-Sameraiy, A. M., Kadhem, J. A., and Majeed, A. A., 2010, Evaluation of treated municipal wastewater quality for irrigation. Journal of Environmental Protection, Vol. 1, pp. 216-225.
- Aneesh, C., and Manilal, V. B., 2013, Continuous presence of colony forming Microcystis and Scenedesmus in fresh water lake and ponds. Botany Research International, Vol. 6(1), pp. 07-12.
- Ansari, M. F., Ankalgi, R. F., and Ankalgi, S. R., 2008, Studies on physico-chemical aspects and plankton of Unkal lake at Hubli (Karnataka, India). The 12th World Lake Conference, pp.1687-1694.
- APHA, Standard methods for the examination of water and wastewater. American Public Health Association, American Water Works Association, Water Environment Federation, Washington DC, 1998.
- Babica, P., Environmental and ecotoxicological aspects of cyanobacterial toxins – microcystins. Dissertation thesis in environmental chemistry, Masaryk University, Research Centre for Environmental Chemistry and Ecotoxicology Brno, Czech Republic, 2006.
- Babu, B., 2008, Production of natural butylated hydroxytoluene as an antioxidant by freshwater phytoplankton. Journal of Phycology, Vol. 44, pp. 1447-1454.
- Backer, L. C., McNeel, S. V., Barber, T., Kirkpatrick, B., Williams, C., Irvin, M., Zhou, Y., Johnson, T. B., Nierenberg, K., Aubel, M., LePrell, R., Chapman, A., Foss, A., Corum, S., Hill, V. R., Kieszak, S. M., and Cheng,Y. S., 2009, Recreational exposure to microcystins during algal blooms in two California lakes. Toxicon xxx, pp. 1-13.
- Baulina, O. I., 2012, Ultrastructural plasticity of cyanobacteria under dark and high light intensity conditions: In ultrastructural plasticity of cyanobacteria. Springer Berlin Heidelberg, pp. 11-63.
- Benjamin, R., Chakrapani, B. K., Devashish, K., Nagaratna, A. V., and Ramachandra, T. V., 1996, Fish mortality in Bangalore lakes. India. Electronic Green Journal, Vol. 1(6).
- BIS, Drinking Water Specification IS: 10500: 1991. First Revision, Bureau of Indian Standards, India, 1992.
- Brunberg, K. A., and Blomqvist, P., 2002, Benthic overwintering of Microcystis colonies under different environmental conditions. Journal of Plankton Research, Vol. 24(11), pp. 1247-1252.
- Butler, N., Carlisle, J., Linville, R., and Washburn, B., Microcystins: A brief overview of their toxicity and effects, with special reference to fish, wildlife, and livestock. Ecotoxicology Program, Integrated Risk Assessment Branch, Office of Environmental Health Hazard Assessment, California Environmental Protection Agency, 2009.
- Chandra, S., Singh, A., and Tomar, K. P., 2012, Assessment of water quality values in Porur lake Chennai, Hussain Sagar Hyderabad and Vihar lake Mumbai, India. Chemical Science Transactions, Vol. 1(3), pp. 508-515.
- Chapman, D., Water quality assessment- A guide to use of biota, sediments and water in environmental monitoring. 2nd eds., Chapman on Behalf of UNESCO, WHO and UNEP, Chapman and Hall, London, 1992.
- Chatfield, C., and Collin, A. J., Introduction to multivariate analysis. Published in the USA by Chapman and Hall in Association with Methuen, Inc. 733 Third Avenue, New York NY, 1980.
- Chen, Y., Qin, B., Teubner, K., and Dokulil, M. T., 2003, Long-term dynamics of phytoplankton assemblages: Microcystis-domination in lake Taihu, a large shallow lake in China. Journal of Plankton Research, Vol. 25(1), pp. 445-453.
- Chorus, I., and Bartram, J. (Eds.), Toxic cyanobacteria in water: A Guide to their Public Health Consequences, Monitoring and Management, WHO and E & FN Spon, London, 1999.
- Chow, C., Drikas, M., House, J., Burch, M., and Velzeboer, R., 1999, The impact of conventional water treatment processes on cells of the cyanobacterium Microcystis aeruginosa. Water Research, Vol. 33(15), pp. 3253-3262.
- Daly, R., Lionel, and Brookes, D. J., 2007, Effect of chlorination on Microcystis aeruginosa cell integrity and subsequent microcystin release and degradation. Environmental Science and. Technology, Vol. 41, pp. 4447-4453.
- Dao, T. S., Tran, T. L., Pham, T. L., Do-Hong, L. C., and Nguyen, P. D., 2013, Impacts of cyanobacterial toxins from Dau Tieng Reservoir, Vietnam, on the early life stage of Zebrafish. 4th International Conference on Biology, Environment and Chemistry IPCBEE, IACSIT Press, Singapore, Vol. 58, pp. 41-46.
- Desikachary, T.V., Cyanophyta. Indian Council of Agricultural Research, New Delhi, 1959.
- Dietrich, D., and Hoeger, S., 2005, Guidance values for microcystins in water and cyanobacterial supplement products (blue-green algal supplements): A reasonable or misguided approach. Toxicology and Applied Pharmacology, Vol. 203(3), pp. 273-289.
- Dokulil, M., and Teubner, K., 2000, Cyanobacterial dominance in lakes. Hydrobiologia, Vol. 438, pp. 1-12.
- Doster, E., Chislock, M. F., Roberts, J. F., Kottwitz, J. J., and Wilson, A. E., 2014, Recognition of an important water quality issue at zoos: Prevalence and potential threat of toxic cyanobacteria. Journal of Zoo and Wildlife Medicine, Vol. 45(1), pp. 174-177.
- Downing, J., Watson, S., and Mc Cauley, E., 2001, Predicting cyanobacteria dominance in lakes. Canadian Journal of Fisheries and Aquatic Sciences, Vol. 58, pp. 1905-1908.
- Drabkova, M., Methods for control of the cyanobacterial blooms development in lakes. Ph.D thesis, Masaryk University, Research Centre for Environmental Chemistry and Ecotoxicology, Brno, Czech Republic, 2007.
- Durborow, R. M., Crosby, D. M., and Brunson, M. W., 1997, Ammonia in Fish Ponds. Southern Regional Aquaculture Center (SRAC).
- Feng, J., Wang, F. and Xie, S., 2011, Structure and dynamics of the periphytic algae of Jinyang lake in Shanxi province, North China. Acta Ecologica Sinica, Vol. 31, pp. 310-316.
- Gagala, I., and Mankiewicz, B. J., 2012, The natural degradation of Microcystins (cyanobacterial hepatotoxins) in fresh water – the future of modern treatment systems and water quality improvement. Polish Journal of Environmental Studies, Vol. 21(5), pp. 1125-1139.
- Gandhi, K. T., 2012, A study of water quality parameters to better manage our ponds or lakes. International Journal of Latest Research in Science and Technology, Vol. 1(4), pp. 359-363.
- Garg, J., and Garg, H. K., 2002, Nutrient loading and its consequences in a lake ecosystem. Tropical Ecology, Vol. 43(2), pp. 355-358.
- Hargreaves, J. A., and Tucker, C. S., 2004, Managing ammonia in fish ponds. Southern Regional Aquaculture Center (SRAC).
- Hitzfeld, B., Hoger, S., and Dietrich, D., 2000, Cyanobacterial toxins: Removal during drinking water treatment, and human risk assessment. Environmental Health Perspectives, Vol. 108, pp. 113-122.
- Hu, L. B., Yang, J. D., Zhou, W., Yin, Y. F., Chen, J., and Shi, Z. Q., 2009, Isolation of a Methylobacillus sp. that degrades microcystin toxins associated with cyanobacteria. New Biotechnology, Vol. 26, pp. 205-211.
- Hoeger, S. J., Dietrich, D. R., and Hitzfeld, B. C., 2002, Effect of ozonation on the removal of cyanobacterial toxins during drinking water treatment. Environmental Health Perspectives, Vol. 110(11), pp. 1127-1132.
- Ishida, K., Matsuda, H., Murakami, M., Yamaguchi, K., 1997, Kawaguchipeptin B, an antibacterial cyclic undecapeptide from the cyanobacterium Microcystis aeruginosa. Journal of Natural Products, Vol. 60(7), pp. 724-726.
- Islam, S., and Islam, M., 2012, Status of water quality in the Dhaleshwari river and its effect on aquatic organism. Journal of Environmental Science and Water Resources, Vol. 1(8), pp. 192-201.
- Jain, K. K., 2012, Nanotechnology and water. Contemporary Materials, Vol. 3(1), pp. 26-30.
- Jiang, C., Wang, R., and Ma, W., 2010, The effect of magnetic nanoparticles on Microcystis aeruginosa removal by a composite coagulant. Colloids and Surfaces A: Physicochemical and Engineering Aspects, Vol. 369, pp. 260-267.
- Joung, S. H., Oh, H. M., Ko, S. R., and Ahn, C. Y., 2010, Correlations between environmental factors and toxic and non-toxic Microcystis dynamics during bloom in Daechung reservoir, Korea. Harmful Algae, Vol. 10(2), pp. 188-193.
- Jurczak, T., Tarczynska, M., Izydorczyk, K., Mankiewicz, J., Zalewski, M., and Meriluoto, J., 2005, Elimination of microcystins by water treatment processes-examples from Sulejow reservoir. Poland Water Research, Vol. 39, pp. 2394-2406.
- Juttner, F., and Watson, S. B., 2007, Biochemical and ecological control of geosmin and 2-methylisoborneol in source waters. Applied and Environmental Microbiology, Vol. 73(14), pp. 4395-4406.
- Karthick, B., and Ramachandra, T. V., Water quality status of Sharavathi river basin, Western Ghats, ENVIS Technical Report: 23, Energy & Wetlands Research Group, Centre for Ecological Sciences, Indian Institute of Science, Bangalore, 2006.
- Khanna, D. R., Kumar, Arun, and Neeraj, 2010, Physico-chemical characteristics of a fish pond near Roorkee. International Journal for Environmental Rehabilitation and Conservation, Vol. 1(2), pp. 52-60.
- Kiran, R., and Ramachandra, T. V., 1999, Status of wetlands in Bangalore and its conservation aspects. ENVIS, Journal Human Settlements, pp. 16-24.
- Kisugi, T., and Okino, T., 2009, Micropeptins from the freshwater cyanobacterium Microcystis aeruginosa (NIES-100). Journal of Natural Products, Vol. 72(4), pp. 777-781.
- Komarek, J., and Komarkova, J., 2002, Review of the European Microcystis morphospecies (cyanoprokaryotes) from nature. Czech Phycology, Vol. 2, pp. 1-24.
-
Kumar, N. J. I., and Oommen, C., 2011, Phytoplankton composition in relation to hydrochemical properties of tropical community wetland, Kanewal, Gujarat, India. Applied Ecology and Environmental Research, Vol. 9(3), pp. 279-292.
-
Lee, Y. J., Jung, J. M., Jang, M. H., Ha K., and Joo, G. J., 2006, Degradation of microcystins by adsorbed bacteria on a granular active carbon (GAC) filter during the water treatment process. Journal of Environmental Biology, Vol. 27(2), pp. 317-322.
-
Lehman, W. P., Boyer, G., Satchwell, M., and Waller, S., 2008, The influence of environmental conditions on the seasonal variation of Microcystis cell density and microcystins concentration in San Francisco Estuary. Hydrobiologia, Vol. 600, pp. 187-204.
-
Li, H., Liu, L., Li, M., and Zhang, X., 2013, Effects of pH, temperature, dissolved oxygen, and flow rate on phosphorus release processes at the sediment and water interface in storm sewer. Journal of Analytical Methods in Chemistry, pp. 1-7.
-
Lin, S. D., Tastes and odors in water supplies- A review. Illinois State Water Survey Urbana, 1977.
-
Liu, C. W., Lin, K, H., and Kuo, Y. M., 2003, Application of factor analysis in the assessment of ground water quality in a black foot disease area in Taiwan. Science of the Total Environment, Vol. 313, pp.77–89.
-
Liu, X., Lu, X. H., and Chen, Y., 2011, The effects of temperature and nutrient ratios on Microcystis blooms in lake Taihu, China: An 11-year investigation. Harmful Algae, Vol. 10(3), pp. 337–343.
-
Ma, Z., Niu, Y., Xie, P., Chen, J., Tao, M., and Deng, X., 2013, Off-flavor compounds from decaying cyanobacterial blooms of lake Taihu. Journal of Environmental Sciences, Vol. 25(3), pp. 495–501.
-
Ma, Z., Xie, P., Chen, J., Niu, Y., Tao, M., Qi, M., Zhang, W., and Deng, X., 2013, Microcystis blooms influencing volatile organic compounds concentrations in lake Taihu. Fresenius Environmental Bulletin, Vol. 22(1), pp. 95-102.
-
Magrann, T., Dunbar, G. S., Boskovic, D., and Hayes, W., 2012, Impacts of Microcystis on algal biodiversity and use of new technology to remove Microcystis and dissolved nutrients. Lakes and Reservoirs: Research and Management, Vol. 17, pp. 231-239.
-
Mahapatra, D. M., Chanakya, H. N., and Ramachandra, T. V., 2011, Assessment of treatment capabilities of Varthur lake, Bangalore, India. International Journal of Environmental Technology and Management, Vol. 14, pp. 84-102.
-
Mahapatra, D. M., Chanakya, H. N., and Ramachandra, T. V., 2012, Sustainable algal scum management and wastewater treatment in Bangalore. Lake 2012: National Conference on Conservation and Management of Wetland Ecosystems.
-
Maheshwari, R., 2005, Fish death in lakes. Current Science, Vol. 88(11), pp. 1719-1721.
-
Mamba, B. B., Krause, R. W., Malefetse, T. J., Mhlanga, S. D., Sithole, S. P., Salipira, K.L., and Nxumalo, E. N., 2007, Removal of geosmin and 2-methylisorboneol (2-MIB) in water from Zuikerbosch Treatment Plant (Rand Water) using β-cyclodextrin polyurethanes. Water SA, Vol. 33(2), pp. 223-227.
-
Manage, P. M., Edwards, C., and Lawton, L. A., 2009, Biodegradation of Microcystin-LR by natural bacterial populations. Interdisciplinary Studies on Environmental Chemistry-Environmental Research in Asia, pp. 277-285.
-
Maske, S. S., Sangolkar, L. N., and Chakrabarti, T, 2010, Temporal variation in density and diversity of cyanobacteria and cyanotoxins in lakes at Nagpur (Maharashtra State), India. Environmental Monitoring and Assessment, Vol. 169, pp. 299-308.
-
Mazlum, N., Ozer, A., and Mazlum, S., 1999, Interpretation of water quality data by principal components analysis. The Turkish Journal of Engineering and Environmental Science, Vol. 23, pp. 19-26.
-
Mc Carthy, M., James, T., Chen, Y., East, T., and Gardner, W., 2009, Nutrient ratios and phytoplankton community structure in the large, shallow, eutrophic, subtropical lakes Okeechobee (Florida, USA) and Taihu (China). Limnology, Vol. 10, pp. 215-227.
-
Mohanta, B. K., and Potra, A. K., 2000, Studies on the water quality index of river Sanamachhandana at Keonjar Garh, Orissa, India. Pollution Research, Vol. 19(3), pp. 377-385.
-
Mohebbi, F., Azari, A. M., Heidari, M., and Asem, A., 2012, Cyanobacterium Microcystis aeruginosa bloom in Aras Dam reservoir. International Journal of Environmental Research, Vol. 6(1), pp. 309-312.
-
Mook, W. G., 2001, Environmental isotopes in the hydrological cycle: Principles and applications. Technical Documents in Hydrology, Vol. 3(39).
-
Muthukumar, C., Muralitharan, G., Vijayakumar, R., Panneerselvam, A., and Thajuddin, N., 2007, Cyanobacterial biodiversity from different freshwater ponds of Thanjavur, Tamilnadu (India). Acta Botanica Malacitania, Vol. 32, pp. 17-25.
-
Napit, M. K., 2013, Effect of physico-chemical parameters on plankton and amphibian fauna population of Bhopal lakes and ponds. International Journal of Current Biotechnology, Vol. 1(8), pp. 1-4.
-
Ni, W., Zhang, J., Ding, T., Stevenson, J. R., and Zhu, Y., 2012, Environmental factors regulating cyanobacteria dominance and microcystin production in a subtropical lake within the Taihu watershed, China. Journal of Zhejiang University Science A (Applied Physics and Engineering), Vol. 13(4), pp. 311-322.
-
Nowotny, A., Mentel, R., Wegner, U., Mundt, S., and Lindequist, U., 1997, Antiviral activity of an aqueous extract of the cyanobacterium Microcystis aeruginosa. Phytotherapy Research, Vol. 11, pp. 93-96.
-
Nybom, S. M. K., Salminen, S. J., and Meriluoto, J. A. O., 2007, Removal of microcystin-LR by strains of metabolically active probiotic bacteria. FEMS Microbiology Letters, Vol. 270(1), pp. 27-33.
-
Oberholster, P. J., Botha, A. M., and Grobbelaar, J. U., 2004, Microcystis aeruginosa: source of toxic microcystins in drinking water. African Journal of Biotechnology, Vol. 3(3), pp. 159-168.
-
Ordorika, L., Fastner, J., Kurmayer, R., Hisbergues, M., Dittmann, E., Komarek, J., Erhard, M., and Chorus, I., 2004, Distribution of microcystin-producing and non-microcystin-producing Microcystis sp. in European freshwater bodies: Detection of microcystins and microcystin genes in individual colonies. Systematic and applied microbiology, Vol. 27(5), pp. 592-602.
-
Palikova, M., Mares, J., Kopp, R., Hlavkova, J., Navratil, S., Adamovsky, O., Chmelar, L., and Blaha, L., 2011, Accumulation of microcystins in Nile Tilapia, Oreochromis niloticus, and effects of a complex cyanobacterial bloom on the dietetic quality of muscles. Bulletin of Environmental Contamination and Toxicology,Vol. 87, pp. 26-30.
-
Papadimitriou, T., Kagalou, I., Bacopoulos, V., and Leonardos, I. D., 2009, Accumulation of microcystins in water and fish tissues: An estimation of risks associated with microcystins in most of the Greek lakes. Environmental Toxicology, Vol. 25, pp. 418-427.
-
Papadimitriou, T., Katsiapi, M., Kormas, K. A., Moustaka-Gouni, M., and Kagalou, I., 2013, Artificially-born “killer” lake: Phytoplankton based water quality and microcystin affected fish in a reconstructed lake. Science of the Total Environment, Vol. 452-453, pp. 116-124.
-
Parashar, C., Dixit, S., and Shrivastava, R., 2006, Seasonal variations in physico-chemical characteristics in upper lake of Bhopal. Asian Journal of Experimental Sciences, Vol. 20(2), pp. 297-302.
-
Patel, C. A., and Patel, S. R., 2012, Comparison of the physico-chemical parameters of two lakes at Lodra and Nardipur under biotic stress. International Journal of Scientific and Research Publications, Vol. 2(9), pp. 2250-3153.
-
Pouria, S., de Andrade, A., Barbosa, J., Cavalcanti, R. L., Barreto, V. T. S., Ward, C. J., Preiser, W., Poon, G. K., Neild, G. H., and Codd, G. A., 1998, Fatal microcystin intoxication in haemodialysis unit in Caruaru, Brazil. The Lancet, Vol. 352(9121), pp. 21-26.
-
Prescott, G. W., How to know the fresh-water algae. Published by W.M.G Brown Company, Dubuque, Iowa, 1954.
-
Puri, J. P., Yenkie, M. K. N, Battalwar, G. D., Gandhare, V. N., and Dhanorkar, B. D., 2010, Study and interpretation of physico-chemical characteristic of lake water quality in Nagpur city (India). Rasayan Journal of Chemistry, Vol. 3(4), pp. 800-810.
-
Rachel, R., Pum, D., Smarda, J., Smajs, D., Komrska, J., Krzyzanek, V., Rieger, G., and Stetter, K. O., 1997, II Fine structure of S-layers. FEMS Microbiology Reviews, Vol. 20(1-2), pp. 13-23.
-
Rankin, K. A., Alroy, K. A., Kudela, R. M., Oates, S. C., Murray, M. J., and Miller, M. A., 2013, Treatment of cyanobacterial (microcystin) toxicosis using oral Cholestyramine: Case report of a dog from Montana. Toxins, Vol. 5, pp. 1051-1063.
-
Ramachandra, T.V., 2010, Wetlands: Need for appropriate strategies for conservation and sustainable management. Journal of Basic and Applied Biology, Vol. 4(3), pp. 1-17.
-
Ramachandra, T. V., Conservation and management of urban wetlands: Strategies and challenges, ENVIS Technical Report: 32, Environmental Information System, Centre for Ecological Sciences, Bangalore, 2009a.
-
Ramachandra, T. V., Essentials in urban lake monitoring and management, CiSTUP Technical report: 1, Urban Ecology, Environment and Policy Research, Centre for Infrastructure, Susatinable Transportation and Urban Planning, IISc, Bangalore, 2009b.
-
Ramachandra, T. V., 2005, Conservation, restoration and management of aquatic ecosystems, In Aquatic Ecosystems - Conservation, Restoration and Management, Ramachandra, Ahalya N. and Rajasekara Murthy (ed.), Capital Publishing Company, New Delhi.
-
Ramachandra, T. V., 2001, Restoration and management strategies of wetlands in developing countries. Electronic Green Journal, Vol. 1(15).
-
Ramachandra, T. V., and Ahalya, N., Essentials of Limnology and Geographical Information System (GIS). Energy and Wetlands Research Group, Center for Ecological Sciences, Indian Institute of Science, Bangalore, 2001.
-
Ramachandra, T. V., Ahalya N., and Payne, M., Status of Varthur lake: Opportunities for restoration and sustainable management. Technical report 102. Centre for Ecological Sciences, Indian Institute of Science, Bangalore, 2003.
-
Ramachandra, T. V., Alakananda, B., Ali Rani and Khan M A., 2011, Ecological and socio-economic assessment of Varthur wetland, Bengaluru (India). Journal of Environmental Science and Engineering, Vol. 53(1), pp. 101-108.
-
Ramachandra, T. V., Bharath, H. A., and Kumar, U., 2012, Conservation of wetlands to mitigate urban floods. Resources, Energy, and Development, Vol. 9(1), pp. 1-22.
-
Ramachandra, T. V., and Kumar U., 2008, Wetlands of greater Bangalore, India: Automatic delineation through pattern classifiers. Electronic Green Journal, Vol. 1(26).
-
Ramachandra, T. V., and Rajinikanth, R., 2005, Economic valuation of wetlands. Journal of Environmental Biology, Vol. 26(3), pp. 439-447.
-
Ramachandra, T. V., and Solanki, M., 2007, Ecological assessment of lentic water bodies of Bangalore. Technical Report 25, CES, Bangalore.
-
Ramachandra, T. V., Mahapatra, D. M., Shilpi, S., and Joshi, N., 2013, Algal biofuel from urban wastewater in India: Scope and challenges. Renewable and Sustainable Energy Reviews, Vol. 21, pp. 767-777.
-
Ramana, P., Patil, S. K., and Sankri G., 2008, Evaluation of water quality of Magadi wetland in Gadag district, Karnataka. Proceedings of Taal 2007: The 12th World Lake Conference, pp. 355-359.
-
Rani, R., and Sivakumar, V., 2012, Physico-chemical parameters and phytoplankton richness in certain pond of Chidambaram, Cuddalore district of Tamil Nadu. International Journal of Research in Environmental Science and Technology, Vol. 2(2), pp. 35-44.
-
Rao, S. C., Rao, S. B., Hariharan, and Bharathi, M. N., 2010, Determination of water quality index of some areas in Guntur district, Andhra Pradesh. International Journal of Applied Biology and Pharmaceutical Technology, Vol. 1(1), pp. 79-86.
-
Ravikumar, P., Mehmood, M. A., and Somashekar, R. K., 2013, Water quality index to determine the surface water quality of Sankey tank and Mallathahalli lake, Bangalore urban district, Karnataka, India. Applied Water Science, Vol. 3(1), pp. 247-261.
-
Reynolds, C. S., and Rogers, D. A., 1976, Seasonal variations in the vertical distribution and buoyancy of Microcystis aeruginosa Kutz. Emend. Elenkin in Rostherne Mere, England. Hydrobiologia, Vol. 48, pp. 17-23.
-
Reynolds, C. S., Jaworski, G. H. M., Cmiech, H. A., and Leedale, G. F., 1981, On the annual cycle of the blue-green alga Microcystis aeruginosa Kutz Emend Elenkin.Proceedings of the Royal Society B, Vol. 293, pp. 419-477.
-
Roselene, H., and Paneerselvam, 2008, Physico-chemical analysis and role of phytoplanktons in Bellandur lake. The 12th World Lake Conference, pp.1729-1736.
-
Savitha, N. and Yamakanamardi, M. S., 2011, Comparative studies on physico-chemical parameters in three lakes in Mysore district, Karnataka state, India. Journal of .Aquatic Biology, Vol. 26(1), pp. 41-55.
-
Sejnohova, L., Microcystis new findings in peptide production, taxonomy and autecology by cyanobacterium Microcystis. Ph.D thesis, Masaryk University in Czech Republic, Faculty of Science Department of Botany and Zoology and Institute of Botany, Czech Academy of Sciences, 2008.
-
Sember, S. C., The effect of nutrient levels and ratios on the growth of Microcystis aeruginosa and microcystin production. Magister Scientiae, Thesis, University of Port Elizabeth, South Africa, 2002.
-
Sharma, R., and Capoor, A., 2010, Seasonal variations in physical, chemical and biological parameters of lake water of Patna Bird Sanctuary in relation to fish productivity. World Applied Sciences Journal, Vol. 8(1), pp. 129-132.
-
Shinde, S. E., Pathan, T. S., Raut, K. S., and Sonawane, D. L., 2011, Studies on the physico chemical parameters and correlation coefficient of Harsool-savangi Dam, district Aurangabad, India. Middle-East Journal of Scientific Research, Vol. 8(3), pp. 544-554.
-
Shively, J. M., 2006, Prokaryote inclusions: descriptions and discoveries. Springer - Verlag Berlin Heidelberg.
-
Shrestha, S., and Kazama, F., 2007, Assessment of surface water quality using multivariate statistical techniques: A case study of the Fuji river basin, Japan. Environmental Modelling and Software, Vol. 22, pp. 464-475.
-
Sincy, V., Mahapatra, D. M., and Ramachandra, T. V., 2012, Nutrient removal of secondary treated water through algal ponds. Lake 2012: National Conference on Conservation and Management of Wetland Ecosystems.
-
Sivakumar, K., and Karuppasamy, R., 2008, Factors affecting productivity of phytoplankton in a reservoir of Tamil Nadu, India. American-Eurasian Journal of Botany, Vol. 1(3), pp. 99-103.
-
Singh, K. K., Sharma, M. B., and Usha, K. H., 2010, Ecological of Kharungpat lake, Thoubal, Manipur, India: Part-1 water quality status. An International Quarterly Journal of Environmental Sciences, Vol. 4, pp. 241-245.
-
Smith, J. L., Boyer, G. L., and Zimba, P. V., 2008, A review of cyanobacterial odorous and bioactive metabolites: Impacts and management alternatives in aquaculture. Aquaculture, Vol. 280, pp. 5-20.
-
Sonawane, L. D., 2011, Physico-chemical profile of Sukhana river, in Aurangabad, (M.S.) India. The Ecoscan, Vol. 5(3-4), pp. 121-126.
-
Suresh, S., Aravinda, B. H., and Thirumala, S., 2011, Phytoplankton for biomonitoring of organic pollution in two tanks of Davangere district, Karnataka, India. South Western Journal of Horticulture, Biology and Environment,Vol.2(2), pp. 107-112.
-
Strakova, L., Kopp, R., Marsalkova, E., and Marsalek, B., 2013, Dynamics of the cyanobacterial water bloom with focus to Microcystis and its relationship with environmental factors in Brno reservoir. Acta Universitatis Agriculturae et Silviculturae Mendelianae Brunensis, Vol. LXI (5), pp. 1383–1390.
-
Sui, X., Wang, X., Huang, H., Peng, G., Wang, S., and Fan, Z., 2014, A novel photocatalytic material for removing Microcystin-LR under visible light irradiation: Degradation characteristics and mechanisms. PLoS ONE, Vol. 9(4).
-
Teichreb, C., Lake and watershed management options for the control of nuisance blue green algal blooms in Pigeon lake, Alberta. Central Region Operations Division, Alberta Environment and Sustainable Resource Development, 2012.
-
Tencalla, F. G., Dietrich, D. R., Schlatter, C., 1994, Toxicity of Microcystis aeruginosa peptide toxin to yearling rainbow trout (Oncorhynchus mykiss). Aquatic toxicology, Vol. 30(3), pp. 215-224.
-
Thakor, J. F., Bhoi, K. D., Dabhi, R. H., Pandya, N. S., and Chauhan, B. N., 2011, Water quality index (WQI) of Pariyej lake Dist. Kheda - Gujarat. Current World Environment, Vol. 6(2), pp. 225-231.
-
Tiwari, A., and Chauhan, S. V. S., 2006, Seasonal phytoplanktonic diversity of Kitham lake, Agra. Journal of Environmental Biology, Vol. 27(1), pp. 35-38.
-
Tran, C. D., Duri, S., Delneri, A., and Franko, M., 2013, Chitosan-cellulose composite materials: Preparation, characterization and application for removal of microcystin. Journal of Hazardous Materials, Vol. 252-253, pp. 355-366.
-
Trivedi, R. K., and Goel, P. K., Chemical and biological methods for water pollution studies. Published by Environmental Publications, Post Box 60, Karad, 1986.
-
Udayashankara, T. H, Anitha, K. G, Rao, S., Shifa, A., and Shuheb, M., 2013, Study of water quality and dynamic analysis of phytoplanktons in four freshwater lakes of Mysore, India. International Journal of Innovative Research in Science, Engineering and Technology, Vol. 2(7), pp. 2600-2609.
-
United States Environmental Protection Agency (USEPA), 2012, Cyanobacteria and Cyanotoxins: Information for Drinking Water Systems. Office of Water, EPA-810F11001.
-
U.S. Environmental Protection Agency (USEPA). 2013, Aquatic life ambient water quality criteria for ammonia – freshwater. Office of Water. EPA-822-R-13-001.
-
Vasconcelos, J. F., Barbosa, J. E. L., Lira, W., and Azevedo, S. M. F. O., 2013, Microcystin bioaccumulation can cause potential mutagenic effects in farm fish. Egyptian Journal of Aquatic Research, Vol. 39(3), pp. 185-192.
-
Verma, R., and Singh, G. P., 2010, Seasonal distribution of phytoplankton in Laddia Dam in Sikar District of Rajasthan. Research Journal of Agricultural Sciences, Vol. 1(4), pp. 366-369.
-
Verma, P., Chandawat, D., Gupta, U., and Solanki, H., 2012, Water quality analysis of an organically polluted lake by investigating different physical and chemical parameters. International Journal of Research in Chemistry and Environment, Vol. 2, pp. 105-111.
-
Vijayakumar, S., 2012, Potential applications of cyanobacteria in industrial effluents-A review. Journal of Bioremediation and Biodegradation, Vol. 3, pp. 154.
-
Vijayvergia, R. P., 2008, Eutrophication: A case study of highly eutrophicated lake Udaisagar, Udaipur (Raj.), India with regards to its nutrient enrichment and emerging consequences. Proceedings of Taal 2007: The 12th World Lake Conference, pp. 1557-1560.
-
Visser, P. M., Ibelings, B. W., Mur, L. R, and Walsby, A. E., 2005, The ecophysiology of the harmful cyanobacterium Microcystis. In Harmful Cyanobacteria. Huisman, J., Matthijs, H. C. P., and Visser, P., (Eds.) Dordrecht, The Netherlands, Springer, pp. 109-142.
-
Von Elert, E., Oberer, L., Merkel, P., Huhn, T., and Blom, J. F., 2005, Cyanopeptolin 954, a chlorine-containing chymotrypsin inhibitor of Microcystis aeruginosa NIVA Cya 43. Journal of Natural Products, Vol. 8(9), pp. 1324-1327.
-
Wang, Z., Lia, D., and Qin, H., Li, Y., 2012, An integrated method for removal of harmful cyanobacterial blooms in eutrophic lakes. Environmental Pollution, Vol. 160, pp. 34-41.
-
Xie, L. Q., Xie, P., and Tang, H. J., 2003, Enhancement of dissolved phosphorus release from sediment to lake water by Microcystis blooms - An enclosure experiment in a hyper-eutrophic, subtropical Chinese lake. Environmental Pollution, Vol. 122, pp. 391-399.
-
Xie, P., and Liu, J., 2001, Practical success of biomanipulation using filter-feeding fish to control cyanobacteria blooms - A synthesis of decades of research and application in a subtropical hypereutrophic lake. The Scientific World, Vol. 1, pp. 337-356.
-
Yamaki, H., Sitachitta, N., Sano, T., and Kaya, K., 2005, Two new chymotrypsin inhibitors isolated from the cyanobacterium Microcystis aeruginosa NIES-88. Journal of Natural Products, Vol. 68, pp. 14-18.
-
Yoshinaga, I., Hitomi, T., Miura, A., Shiratani, E., and Miyazaki, T., 2006, Cyanobacteria Microcystis bloom in a eutrophicated regulating reservoir. Japan Agricultural Research Quarterly, Vol. 40(3), pp. 283-289.
-
Zainuddin, E. N., Mundt, S., Wegner, E. U., and Mentel, E. R., 2002, Cyanobacteria a potential source of antiviral substances against influenza virus. Medical Microbiology and Immunology, Vol. 191, pp. 181-182.
-
Zhang, J., Ni, W., Luo, Y., Stevenson, R. J., and Qi, J., 2011, Response of freshwater algae to water quality in Qinshan lake within Taihu Watershed, China. Physics and Chemistry of the Earth, Vol. 36(9-11), pp. 360-365.
-
Zohary, T., and Breen, C. M., 1989, Environmental factors favouring the formation of Microcystis aeruginosa hyperscums in a hypertrophic lake. Hydrobiologia, Vol. 178, pp. 179-192.
-
| | |