ENVIS Technical Report: 72,  January 2015
l
ENVIRONMENTAL AUDITING OF BANGALORE WETLANDS

   T.V. Ramachandra*      Bharath H . Aithal  Alakananda B    Supriya G  

Energy and Wetlands Research Group, Centre for Ecological Sciences, Indian Institute of Science, Bangalore – 560012, India.
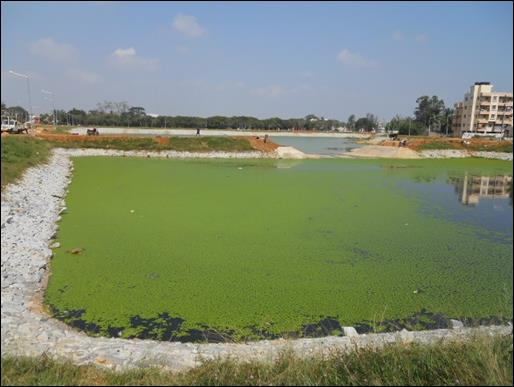
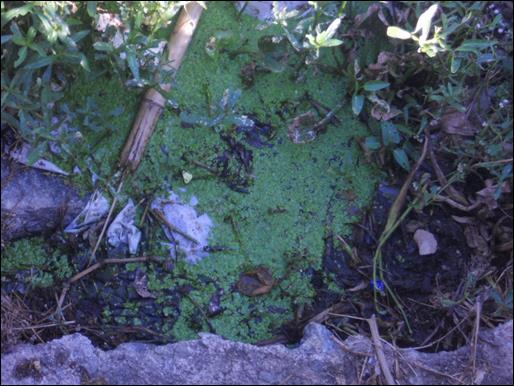
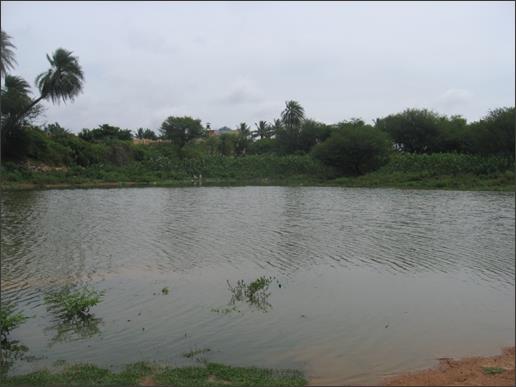
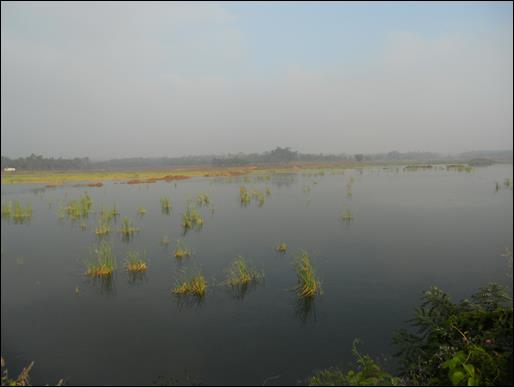
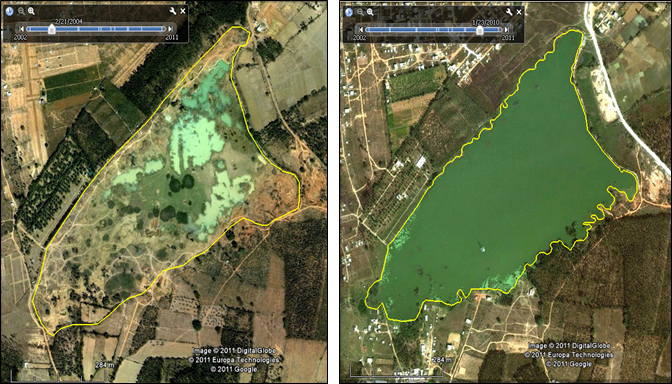
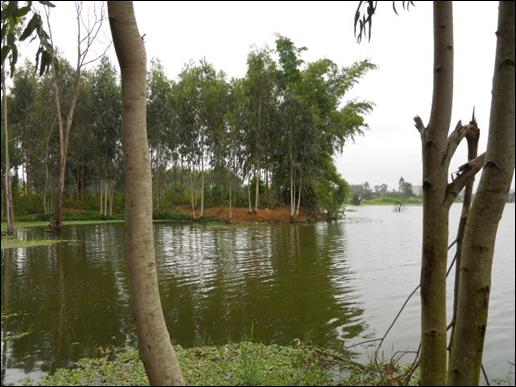
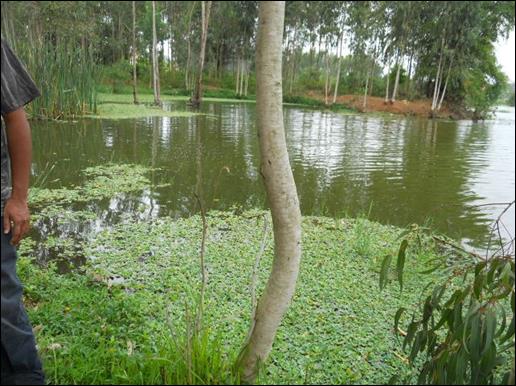
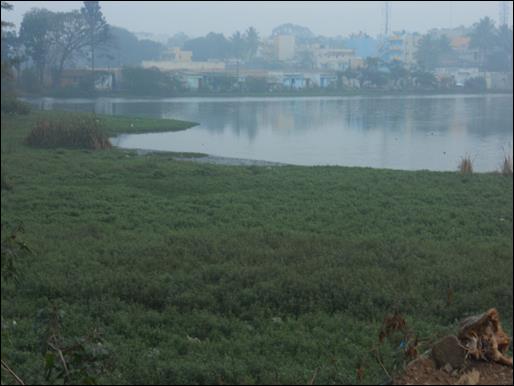
*Corresponding author: cestvr@ces.iisc.ernet.in.

Environmental Auditing of 14 lakes (Konasandra Lake - Sompura Lake)

17. KONASANDRA LAKE


NAME OF THE LAKE

KONASANDRA  LAKE

GEOGRAPHIC DETAILS          LAT/LONG: 12°53'32"N   77°29'1"E

AREA (2000/2010)

12.07/11.94 ha

ORGANIZATION

BDA

WARD/ VILLAGE NAME

Konasandra

STATUS

Moderately  pollution

RESTORATION

2009- 2010 (Incomplete)

WATER CONDITION

Clean – Moderately polluted


Figure 1 Google Earth image and area of Konasandra Lake during 2000 and 2010 respectively.

WATER QUALITY

Table 1 Water quality of Konasandra Lake with BIS limits


Sampling site

Konasandra fensinf side (KNFN)

Konasandra inlet (KNI1)

Konasandra outlet (KNO1)

Konasandra layout (KNLY)

BIS standards for Surface waters

pH

8.80

8.97

8.69

8.80

6.5-9

Electric conductivity (μS/cm)

792.00

766.00

825.67

718.00

<1200

Total dissolved solids (ppm)

551.33

537.67

582.00

548.00

<700

Dissolved oxygen (mg/L)

6.37

7.28

6.11

6.41

>5

Biological oxygen demand (ppm)

12.63

13.44

10.75

12.35

<5

Chemical oxygen demand (ppm)

38.67

39.33

26.67

30.67

<30

Nitrates (ppm)

0.067

0.058

0.070

0.067

--

Inorganic phosphates (ppm)

0.015

0.005

0.007

0.006

--

Total hardness (mg/L)

88.67

80.00

85.33

86.00

<200

Calcium hardness (mg/L)

22.98

23.99

24.90

22.98

<80

Chlorides (mg/L)

69.20

41.75

71.95

57.46

<250

Total alkalinity (mg/L)

406.00

327.33

398.00

334.67

<600

Water quality of Konasandra Lake is listed in Table 17. pH ranged from 8.69- 8.8.  Electric conductivity and total dissolved solids ranged from 718-825.67 μS/cm and 537.67-582 ppm respectively. Biological oxygen demand was slightly higher than the BIS permissible limit while chemical oxygen demand was found higher at inlet site (39.33 ppm). Nutrients such as nitrates and inorganic phosphates were in minimal concentration. The amount of hardness in water reflected less influence of sewage and other human disturbances on water quality of Konasandra. The main source of pollution was observed due to dumping of solid waste along with construction waste near the lake bed.


CURRENT THREATS (Refer Figure 17 and Plate 17)

  1. Sewage inflow
  2. Local human disturbances such as washing clothes, swimming, open defecation
  3. Weed cover
  4. Dumping of solid waste
 
PLATE 17


18. KOTHNUR LAKE

NAME OF THE LAKE

KOTHNUR LAKE

GEOGRAPHIC DETAILS       LAT/LONG: 12°52'24"N   77°34'48"E

AREA (2000/2011)

5.982/4.08 ha

ORGANIZATION

187- Puttenahalli

WARD / VILLAGE NAME

JP Nager

STATUS

High pollution

RESTORATION

July 2009 – July 2010 (Incomplete)

WATER CONDITION

Pre restoration-Polluted, Post restoration- Polluted.


Figure 2 Google Earth image and area of Kothanur Lake during 2000 and 2011 respectively.

WATER QUALITY

Table 2 Water quality of Kothanur Lake with BIS limits


Sampling site

Kothanur inlet (KTI1)

Kothanur outlet (KTO1)

BIS standards for Surface waters

pH

9.13

9.12

6.5-9

Electric conductivity (μS/cm)

681.00

653.00

<1200

Total dissolved solids (ppm)

472.00

467.00

<700

Dissolved oxygen (mg/L)

6.91

7.56

>5

Biological oxygen demand (ppm)

22.58

21.22

<5

Chemical oxygen demand (ppm)

51.00

42.00

<30

Nitrates (ppm)

0.068

0.079

--

Inorganic phosphates (ppm)

0.056

0.056

--

Total hardness (mg/L)

182.50

167.50

<200

Calcium hardness (mg/L)

125.05

123.05

<80

Chlorides (mg/L)

242.00

239.16

<250

Total alkalinity (mg/L)

194.00

192.00

<600

Water quality variation among sampling sites of Kothanur Lake has been listed in Table 18. pH was highly alkaline in condition ranging from 9.12-9.13.  Electric conductivity and dissolved solids were well within the BIS standard for surface waters while the chloride concentration was found to be as high as 242 mg/L at inlet and 239 mg/L at outlet which revealed domestic sewage as the major source. Both the biological and chemical demand for oxygen was increased at both the sampling sites ranging from 21.22-22.58 ppm and 42-51 ppm respectively. The Lake immediate surrounding was occupied by apartments which led to the pollution into the Lake through sewage, dumping waste and washing vehicles. Even though the restoration work was in process, black, foul odor water was characteristic of untreated sewage inflow into the Lake which also carried plastic and other waste along with it.


CURRENT THREATS (Refer Figure 18 and Plate 18)

  1. Sewage inflow,
  2. Construction of apartment in lake bed, dumping of waste in surrounding area
  3. Eutrophication, Algal bloom was observed
  4. Sewage inflow even after restoration
 
   PLATE 18


19. MADIVALA LAKE

NAME OF THE LAKE

MADIWALA LAKE

GEOGRAPHIC DETAILS         LAT/LONG: 12°54'23"N   77°36'57"E

AREA (2000/2009)

93.11/85.6 ha

ORGANIZATION

BBMP/ Forest dept.

WARD / VILLAGE NAME

188- Bilekhalli

STATUS

High pollution

RESTORATION

Completed (Year)

WATER CONDITION

Polluted.


WATER QUALITY

Table 3 Water quality of Madivala Lake with BIS limts


Sampling site

Madivala inlet (MDI1)

Madivala outlet (MDO1)

BIS standards for Surface waters

pH

8.41

8.35

6.5-9

Electric conductivity (μS/cm)

775.00

759.00

<1200

Total dissolved solids (ppm)

538.00

532.00

<700

Dissolved oxygen (mg/L)

8.37

8.13

>5

Biological oxygen demand (ppm)

22.00

19.48

<5

Chemical oxygen demand (ppm)

52.43

49.02

<30

Nitrates (ppm)

0.585

0.486

--

Inorganic phosphates (ppm)

0.023

0.120

--

Total hardness (mg/L)

201.20

194.00

<200

Calcium hardness (mg/L)

131.54

102.73

<80

Chlorides (mg/L)

130.64

143.42

<250

Total alkalinity (mg/L)

246.00

240.00

<600

Variation in water quality of Madivala Lake is listed in Table 19. Water quality results showed the significant organic pollution through biological and chemical oxygen demand which ranged higher than that of BIS surface standards. Nutrients did not vary much which could also add to Eutrophication of water. Among all variables total hardness and calcium hardness ranged in higher concentration i.e., 194-201.2 mg/L and 102.73-131.54 mg/L respectively which clearly showed the sewage and local human disturbances influenced the water quality. The fisherman revealed that the fish diversity has been declined and frequent fish death resulted due to increased organic concentration in lake. The built-up area in catchment has been increased which could increase the pollution load. Even though this lake has been restored, improper maintenance of lake has led to dumping of waste and spoiled the lake water.


CURRENT THREATS (Refer Figure 19 and Plate 19) 

  1. Sewage inflow
  2. Construction of apartment in lake bed
  3. Dumping of solid waste surrounding lake
  4. Local human disturbances such as washing clothes, swimming, open defecation

PLATE 19


20. MALLATHAHALLI LAKE

NAME OF THE LAKE

MALLATHAHALLI LAKE

GEOGRAPHIC DETAILS       LAT/LONG: 12°57'56"N   77°29'41"E

AREA (2000/2009)

 22.89/21.87 ha

ORGANIZATION

BDA

WARD / VILLAGE NAME

Mallathahalli

STATUS

Moderate pollution

RESTORATION

July 2009 – July 2010 (Incomplete)

WATER CONDITION

Polluted.


Figure 4 Google Earth image and area of Mallathahalli Lake during 2000 and 2010 respectively.

WATER QUALITY


Table 4 Water quality of Mallathahalli Lake


Sampling site

Mallathahalli outlet (MLO1)

Mallathahalli inlet (MLI1)

BIS standards for Surface waters

pH

9.28

10.30

6.5-9

Electric conductivity (μS/cm)

1105.00

1160.00

<1200

Total dissolved solids (ppm)

803.00

807.00

<700

Dissolved oxygen (mg/L)

7.44

9.39

>5

Biological oxygen demand (ppm)

20.80

38.58

<5

Chemical oxygen demand (ppm)

42.00

110.00

<30

Nitrates (ppm)

0.062

0.072

--

Inorganic phosphates (ppm)

0.046

0.064

--

Total hardness (mg/L)

302.00

278.00

<200

Calcium hardness (mg/L)

124.05

132.87

<80

Chlorides (mg/L)

106.50

214.42

<250

Total alkalinity (mg/L)

301.00

252.00

<600

Mallathahalli Lake water showed higher values for all the chemical variables which affected the growth of aquatic organisms. pH at both the sampling sites was in high alkaline range while, nutrient concentration was ranged as 0.062-0.072 ppm of nitrates and 0.046-0064 ppm of inorganic phosphates. The increased amount of sewage from upstream built- up resulted in increased organic matter in water along with high amount of hardness in water (range, 278-302 ppm). In later period, the lake water turned gradually to green in color because of algal bloom and led to fish death during 2009. Although the restoration work is in progress, the aquatic weeds have massively spread across region and consequently a decrease in oxygen level was recorded.


CURRENT THREATS (Refer Figure 20 and Plate 20)

  1. Sewage inflow
  2. Construction of buildings, dumping of waste in surrounding area
  3. Eutrophication, Algal bloom was observed
  4. Fishing.

PLATE 20 


21. MALSANDRA LAKE

NAME OF THE LAKE

MALSANDRA KERE

GEOGRAPHIC DETAILS     LAT/LONG: 13°3'29"N   77°31'5"E

AREA (2000/2010)

2.278/0.9722 ha

ORGANIZATION

BBMP

WARD / VILLAGE NAME

12- Shettihalli

STATUS

Less polluted

RESTORATION

NO

WATER CONDITION

Clean- Moderate pollution.


WATER QUALITY


Table 5 Water quality of Malsandra Lake with BIS standards mentioned


Sampling site

Malsandra site 1 (MLA1)

Malsandra site 2 (MLA2)

BIS standards for Surface waters

pH

9.23

8.9

6.5-9

Electric conductivity (μS/cm)

835

790

<1200

Total dissolved solids (ppm)

658

565

<700

Dissolved oxygen (mg/L)

8.13

10.57

>5

Biological oxygen demand (ppm)

12.93

14.59

<5

Chemical oxygen demand (ppm)

80.00

42.67

<30

Nitrates (ppm)

0.03

0.056

--

Inorganic phosphates (ppm)

0.24

0.18

--

Total hardness (mg/L)

108

136

<200

Calcium hardness (mg/L)

72.34

96.25

<80

Chlorides (mg/L)

192.24

214.92

<250

Total alkalinity (mg/L)

268

243

<600

Water quality of Malsandra at different sampling sites has been listed in Table 21. pH of water ranged from 8.9- 9.23 while the oxygen level was as well significantly high indicating photosynthetic activity. Biological oxygen demand and chemical oxygen demand was higher at site 2 than at site 1 which was near road construction and stone mining. Total hardness ranged for 108-136 mg/L whereas calcium hardness was recorded as high at both the sampling sites i.e., ranging from 72.34- 96.25 mg/L. The lake water is clear and very less or no sewage inflow was observed into the lake and thus, the ionic concentration and total dissolved solids values were within the permissible limits.


CURRENT THREATS (Refer 21 and Plate 21)

  1. No defined lake boundary
  2. Human disturbances such as washing clothes, Open Defecation.

PLATE 21

22. MUTHANALLUR LAKE

NAME OF THE LAKE

MUTHANALLUR KERE

GEOGRAPHIC DETAILS       LAT/LONG: 12°49'23"N   77°43'40"E

AREA (2002/2009)

110.8/106.4 ha

ORGANIZATION

BBMP

WARD NAME

Anekal taluk

STATUS

Clean/ No pollution

RESTORATION

NO

WATER CONDITION

Clean.


figure 6 : Google Earth image and area of Muthanallur Lake during 2004 and 2009 respectively.

WATER QUALITY

Table 6 Water quality of Muthanallur Lake with BIS limits


Sampling site

Muthanallur site 1 (MTR1)

Muthanallur site 2 (MTR2)

BIS standards for Surface waters

pH

8.75

8.1

6.5-9

Electric conductivity (μS/cm)

1218

901

<1200

Total dissolved solids (ppm)

954

890

<700

Dissolved oxygen (mg/L)

8.13

9.76

>5

Biological oxygen demand (ppm)

7.35

5.89

<5

Chemical oxygen demand (ppm)

24.7

21.78

<30

Nitrates (ppm)

0.08

0.064

--

Inorganic phosphates (ppm)

0.22

0.29

--

Total hardness (mg/L)

93

90.2

<200

Calcium hardness (mg/L)

61.5

60.1

<80

Chlorides (mg/L)

119

123

<250

Total alkalinity (mg/L)

249

234

<600

Muthanallur Lake water along with BIS limits has been listed in Table 22. The highest ionic concentration of 1218 μS/cm and lowest of 901 was recorded at site 1 and site 2 respectively. Except the slight high amount of biological and chemical oxygen demand, all the chemical variables were well within the BIS permissible limits which resulted in good water quality. Muthanallur was found less affected by any anthropogenic activities but certainly higher values of electric conductivity and total dissolved solids require immediate attention and conservation of lake.


CURRENT THREATS (Refer Figure 22 and Plate 22)

  1. Washing clothes, Open Defecation
  2. Sewage from Electronic city (Initial stage).

PLATE 22


23. NELAGADARENAHALLI/ NARASAPPANAHALLI LAKE

NAME OF THE LAKE

NARASAPPANAHALLI / NELAGADARANAHALLI LAKE

GEOGRAPHIC DETAILS       LAT/LONG: 13°1'14"N   77°29'49"E

AREA (2000/2010)

17.81/15.01 ha

ORGANIZATION

BBMP

WARD NAME

41-Peenya Industrial Area

STATUS

Highly Polluted

RESTORATION

NO

WATER QUALITY

Poor

Figure 7 Google earth image and area of Nelagadarenahalli Lake during 2000 and 2010 respectively


WATER QUALITY

Table 7 Water quality of Nelagedarahalli Lake with BIS limits


Sampling site

Nelag. Halli outlet (NRO1)

Nelag. Halli inlet (NRI1)

BIS standards for Surface waters

pH

8.36

8.71

6.5-9

Electric conductivity (μS/cm)

11160

10890

<1200

Total dissolved solids (ppm)

7790

7530

<700

Dissolved oxygen (mg/L)

5.36

0.00

>5

Biological oxygen demand (ppm)

39.02

34.73

<5

Chemical oxygen demand (ppm)

83.02

90.321

<30

Nitrates (ppm)

0.5078

0.44488

--

Inorganic phosphates (ppm)

0.375117

0.23439

--

Total hardness (mg/L)

712

820

<200

Calcium hardness (mg/L)

623.9298112

735.9330016

<80

Chlorides (mg/L)

843.48

874.72

<250

Total alkalinity (mg/L)

380

360

<600

Nelakondossi Lake water quality (Table 23) reflected high contamination of water with Eutrophication status. Alkaline pH ranged from 8.36- 8.71. Electric conductivity and total dissolved solids were very high in concentration i.e., 10890- 11160 μS/cm and 7530- 7790 ppm respectively. Dissolved oxygen was found to be as low as zero at inlet site because of higher amount of sewage and industrial waste from nearby industries. The low oxygen was also due to massive growth of water hyacinth and thus the increased organic pollution. The lake bed occupied with small scale industries and water at one side was completely covered with plastic and other waste dumps. Chloride and hardness concentration were observed to be more than the BIS standard limits for surface water because of their high concentration let in to the lake. No fish were found at this high amount of pollution while inhabited water birds.


CURRENT THREATS (Refer Figure 23 and Plate 23)

  1. No defined lake boundary
  2. Washing clothes, Open Defecation,
  3. Construction of buildings next to lake bed
  4. Dumping of solid waste, Industrial waste.

PLATE 23

MACROPHYTE COVER
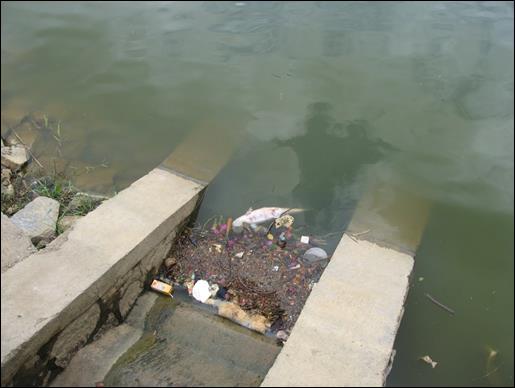
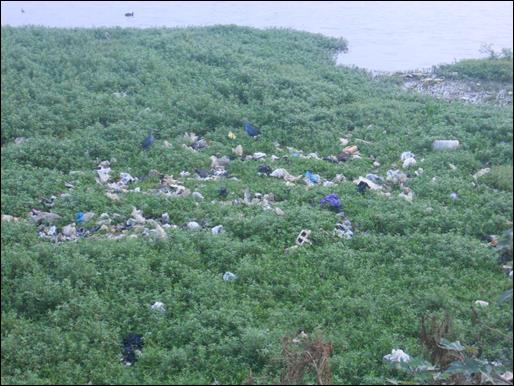
WASTE DUMPING IN LAKE
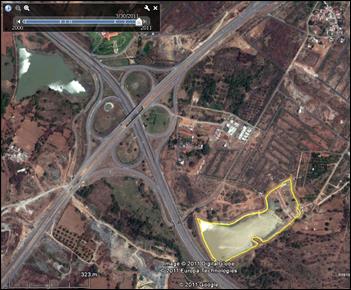
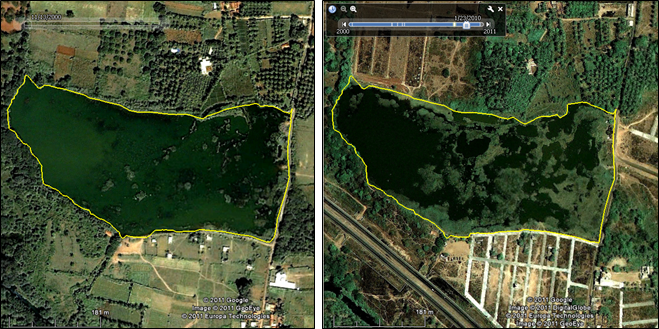
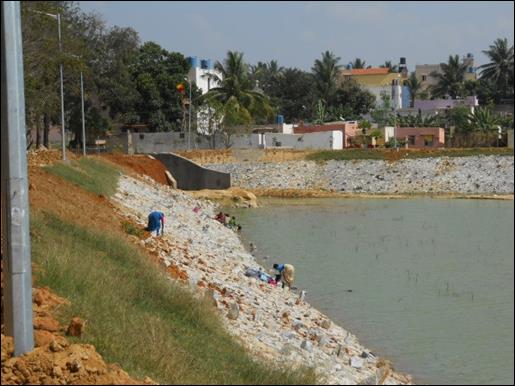
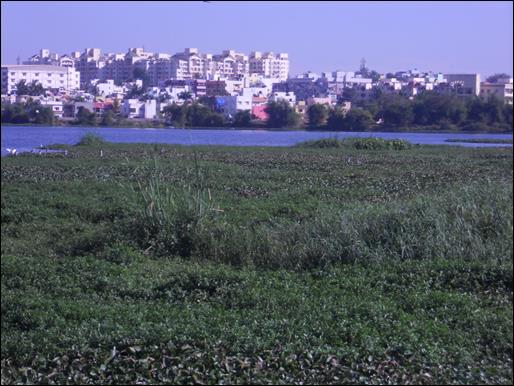
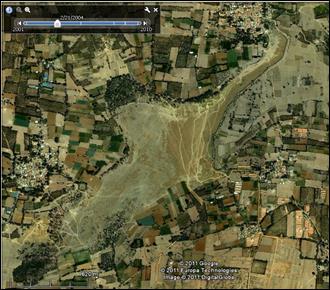
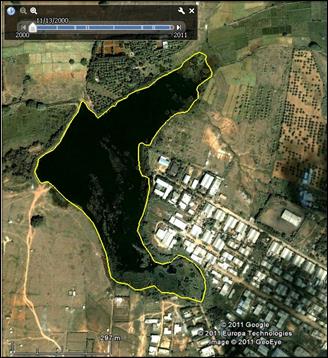
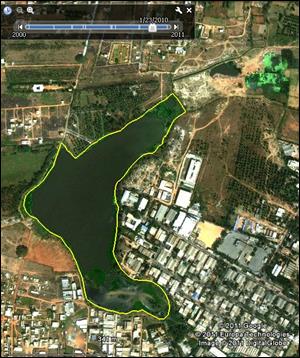
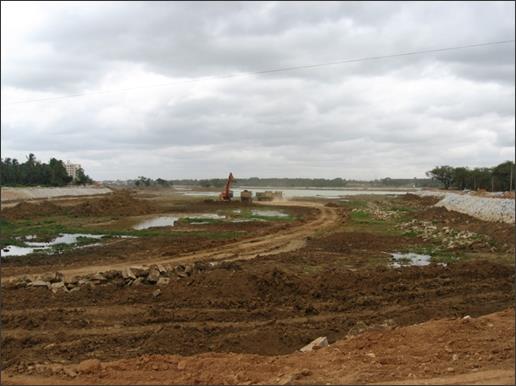
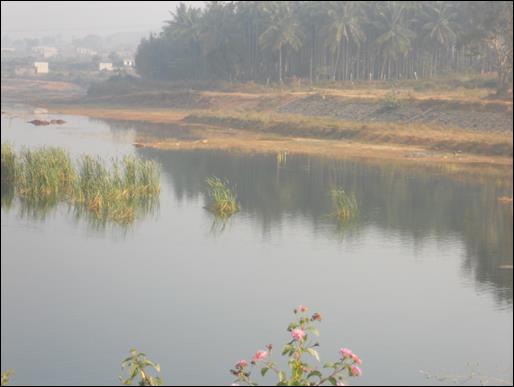
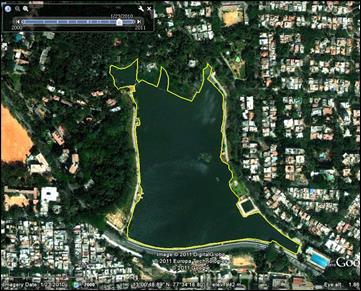
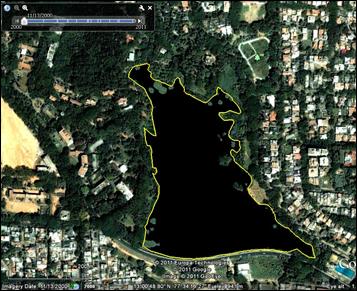
ENCROACHMENTS IN LAKE BED
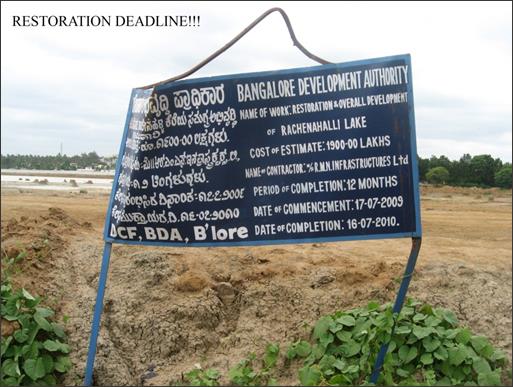
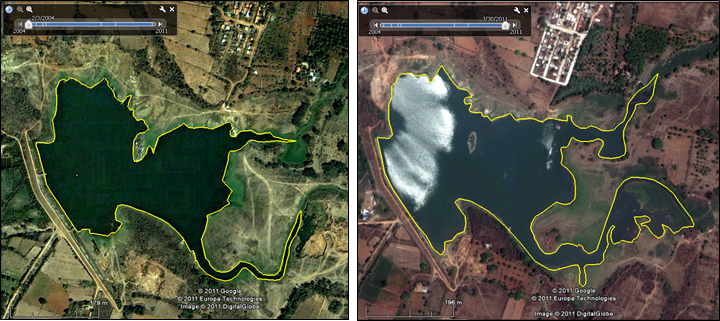
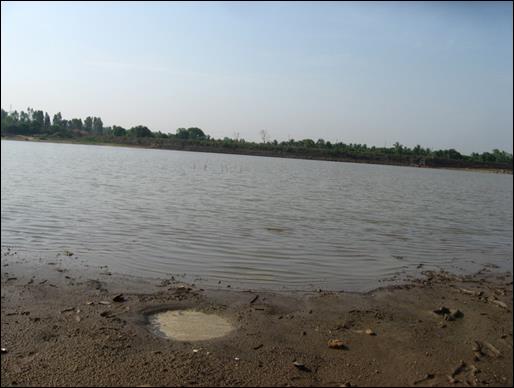
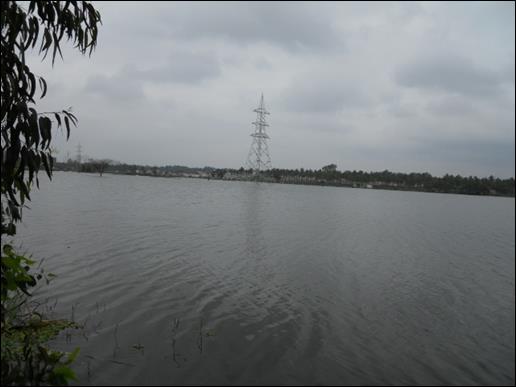
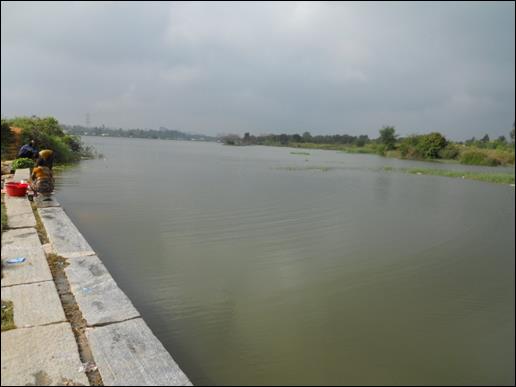
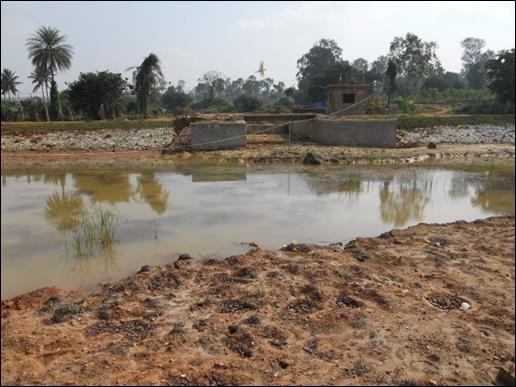
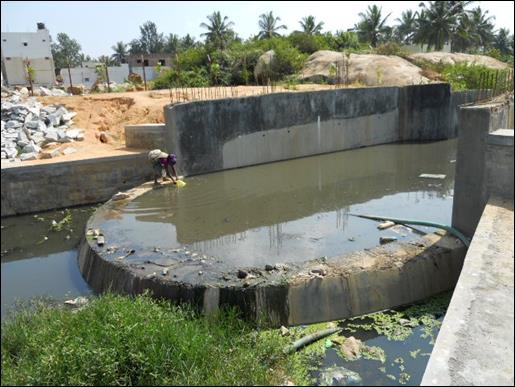
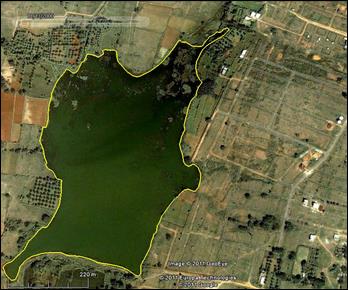
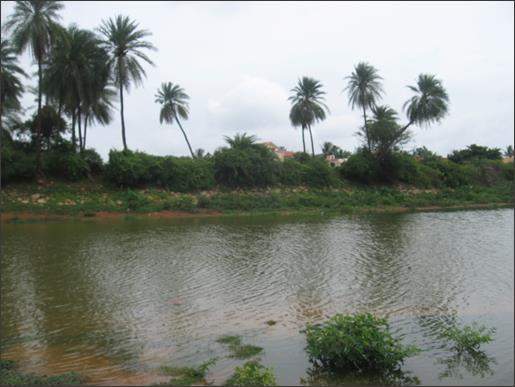
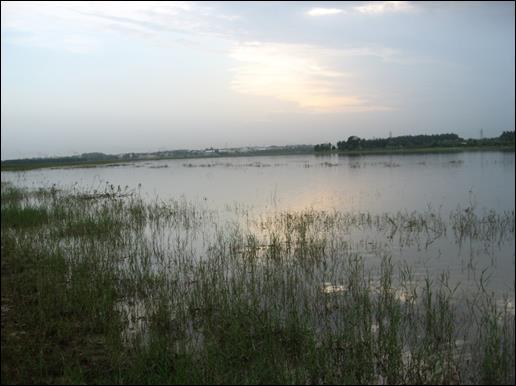
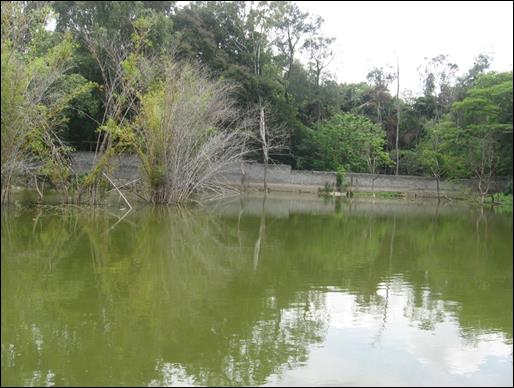
 

24. NELAKONDODDI LAKE

NAME OF THE LAKE

NELAKONDODDI KERE

GEOGRAPHIC DETAILS        LAT/LONG: 12°48'22"N   77°31'47"E

AREA (2004/2011)

9.074/14.75 ha

ORGANIZATION

BBMP (Outskirts of Bangalore BBMP Boundary)

WARD / VILLAGE NAME

Nelakondoddi

STATUS

Clean/ No pollution

RESTORATION

NO

WATER CONDITION

Clean.


Figure 8 Google Earth image and area of Nelakondoddi Lake during 2004 and 2011 respectively

WATER QUALITY

Table 8 Water quality of Nelakondoddi Lake with BIS limits


Sampling site

Nelakondoddi outlet (NLO1)

Nelakondoddi inlet (NLI1)

BIS standards for Surface waters

pH

9.25

9.01

6.5-9

Electric conductivity (μS/cm)

816.00

814.00

<1200

Total dissolved solids (ppm)

562.00

552.00

<700

Dissolved oxygen (mg/L)

7.50

8.50

>5

Biological oxygen demand (ppm)

2.31

2.11

<5

Chemical oxygen demand (ppm)

10.66666667

10.66666667

<30

Nitrates (ppm)

0.25612

0.44917

--

Inorganic phosphates (ppm)

0.120

0.150

--

Total hardness (mg/L)

148

140

<200

Calcium hardness (mg/L)

49.9776672

44.968096

<80

Chlorides (mg/L)

159.04

153.36

<250

Total alkalinity (mg/L)

320

320

<600

Water quality of Nelakondoddi Lake reflected a pristine water condition with conductivity, total dissolved solids, biological oxygen demand and chemical oxygen demand concentrations well within the BIS standards and lesser than the polluted water. Nitrates ranged from 0.256- 0.449 ppm awhile phosphates were 0.12-0.15 ppm.  Total hardness and calcium hardness ranged from 140-148 mg/L and 44.96- 49.97 mg/L respectively. The source of hardness in such lakes could be accounted for local human disturbances such as washing clothes. This lake is located in 10 km buffer zone of Bangalore BBMP boundary and in less populated region and thus less pollution.


CURRENT THREATS (Refer Figure 24 and Plate 24)
Local human disturbances, grazing


PLATE 24


25. RACHENAHALLI LAKE

NAME OF THE LAKE

RACHENAHALLI LAKE

GEOGRAPHIC DETAILS        LAT/LONG: 13°3'45"N  77°36'50"E

AREA (2002/2009)

26.64/ 42.14 ha

ORGANIZATION

BDA

WARD/ VILLAGE NAME

6- Thanisandra

STATUS

Moderate pollution

RESTORATION

July 2009- July 2010 (Incomplete)

WATER CONDITION

Moderate pollution.


Figure 9 Google Earth image and area of Rachenahalli Lake during 2002 and 2009 respectively.


WATER QUALITY

Table 9 Water quality of Rachenahalli Lake with BIS surface water limits


Sampling site

Rachenahalli outlet 1 (RCO1)

Rachenahalli inlet 2 (RCI2)

BIS standards for Surface waters

pH

9.05

9.10

6.5-9

Electric conductivity (μS/cm)

854.33

885.67

<1200

Total dissolved solids (ppm)

609.33

620.00

<700

Dissolved oxygen (mg/L)

7.32

7.75

>5

Biological oxygen demand (ppm)

13.22

24.05

<5

Chemical oxygen demand (ppm)

35.91

77.55

<30

Nitrates (ppm)

0.020

0.018

--

Inorganic phosphates (ppm)

0.023

0.023

--

Total hardness (mg/L)

222.67

221.33

<200

Calcium hardness (mg/L)

80.00

72.67

<80

Chlorides (mg/L)

208.27

191.23

<250

Total alkalinity (mg/L)

120.00

120.00

<600

Rachenahalli water quality has been listed in Table 25. pH was slightly alkaline in condition. EC and TDS ranged to be moderately polluted i.e., 854.3- 885.67 μS/cm and 609-620 ppm respectively. A slight higher amount of organic matter revealed pollution status at both the sampling sites. Total hardness was high at both the sites i.e, range of 221.33-222.67 mg/L because of high amount of calcium and soap water into the lake. The lake was at one side, occupied with agricultural field and to the other side inflow from nearby built-up regions. The restoration has not yet completed which needs immediate attention to properly maintain the water body.


CURRENT THREATS (Refer Figure 25 and Plate 25)

  1. Sewage and Agriculture inflow,
  2. Fishing and local human disturbances
  3. Improper maintenance.
  4. Weed cover


PLATE 25

RESTORATION WORK – JUNE- JULY 2010


26. RAMAPURA LAKE

NAME OF THE LAKE

RAMAPURA LAKE

GEOGRAPHIC DETAILS      LAT/LONG: 13°2'50"N 77°41'23"E

AREA (2002/2010)

47.03/20.81ha

ORGANIZATION

BBMP

WARD / VILLAGE NAME

Rampura

STATUS

Highly polluted

RESTORATION

NO

WATER QUALITY

Poor


Figure 11 Google Earth image and area of Ramasandra Lake during 2000 and 2009 respectively

WATER QUALITY

Table 10 Water quality of Rampura Lake and BIS standard limits


Sampling site

Rampura inlet (RPI1)

Rampura outlet (RPO1)

BIS standards for Surface waters

pH

6.85

7.2

6.5-9

Electric conductivity (μS/cm)

1930

1578

<1200

Total dissolved solids (ppm)

1050

1135

<700

Dissolved oxygen (mg/L)

0.00

0.00

>5

Biological oxygen demand (ppm)

67.93

78.24

<5

Chemical oxygen demand (ppm)

145.86

166.48

<30

Nitrates (ppm)

1.45

1.1

--

Inorganic phosphates (ppm)

2.3

2.41

--

Total hardness (mg/L)

401

382

<200

Calcium hardness (mg/L)

215.5

206

<80

Chlorides (mg/L)

429

420

<250

Total alkalinity (mg/L)

823

683

<600

Rampura water quality is listed in Table 26 which reflects severe pollution at both the sampling sites. Higher electric conductivity and dissolved solids was observed which ranged from 1578-1930 μS/cm and 1050- 1135 ppm at inlet and outlet respectively. Dissolved oxygen was found to be zero at both the sampling site because of no penetration of light as the whole lake is covered with water hyacinth. A part of city’s sewage inflow could be observed at Rampura Lake’s inflow region which is the main source of contamination of water.

CURRENT THREATS (Refer Figure 26 and Plate 26)

  1. Local disturbances such as Dumping of solid waste,
  2. Conversation of lake into land by filling up with soil,
  3. Untreated sewage inflow,
  4. Eutrophication,
  5. Loss of Biodiversity

27. RAMASANDRA LAKE


NAME OF THE LAKE

RAMASANDRA LAKE

GEOGRAPHIC DETAILS         LAT/LONG: 12°56'44"N   77°27'29"E

AREA (2000/2009)

41.84/29.35 ha

ORGANIZATION

BDA

WARD / VILLAGE NAME

Ramasandra

STATUS

Clean

RESTORATION

August 2009- August 2010 (Incomplete)

WATER CONDITION

Good.

WATER QUALITY

Table 11 Water quality of Ramasandra Lake with BIS standard limits


Sampling site

Ramasandra layout site (RMLY)

Ramasandra inlet (RMI1)

Ramasandra outlet (RMO1)

Ramasandra grazing (RMAG)

BIS standards for Surface waters

pH

8.88

8.85

8.60

8.96

6.5-9

Electric conductivity (μS/cm)

516.67

490.00

496.00

466.00

<1200

Total dissolved solids (ppm)

357.67

343.00

356.00

369.33

<700

Dissolved oxygen (mg/L)

6.21

6.67

7.06

6.05

>5

Biological oxygen demand (ppm)

10.68

14.23

13.33

8.88

<5

Chemical oxygen demand (ppm)

26.44

30.99

30.67

24.89

<30

Nitrates (ppm)

0.047

0.051

0.039

0.067

--

Inorganic phosphates (ppm)

0.014

0.001

0.020

0.004

--

Total hardness (mg/L)

112.67

113.33

164.00

129.33

<200

Calcium hardness (mg/L)

34.20

30.73

41.28

33.13

<80

Chlorides (mg/L)

65.13

59.92

100.82

61.53

<250

Total alkalinity (mg/L)

974.00

1088.67

744.00

788.67

<600

Chemical variation in water quality of Ramasandra Lake has been listed in Table 27.  This lake is situated in less populated region and thus less influence of sewage on water quality could be observed. Electric conductivity and total dissolved solids ranged from 466- 516.67 μS/cm and 343- 369 ppm respectively. Least concentration of BOD and COD was observed at grazing sampling site (6.05 ppm and 8.88 ppm) while highest of 14.23 and 30.99 ppm at inlet site. Total hardness was highest at outlet site reasoning the utilization of water for washing, agricultural waste runoff and other human disturbances.


CURRENT THREATS (Refer Figure 27 and Plate 27)
Grazing, Fishing, Sand mining, Agricultural run-off, Local human disturbances.

PLATE 27

INCOMPLETE RESTORATION WORK December- January 2012

RAMASANDRA LAKE PRIOR TO RESTORATION: February 2009


28. RAYASANDRA LAKE


NAME OF THE LAKE

RAYASANDRA LAKE

GEOGRAPHIC DETAILS     LAT/LONG: 12°52'11"N   77°40'35"E

AREA (2004/2010)

-- / 28.59ha

ORGANIZATION

BBMP

WARD / VILLAGE NAME

Jigani

STATUS

Clean – Moderately polluted

RESTORATION

NO

WATER CONDITION

Clean – Moderate.

Figure 12 Google Earth image and area of Rayasandra Lake during 2004 and 2010 respectively.


WATER QUALITY

Table 12 Water quality variables of Rayasandra Lake with BIS limits


Sampling site

Rayasnadra site 1 (RYA1)

Rayasandra outlet (RYO1)

BIS standards for Surface waters

pH

9.12

9.58

6.5-9

Electric conductivity (μS/cm)

901

504.00

<1200

Total dissolved solids (ppm)

719

659.00

<700

Dissolved oxygen (mg/L)

4.63

7.12

>5

Biological oxygen demand (ppm)

14.63

6.54

<5

Chemical oxygen demand (ppm)

30.99

18.68

<30

Nitrates (ppm)

0.044

0.012

--

Inorganic phosphates (ppm)

0.18

0.160

--

Total hardness (mg/L)

135

189.30

<200

Calcium hardness (mg/L)

45.66

112.69

<80

Chlorides (mg/L)

112

95.31

<250

Total alkalinity (mg/L)

210

280.00

<600

Water quality of Rayasandra along with BIS limits is listed in Table 28. Both the sampling site revealed alkaline pH range. Ioinc level and dissolved solids concentration was slightly higher at site 1 when compared to outlet site while hardness of water was higher at outlet due to interruption of human disturbances. The water quality could be categorized as clean to moderate pollution as the pollution causing variables such as chlorides and organic concentration are well within the BIS surface water quality standards.


CURRENT THREATS (Refer Figure 28 and Plate 28)

  1. Local disturbances,
  2. Untreated sewage inflow

Plate28


 29. SANKEY TANK 

Figure 13 Google Earth image and area of Sankey tank during 2000 and 2010 respectively.


WATER QUALITY

Table 13 Water quality of Sankey tank and BIS standards


Sampling site

Sankey tank inlet (SNI1)

Sankey tank outlet (SNO1)

BIS standards for Surface waters

pH

9.66

9.45

6.5-9

Electric conductivity (μS/cm)

710

393

<1200

Total dissolved solids (ppm)

584

270

<700

Dissolved oxygen (mg/L)

6.91

8.94

>5

Biological oxygen demand (ppm)

10.2

10.54

<5

Chemical oxygen demand (ppm)

30.4

31.08

<30

Nitrates (ppm)

0.07

0.05

--

Inorganic phosphates (ppm)

0.56

0.73

--

Total hardness (mg/L)

134

123

<200

Calcium hardness (mg/L)

82

76.5

<80

Chlorides (mg/L)

129

102

<250

Total alkalinity (mg/L)

289

237

<600

Water quality of Sankey tank is listed dn compared with BIS permissible limits in Table 29. Even though this lake has been restored, the water quality reflects pollution status. Both the sampling sites had alkaline pH range. EC and TDS at inlet were higher than the outlet site i.e, 710 μS/cm and 584 ppm at inlet while, 393 μS/cm and 270 ppm at outlet. Except the calcium hardness, chlorides, total hardness and alkalinity were well within the required permissible limits. The inlet receiving untreated sewage was recorded which was also reflected through water quality at inlet site.


CURRENT THREATS (Refer Figure 29 and Plate 29)

  1. Local human disturbances,
  2. Untreated sewage inflow


PLATE 29

EUTROPHIC WATER
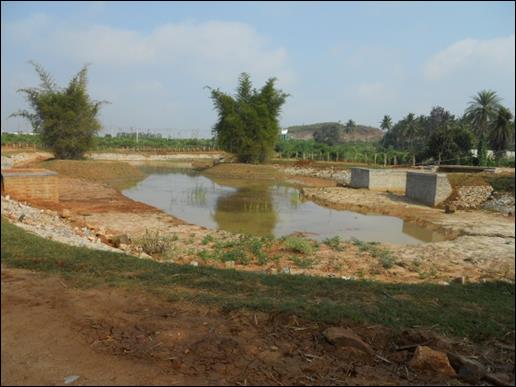
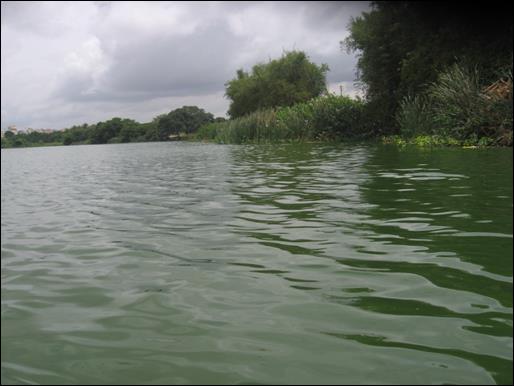
ALGAL BLOOM NEAR INLET


 30. SOMAPURA LAKE

NAME OF THE LAKE

SOMAPURA LAKE

GEOGRAPHIC DETAILS LAT/LONG:12°52'27"N   77°29'54"E

AREA (2004/2011)

3.32/5.405  ha

ORGANIZATION

BDA

WARD / VILLAGE NAME

Somapura

STATUS

Clean – Moderately polluted

RESTORATION

July 2009 – July 2010 (Completed)

WATER CONDITION

Clean – Moderate.


Figure 14 Google Earth image and area of Somapura Lake during 2004 an d2011 respectively


WATER QUALITY

Table 14 water quality variation in Somapura Lake with BIS limits


Sampling site

Somapura inlet (SMI1)

Somapura outlet (SMO1)

Somapura middle (SMM1)

BIS standards for Surface waters

pH

8.77

8.72

8.60

6.5-9

Electric conductivity (μS/cm)

1020.67

1024

1021.50

<1200

Total dissolved solids (ppm)

708.67

709.67

721.00

<700

Dissolved oxygen (mg/L)

6.69

6.29

7.56

>5

Biological oxygen demand (ppm)

12.88

4.31

5.98

<5

Chemical oxygen demand (ppm)

36.00

16.67

18.00

<30

Nitrates (ppm)

0.078

0.075

0.074

--

Inorganic phosphates (ppm)

0.044

0.046

0.042

--

Total hardness (mg/L)

112.67

109.33

112.00

<200

Calcium hardness (mg/L)

31.00

33.67

34.47

<80

Chlorides (mg/L)

120.70

82.36

115.02

<250

Total alkalinity (mg/L)

265.33

286.67

192.00

<600

Water quality of Somapura Lake has been listed in Table 30 which reflected clean to moderate water quality at all the sampling sites. Among all the variables recorded, electric conductivity was found to be high ranging from 1020.67- 1024 μS/cm which is slightly lesser than the BIS limits from surface standards. Apart from sewage inflow, the asphalted road in addition contributed to lake contamination with chloride concentration. Organic pollution was slightly higher at inlet with 12.88 ppm of BOD and 36 ppm of COD concentrations. The only pollution source found was sewage at inflow which if treated will help in balancing the ecosystem.


CURRENT THREATS (Refer Figure 30 and Plate 30)

  1. Local disturbances
  2. Untreated sewage inflow

PLATE 30