Dr. T.V. Ramachandra
Centre for Sustainable Technologies, Centre for infrastructure, Sustainable Transportation and Urban Planning (CiSTUP), Energy & Wetlands Research Group, Centre for Ecological Sciences, Indian Institute of Science, Bangalore – 560 012, INDIA.
E-mail : tvr@iisc.ac.in
Tel: 91-080-22933099/23600985,
Fax: 91-080-23601428/23600085
Web: http://ces.iisc.ac.in/energy
Subash Chandran M.D Energy & Wetlands Research Group, Centre for Ecological Sciences, Indian Institute of Science, Bangalore – 560 012, INDIA.
E-mail: subhashc@iisc.ac.in
Joshi N.VEnergy & Wetlands Research Group, Centre for Ecological Sciences, Indian Institute of Science, Bangalore – 560 012, INDIA.
E-mail: nvjoshi@iisc.ac.in
Bharath SetturuEnergy & Wetlands Research Group, Centre for Ecological Sciences, Indian Institute of Science, Bangalore – 560 012, INDIA.
E-mail: setturb@iisc.ac.in
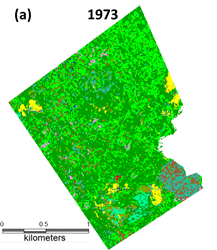
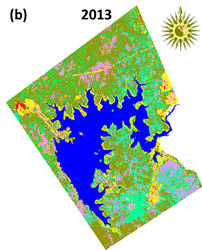
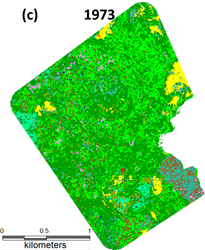
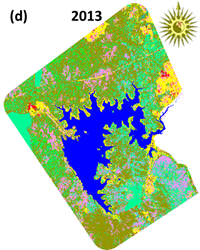
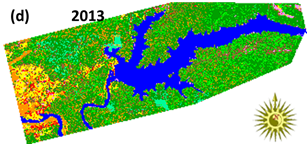
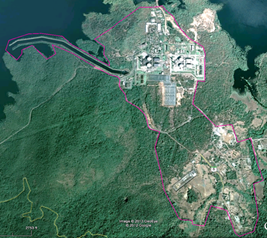
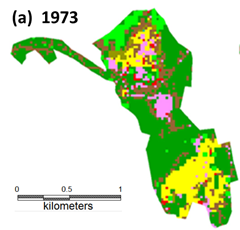
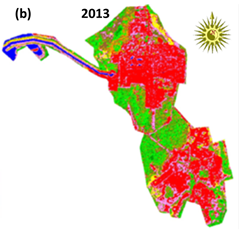
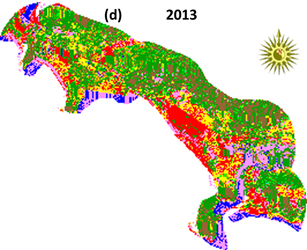
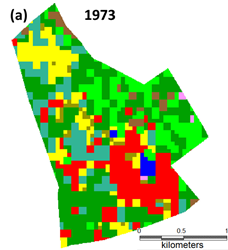
Citation:Ramachandra T.V., Subash Chandran M.D., Joshi N.V. and Bharath Setturu, 2013. Land use changes with the implementation of Developmental projects in Uttara Kannada district, Sahyadri Conservation Series 31, ENVIS Technical Report 61, ENVIS, Centre for Ecological Sciences, Indian Institute of science, Bangalore 560012.
| Contact Address : |
| |
Dr. T.V. Ramachandra
Energy & Wetlands Research Group,
Centre for Ecological Sciences, TE 15, New Biology Building, Third Floor, E Wing, [Near D Gate], Indian Institute of Science, Bangalore – 560 012, INDIA.
Tel : 91-80-22933099 / 22933503-extn 107
Fax : 91-80-23601428 / 23600085 / 23600683 [CES-TVR]
E-mail : tvr@iisc.ac.in, energy@ces.iisc.ac.in,
Web : http://wgbis.ces.iisc.ac.in/energy |
|