ENVIS Technical Report: 25 |
|
|
 |
ECOLOGICAL ASSESSMENT OF LENTIC WATER BODIES OF BANGALORE T. V. Ramachandra and Malvikaa Solanki
|
 |
|
|
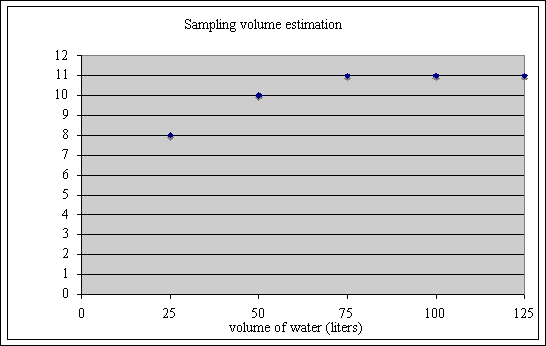
RESULTS AND DISCUSSION Water samples collected from Chamarajasagar reservoir and Madiwala Lake were assessed for physico-chemical and biological parameters. Biological parameter assessment also includes an experiment to arrive at a representative sampling volume of water to be filtered for phytoplankton analysis. Different volumes (25, 50, 75, 100 and 125 litres) of samples were collected, filtered, concentrated and analysed to estimate the composition (species richness) and counts of phytoplankton. It was found that 100 litres of lake water was a more appropriate sampling volume as per the experiment listed in Table 5.1 and the figure 5.1. Table 5.1: Standardisation of sampling volume for phytoplankton analysis
As is evident from the data and graph, 100 litres seemed to be the most appropriate volume for the current study as further effort in sampling did not include new species and the number of species has reached the threshold (which initially showed increasing trend and was stabilised at 100 l). Consequently, this was taken as the standard amount of sample volume throughout the study.
Physico-chemical analysis Samples were collected from sites covering the inlets, centre and the outlets. Five sampling sites were selected for analysis of various parameters from Chamarajasagar reservoir and six sampling sites from Madiwala Lake. The results of the analysis are presented in this section. Chamarajasagar reservoir Table 5.2: Chamarajasagar reservoir – physico chemical analysis
Electric conductivity was in the range of 284.67 – 307.33 µS/cm, indicating less dissolved solids and no major source of pollution from the catchment. Transparency was not too good given the drinking use value of the water source. Remarkably this drinking water source had relatively high density of algae (an average of 1300 organisms per litre) due to which the transparency was reduced. Dissolved oxygen is relatively higher than the desirable limits in the sampling points 1, 2, 3, which are located at the inlets of Kumudavati and Arkavati. DO at the sampling point 5; the centre of the reservoir is below the desirable limits. This may be due to the less turbulence in the centre, which has resulted in the less contact between the atmosphere and the water surface resulting in low DO content owing to the less solubility of oxygen in water. Relatively higher concentration of oxygen at other sampling points is due to enough turbulence created in the region. The other physico – chemical parameter values are well within the tolerance limits indicating that there is no major threat to the water quality of this waterbody. Madiwala Lake Table 5.3: Madiwala lake– physico chemical analysis
The sampling point 5 at the outlet has the lowest DO (1.94 mg/L), which, at the time of sampling was replete with weeds and water hyacinth. The other point 6, which is also another outlet, has a reduced DO owing to the washing activities at the dhobi ghat located on the banks. Overall, the DO content of the lake is low owing to the organic pollution due to sewage inflow, and high phytoplankton density. Alkalinity of Madiwala lake water was also found to be high, probably due to the increased inflow from the dhobi ghat (located on the southeastern side of the lake), anthropogenic activities and dissolved alkaline substances. A comparison of the physico chemical anlaysis of both the waterbodies is listed in the table 5.4. Table 5.4: Chamarajasagar reservoir and Madiwala Lake – physico chemical analysis
*Tolerance limit is as prescribed by the Indian Standards Institution (IS 10500-1989).
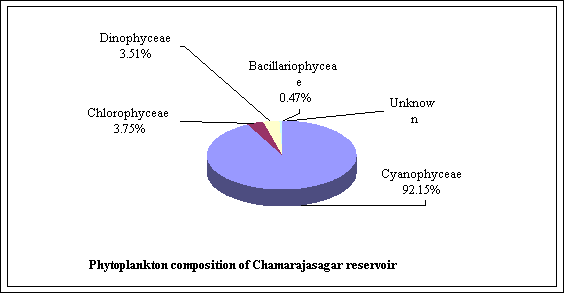
Phytoplankton analysis The study revealed that the two tropical waterbodies under study, Chamarajasagar reservoir and Madiwala Lake sustain dense populations of phytoplankton. However, the density of phytoplankton is less in Chamarajasagar reservoir. In soft waters the population density is observed to be less and generally does not exceed a few thousands of organisms per litre, as is the case with Chamarajasagar reservoir. The formula for calculating the number of organisms per litre of the sample using the drop count method is as below: Total plankton count per litre = A *(1/L)*(n/v) Chamarajasagar reservoir Table 5.5: Chamarajasagar reservoir – phytoplankton counts at five sampling sites
per litre respectively. The waters here are not influenced by any activities as in the cases of sampling points 3 and 4. Table 5.6: Chamarajasagar reservoir – summary of phytoplankton counts and composition
comprising of one single species of Microsystis aeruginosa. the next major class of algae is Chlorophyceae (3.75 percent) members followed by Dinophyceae (3.51 percent),
Bacillariophyceae (0.47 percent) and an unknown class (0.12 percent). The Chlorophyceae class includes Pediastrum duplex members of the order Chlorococcales. Dinophyceae consists of a single species Ceratium hirundinella. As compared to the other classes of algae, Bacillariophyceae sp. Synedra sp.. and Rhopalodia gibba were recorded as the least in number. Madiwala Lake Table 5.7: Madiwala Lake – phytoplankton counts at six sampling site
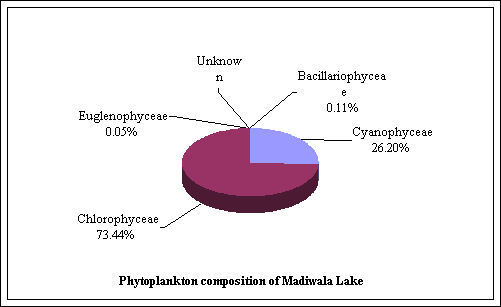
primary treatment High numbers of Chlorophyceae species , (73.44 peercent) which, dominate the lake waters is an indication of organic pollution. The phytoplankton composition of Madiwala Lake consists of five classes (fig 5.3 and table 5.8) including Table 5.8: Madiwala Lake – summary of phytoplankton counts and composition
species of an unknown class. Chlorophyceae species were dominated by Chlorella spp., followed by Pediastrum duplex, Pediastrum simplex, Pediastrum tetras, Scenedesmus spp., Actinastrum spp., Tetraedron spp., and Crucigenia spp. all mentioned in the order of dominance. The next major class of phytoplankton in Madiwala Lake was Cyanophyceae (26.20 percent), which was dominated by Microcystis aeruginosa. followed by Spirulina sp..This dominance again is noticeable at the sampling point 1 (Table 5.8), which is at the inlet, where sewage is let in from the Sewage treatment plant. Bacillariophyceae and Euglenophyceae consisted of a single species Navicula sp. and Phacus sp. respectively.
As compared to the other classes Euglenophyceae and Bacillariophyceae species were the lowest in numbers. The species of phytoplankton common to both the waterbodies under study have been presented in the table 5.9. Similarly, species unique to Chamarajasagar reservoir and species unique to Madiwala Lake have been tabulated in tables 5.10 and 5.11 respectively. Table 5.9: Species of phytoplankton common to Madiwala Lake and Chamarajasagar reservoir
Table 5.11: Species unique to Madiwala Lake
Table 5.10: Species unique to Chamarajasagar reservoir
Zooplankton Zooplankton by their heterotrophic activity play a key role in the cycling of organic materials in aquatic ecosystems. Zooplankton, like phytoplankton have long been used as indicators of water quality. Rotifers form an important cosmopolitan component of the zooplankton and they are one of the principal links in the food chain. Copepods and cladocerons are the principal planktonic groups of microcrustaceans present in waterbodies. Due to the limitations of time and resources, a detailed analysis of zooplankton and the other organisms in the aquatic food chain was not possible. However, the list of other organisms observed during the study is presented in the tables below. The limited study reveals that the zooplankton community in surface waters of both the waterbodies is comprised of Rotifera, microcrustaceans – Cladocera and Copepoda. Fish The fisheries department at both the study lakes is in charge of the fishing operations. The fishes have been introduced by them for commercial fishing and therefore there are only a few types of fishes in the lake and are mentioned in the table 5.12. Fish forms the upper trophic levels of an aquatic food chain. They feed on detritus, zooplankton, phytoplanakton, macroinvertebrates and other aquatic organisms and thus can Table 5.12: Fish observed at the study areas
be of use in indicating the cumulative effect of pollution on its habitat – water. For example, increase in temperatures can alter the population structure of fishes – increasing less desirable species and reducing the desirable species. Similarly, pH and DO of the environment is very important for the survival of fish. Birds Wetlands support a large diversity of avifauna. Wetland birds form an important link in the aquatic food chain depending on the wetland and other wetland associated organisms for foraging, breeding, resting, nesting, etc. Aquatic vegetation is a valuable source of food, especially for waterfowl. Birds have also been used as indicators of the health of a waterbody. During the period of the investigation at the study area a few birds that were observed have been listed in table 5.13. Table 5.13: Birds observed at the study areas
|
|||||||||||||||||||||||||||||||||||||||||||||||||||||||||||||||||||||||||||||||||||||||||||||||||||||||||||||||||||||||||||||||||||||||||||||||||||||||||||||||||||||||||||||||||||||||||||||||||||||||||||||||||||||||||||||||||||||||||||||||||||||||||||||||||||||||||||||||||||||||||||||||||||||||||||||||||||||||||||||||||||||||||||||||||||||||||||||||||||||||||||||||||||||||||||||||||||||||||||||||||||||||||||||||||||||||||||||||||||||||||||||||||||||||||||||||||||||||||||||||||||||||||||||||||||||||||||||||||||||||||||||||||||||||||||||||||||||||||||||||||||||||||||||||||||||||||||||||||||||||||||||||||||||||||||||||||||||||||||||||||||||||||||||||||||||||||||||||||||||||||||||||||||||||||||||||||||||||||||||||||||||||||||||||||||||||||||||||||||||||||||||||||||||||||||||||||||||||||||||||||||||||||||||||||||||||||||||||||||||||||||||||||||||||||||||||||||||||||||||||||||||||||||||||||||||||||||||||||||||||||||||||||||||||||||||||||||||||||||||||||||||||||||||||||||||||||||||||||||||||
|