

INTRODUCTION
Forests constitute a key natural resource as well as a source of environmental services, and are considered valuable, because they provide a wide range of benefits to the society: products (timber, fuelwood, fodder, green manure, minor produce, medicines, etc.), ecosystem services (soil conservation, hydrological regulation, carbon sequestration, etc.) and repository of biodiversity. Hence, the vegetation studies forms a vital component of any natural resource management. An ideal forest monitoring should therefore provide information on the levels of each of these stock or benefits being produced by a forest. Development of sound forest conservation and management strategies requires an understanding of the spatial and temporal patterns in the forest condition. The present study assesses the condition of the forests of Uttara Kannada district of Karnataka State, which is a heavily forested district constituting the Western Ghats and aims at determining the temporal and spatial transformation in the forested area of Uttara Kannada. The rapidly developing techniques of remote sensing and geographical information systems (GIS) potentially play a significant role in such analysis of forest condition. With the advent of remote sensing technologies, especially the satellite imagery which enables large area coverage, the mid 80s saw the first attempts to come up with comprehensive forest assessments (NRSA, 1983). The present work focuses on vegetation status in Uttara Kannada district.
Western Ghats : The forests of the Western Ghats region of peninsular India have undergone significant transformations over the past century, and the nature, extent and causes of these transformations have been due to deforestation, rapid urbanisation, conversion of natural forests into agricultural lands and plantations, etc. Uttara Kannada district in the Western Ghats is known for their dense forests which cover about 80% of the area of the district (Anon, 1982). The Western Ghats forms a practically unbroken relief dominating the western coast of the Indian peninsula for almost 1600 km. They extend from the mouth of river Tapti (21o N latitude) to the tip of South India (8o N latitude) and the Palghat gap is only gap in the chain. This apparent unity in fact masks the great heterogeneity of the environmental conditions resulting from geographical, geological, and demographic differences.
The Western Ghats rain forests have strongly seasonal climate. The Ghats have substantial tracts of the tropical lowland evergreen rain forest formation (Whitmore, 1984) in areas where there is a dry season of upto 7 months. The most extreme case is the lowland evergreen "Kan" forest of Sorab, Karnataka, where a dry season of this length is regularly combined with an annual rainfall of 1500 1800 mm (Pascal, 1986). The Ghats forests have floristically tropical vegetation, yet in the winter dry season they are exposed to very low temperatures.
The Western Ghats are a range of hills extending from the southern portion of Gujarat to Kanyakumari in Tamilnadu, running almost parallel to the Arabian Sea coast. The hills vary in height from about 200 3000 m. On the western side, the distance between the seacoast and the crest of the Ghats varies from 4 100 km. On the eastern side ramify into the hills which eventually merge with the Deccan tableland. The Western Ghats region has some of the richest forests in India.
The major types of forests are the following:
- Tropical wet evergreen forests, situated along the upper slopes and protected valleys.
- Semi evergreen forests situated along the lower western slopes.
- Moist deciduous forests which constitute over 50% of the forest in the Western Ghats and contain many commercially valuable species.
- Dry deciduous forests which form a small percentage of the lower foot of the eastern slopes, and
- Grassy blanks which occur along the crest of upper slopes, where the vegetation mainly consists of coarse grass.
Working plans prepared by the Forest Department for different regions of the Western Ghats prescribe the norms for managing the forest in each area, taking into account the quality of forests, terrain and ecology. Over 13,000 species of higher plants have been recorded from India, of which about 27% occur in the Western Ghats. There are 58 endemic genera mostly confined to the Western Ghats. Endemic tree genera are Erinocarpus, Meteromyrtus, Otonephelium, Poeciloneuron and Pseudoglochidion.
Geographic Information Systems (GIS) are specialized data systems that preserve location identities of the information they record (Campbell, 1996) and consists of a series of overlays for a specific geographic region. These overlays may depict raw data or may show thematic information, such as soils, landuse or geology. Although these data can be visualised as a set of superimposed images, they are infact stored in digital form, suitable for retrieval and analysis.
Data for GIS can be derived from many alternative sources. For example, topographic data can be derived from topographic maps (such as of Survey of India toposheets), which also provide information on the streams, highways and forested areas. These informations are prepared by digitization. Data can also be derived from aerial photographs or other images from airborne or spaceborne sensors. The other data available is the archived data, generated in digital form. Examples include, the data for Indias Census, available in digital form at the National Informatics Centre (http://www.nic.in), topographic elevation data provided by the Survey of India, land use data provided by Land records departments (State level), and remotely sensed data gathered by IRS (Indian Remote Sensing), LANDSAT, etc.GPS technology aids as convenient, inexpensive and accurate measurement of absolute location. GPSs have greatly enhanced the usefulness of remote sensing data, especially when it is necessary to integrate image data with field data for geocorrection, geo registration and for ground truthing (collection of field data at a specific location). A GPS receiver consists of a portable receiving unit sensitive to signals transmitted by a network of earth orbiting satellites. A system of 24 satellites is positioned at an altitude of about 17,600 km, to circle the earth at intervals of 12 hours, spaced in 6 orbital planes to provide complete coverage to the earth's surface. These satellites continuously broadcast one way signals within the L band region of the microwave spectrum. These signals permit GPS receivers to estimate latitude, longitude, and elevation. If a receiver can acquire data as many as 4 satellites, it is possible to estimate both vertical and horizontal positions. In point positioning mode, a single GPS unit can establish horizontal location within 20 m with 95% accuracy, and vertical location within 30 m.
Remote sensing is the practice of deriving information about the earth's features using images acquired from an overhead perspective, using electromagnetic radiation in one or more regions of the electromagnetic spectrum, reflected or emitted from the earth's surface. Analysed remote sensing data is combined with other data for a specific application. Remote sensing data aids in natural resource management to maintain sustainable development of a region.
INDIAN REMOTE SENSING
After two coarse-resolution remote sensing satellites in the 1970s and 1980s, India began to develop multispectral remote sensing programs in the style of the LANDSAT system. During the early 1990s, two Indian Remote Sensing (IRS) satellites were launched and put to use. IRS-1A (launched in 1988), and IRS-1B (launched in 1991) carry the Linear Imaging and Self Scanning Sensors- LISS-I and LISS-II sensors. These instruments collect data in four bands: blue (0.45-0.52 micro m), green (0.52-0.59 micro m), red (0.62-0.68 micro m, and near infra red (0.77-0.86 micro m). LISS-I provides a resolution of 72.5 m in a 148 km swath, and LISS-II has a resolution of 36.25 m. LISS-III sensor is used with IRS-1C and IRS-1D, which were launched in the 1993 and 1996 respectively. LISS-III acquires information in four bands: green (0.52-0.59 micro m), red (0.62-0.68 micro m), near infra red (0.77-0.86 micro m), and short wave infra red (1.55-1.70 micro m). LISS-III provides 23.5 m resolution for all bands, except the short wave infra red, which has a resolution of 70 m. Apart from LISS-III, the IRS-1C and IRS-1D satellites are equipped with Panchromatic (PAN) sensor, and Wide field Sensor (WiFS). The PAN sensor has a spatial resolution of 5.8 m and operates in a single panchromatic spectral band (0.5-0.75 micro m).
REVIEW OF LITERATURE
Using a landscape guided approach, Smiet, (1996), assessed and mapped the geomorphology, landcover and vegetation. The study established the extent of forest degradation and evaluated potential effects on the local hydrology, soil erosion and biodiversity. Xing et.al, (1998), did the change detection with an accuracy of 61% through parameters such as biomass, brightness and wetness indicators using Landsat thematic mapper data. The land use classifications obtained by visual interpretation and digital processing were compared by Mas and Ramtrez, (1996). The overall accuracy obtained by only spectral data classification was quite poor, while the GIS procedures produced an improvement of 4 to 9%. The visual classification yielded an overall accuracy of 83%, which was considerably higher. An additional improvement was obtained in all classification by grouping the forest classes into a single class. Here too, the visual classification presented an overall accuracy 10% higher than that of the best digital classification.
Landuse/Landcover change analysis using multi date data from SoI topographical maps and Landsat TM digital data for Mumbai Navi Mumbai cities and its effects on the drainage basins and channels by Samant and Subramanyan, (1998), revealed 55% reduction in forest, while a 300% increase in built up land in the last 70 years due to the population pressure.
Landuse/Landcover mapping and change detection using Landsat 5 TM and IRS A LISS III data in Thiruvallur area of Chengai, MGR district in TN, by Palaniyandi and Nagarathnam, (1997), during the years 1986 90. It was observed that the built up area and the agricultural land increased and forest cover and wasteland decreased. Temporal studies of landuse/landcover in Varaha river basin, Andhra Pradesh, India by Murthy and Rao, (1997), was carried out using remote sensing data of 1986 and 1992. Visual interpretation techniques were followed to delineate landuse/landcover categories. The image characteristics such as size, shape, shadow, tone, color, texture, pattern, etc. were considered for interpretation. Maps depicting various landuse/landcover were generated using ground truth data. The results revealed significant changes in the area of built up land irrigated land, plantation, degraded forest and upland over a period of 6 years.
Akbar Sha, (1988), classified the forest Uttara Kannada district based on the density of vegetation as Partially open forest (0.2 0.4 density), Medium density forest (0.4 0.8), Closed forest (greater than 0.8). Pascal (1986) focusses on the species diversity, endemic tree species of Western Ghats, vegetation cover, characteristic species, and structure of the forest and floristic composition of the wet evergreen Forests Western Ghats. Daniels (1989) classified Uttara Kannada into 5 forest zones namely, the coastal, northern evergreen, southern evergreen, moist deciduous, and dry deciduous zones.
Murali et.al. (1998) offer a method for classifying the vegetation at tree, shrub and herb layers utilizing GIS and other statistical tools. This method views the forest a continuous stretch of land and not as discrete patches. Their studies suggest that the spatial dynamics of vegetation at one layer may not reflect that at others. Also mapping the diversity of the forest ecosystem could be possible. Menon and Bawa (1997) inferred that remote sensing imageries can be used to assess the health of forest ecosystem and the extent of degradation. Fuzzy classification models and vegetation indices (i.e. NDVI) were used to estimate regeneration levels, biomass, and species composition at the pixel levels. Prasad et.al. (1998), worked on the conservation planning for the Western Ghats of Kerala using GIS techniques for location of biodiversity hot spots. Results of the study reveal an increase of 194 km2 of evergreen forests in Periyar division, and a decrease in deciduous forests in 10 out of 20 forest divisions. Also there has been a massive increase in the forest plantations from 1.62% to 47.57% in certain divisions. Udayalaksmi et.al.(1998), delineated bioclimatic zones by integrating spectrally separable broad forest types from the satellite data, climate data on rainfall, temperature and physiography. Forests of Uttara Kannada were classified based on the forest type, density, rainfall, and temperature.
STUDY AREA : UTTARA KANNADA DISTRICT |
TOP |
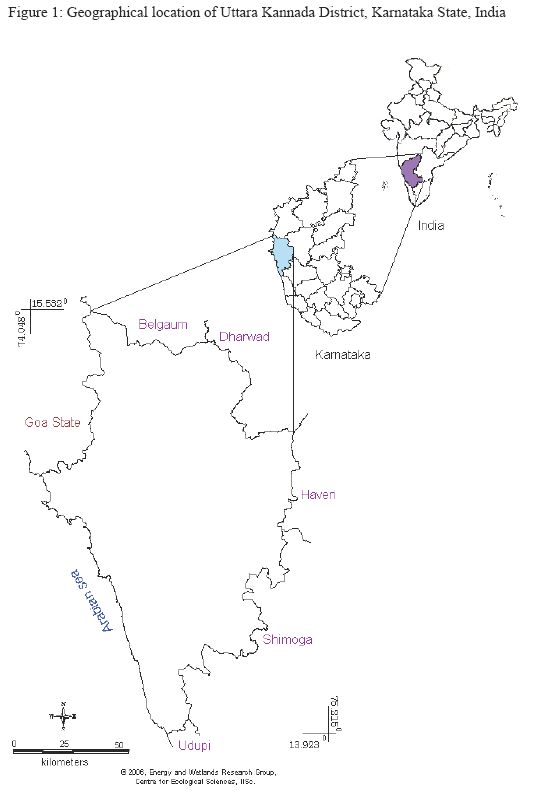
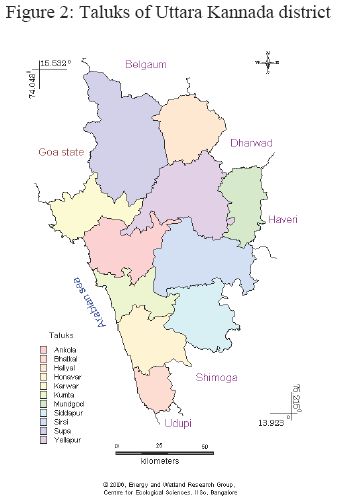
Uttara Kannada (North Canara) district lies between 13.9220o N to 15.5252o N latitude and 74.0852o E to 75.0999o E longitude (Figure 1) and covers an area of 10,291 km2. It extends from north south to a maximum of 180 km, and from west to east a maximum width of 110 km. The Arabian Sea borders it on the west creating a long continuous, though narrow, coastline of 120 km running north south. Goa Belgaum, Dharwad and Shimoga Dakshina Kannada form the northern, eastern and southern boundaries respectively. Uttara Kannada district is one of the northernmost districts in Karnataka State. The district comprises of 11 Taluks namely, Supa, Haliyal, Mundgod, Yellapur, Karwar, Ankola, Sirsi, Siddapur, Honnavar, Kumta and Bhatkal (Figure 2).
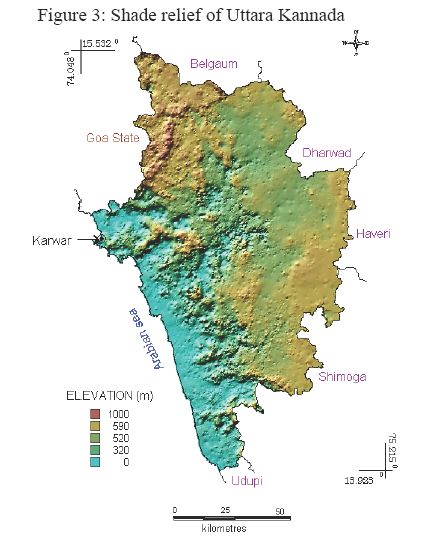
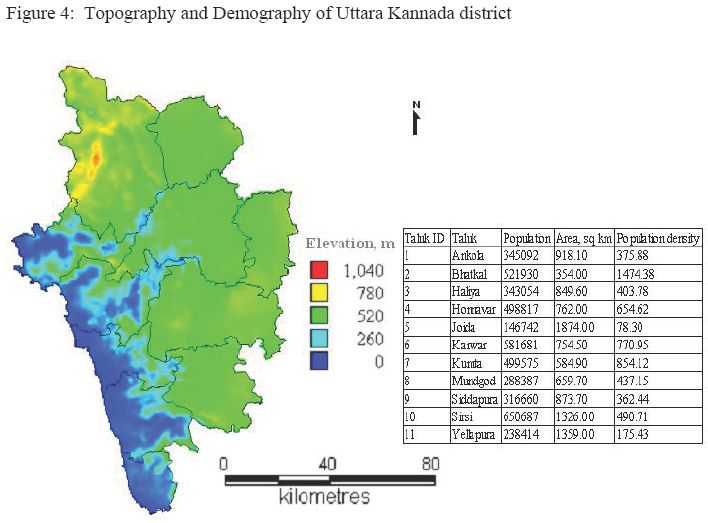
Topographically, the district can be divided into 3 distinct zones namely narrow and flat coastal zone, abruptly rising ridge zone and elevated flatter eastern zone. The coastal zone is thickly populated with coconut clad villages. Ridge zone is a part of the main range of Western Ghats, which runs north to south, parallel to the coast. The flat eastern zone joins the Deccan plateau. Figure 3 provides the shade relief while Figure 4 illustrates topographic differentiation of taluks with demographic details.
- The taluks, which comprises the narrow flat coastal zone, are: Karwar, Ankola, Kumta, Honnavar and Bhatkal.
- The taluks, which comprises the ridge zone, are: Supa, Haliyal, Yellapur, western Sirsi, and western Siddapur.
- The taluks which comprises the flatter eastern zone are: Mundgod, eastern Sirsi and eastern Siddapur.
The geographic area, area under forest, population density, and livestock density of each taluk of Uttara Kannada district is listed in Table 1. Supa is the largest taluk in Uttara Kannada in terms of area. It is seen that the highest populated taluk is Sirsi, whereas the percentage of population increase over a period of 40 years is maximum in Mundgod taluk. The forested area is largest in Yellapur followed by Supa taluk.
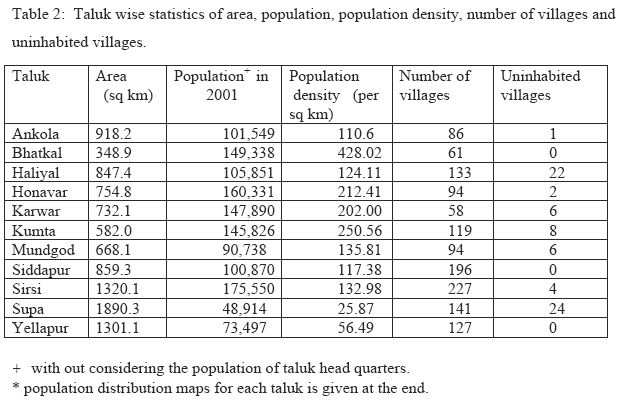
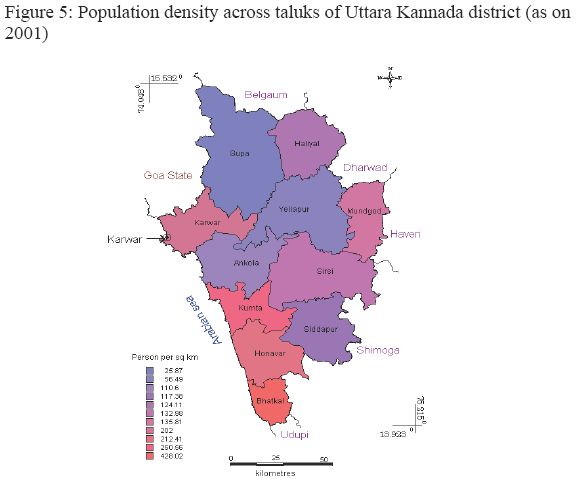
The population according to 2001 census data was 1,353,644 which amount to a population density of 132.42 persons per sq km implying a growth of 10.9 % in population data of 1991. Table 2 lists talukwise population density that indicates Bhatkal taluk has maximum, while Supa taluk has minimum population density and the same is illustrated in Figure 5.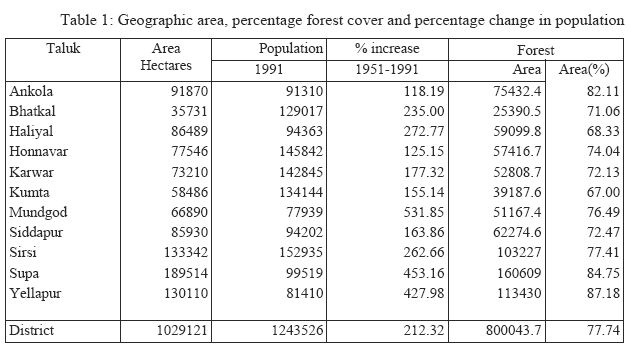
RIVER SYSTEM : Five major rivers of Uttara Kannada, namely, Bedthi (Bedti / Gangavalli), Aganashini (Tadri), Varda, Sharavathi and Kali, illustrated in Figure 6 form the major sources of drainage system in Uttara Kannada. These rivers flow from west through the district into the Arabian Sea. Most of the streams in the hilly tract have a long length of flow. Some of the most spectacular waterfalls of the country such as Jog Falls, Unchalli Falls, and Magod Falls are found in Uttara Kannada. The point where the rivers meet the sea, some of the finest estuaries are present.
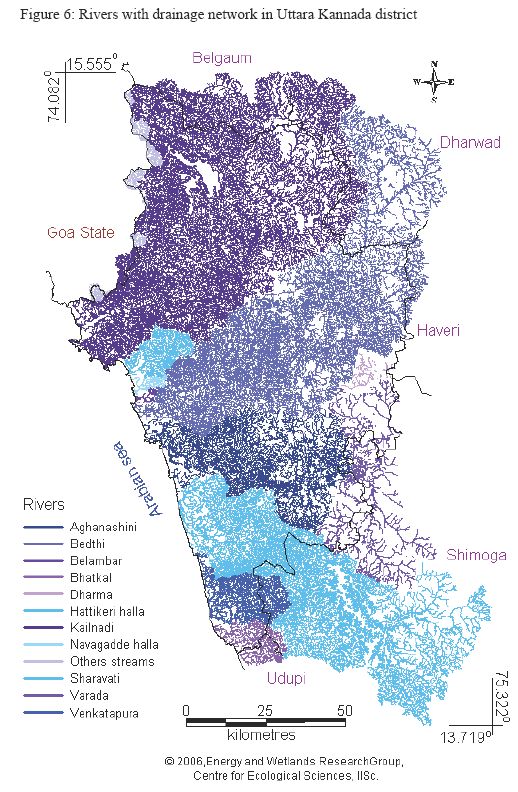
Kali river consists of two major streams namely, Pandri and Digi hole, which flows into each other near Supa. The two streams flow in the eastward direction. The river thus formed continues to flow in the south direction for a distance of about 50 km and then takes a sudden westward turn. At this place, called the Lalguli Falls, the west flowing Thattihalla stream also joins the Kali and the river flows west till it falls into the Arabian Sea near Karwar.
Bedthi or Gangavali also consists of two main streams, Shalmali, which originates in the south of Dharwad, and Bedthi, which originates near Hubli. These two streams flows west and south-west for a total distance of 96 km. On its meandering way into the Arabian Sea, the river dashes down the western face of the Sahyadri to form the Magod Falls.
Aganashini, also known as Tadri, flows into the Arabian Sea about 10 km south of Bedthi. This river is also composed of two major streams besides Benneholla (Benehalla). Two of these streams originate in Sirsi taluk and flows southward. The other stream flows across the entire breadth of Siddapur taluk in a westerly direction. A short distance to the west from here, the river leaps down a precipitous rock to form the Unchalli Falls. From Mirjan, near Kumta the river forms a lagoon, which runs parallel to the coast for about 13 km.
Sharavathi, also known as Banaganga, originates in the Shimoga district. It flows in the north westerly direction. Near the border of the district after covering a distance of 64 km, the river bends to the west, and for about 13 km forms the natural boundary between Uttara Kannada and Shimoga. Near Kodkani, the place where the river touches the district boundary, the river leaps over a precipice, about 260 m in height, to form four distinct cascades known as Raja, Roarer, Rani and Rocket. These falls have acquired world fame as the Jog Falls.
Besides these major rivers there are several streams and rivulets. Varda and Dharma are the two important east-flowing rivers in the south-eastern sector of the district. Varda originates in the Sagar taluk and flows past Banavasi in Uttara Kannada district before joining Tungabhadra in Haveri taluk. Dharma river issues forth as a small stream from a tank in Islur village of Sirsi taluk.
CLIMATE : Climate of Uttara Kannada is typically tropical. Southwest monsoon winds bring down rains during the months June September. Average annual rainfall is about 250 cm, followed by 7 months of more or less no rain. The month of July experiences the heaviest rains. Rainfall is very heavy in the coast, averaging more than 300 cm annually. The average rainfall in the Ghat section is about 500 cm, and in the far east it is about 200 cm (Figure 7). The driest months are between May March. The day temperature during these months reaches a maximum of 38o C. The winters are not very cold with the lowest temperature ever recorded being 11.9o C. Winter season sets in during December and lasts till the end of February. During this period the weather is dry, with clear bright sky, and an agreeably low temperature as well as humidity. The district now has 3 meteorological observatories, which are situated at Honnavar, Karwar and Shiralli.
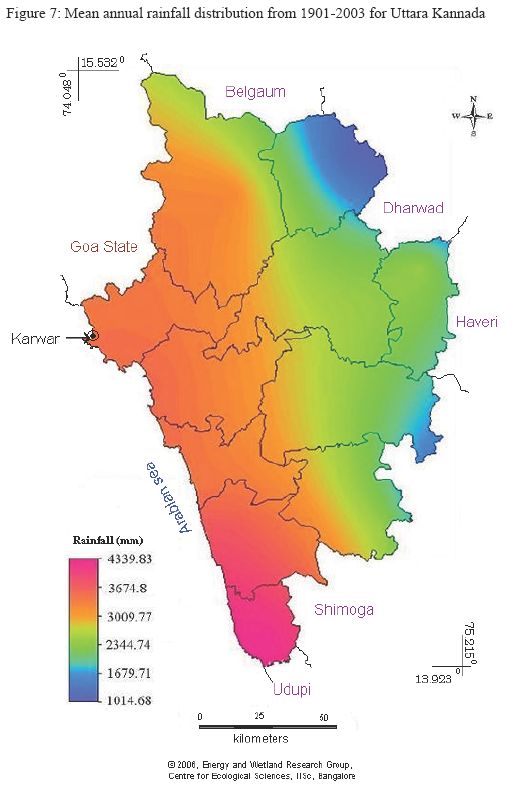
Uttara Kannada district does not suffer from any large scale variations in the amount of rainfall from year to year. Its location on the sea coast has however rendered it vulnerable to the disaster generally caused by the depressions and cyclonic storms that are formed in the Arabian Sea and the Indian Ocean.
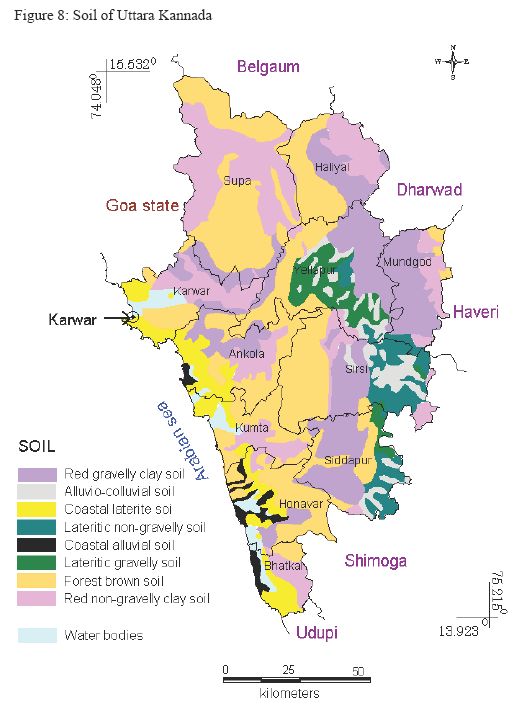
SOILS : The soil can be described as derivatives of the most ancient metamorphic rocks in India, which are rich in iron and manganese (Pascal, 1988). The soils of the district are basically divide into two distinct zones based on topography; the coastal alluvial soil and the upghat lateritic and granitic soils. Mixed lateritic soils are found in taluks of Supa, Haliyal and Mundgod, which contains certain patches of black soil as well. The lateritic soils are highly leached, reddish brown in colour, shallow to medium in depth and loamy in texture. These soils are found in the taluks of Karwar, Kumta, Honnavar, Bhatkal, Sirsi and Siddapur (Figure 8). Red loamy soils are also to some extent found in taluks of Supa, Mundgod and Haliyal. Red sandy loams are poor in water holding capacity, and are therefore well drained, and acidic. Such soils are found in taluks of Sirsi, Yellapur, Karwar and Ankola. In the coastal taluks there are numerous patches of land which contain saline soil of light yellow or brownish colour. These lands are not quite suitable for cultivation.
TOP |
VEGETATION : The Western Ghats of Uttara Kannada district are known for their dense forests which cover about 80% of the area of the district (Anon, 1982). The total forest of Uttara Kannada is about 8,29,151 ha., and the per capita forest is about 0.77 ha.
The forests of Uttara Kannada can be classified into 3 categories based on density (Akbar Sha, 1988) as Partially open forest ( 20 40% density), Medium density forest (40 80% density) and Closed forest (above 80% density). Based on this classification Uttara Kannada district has about 1388.89 km2 of partially open forest, 1646.16 km2 of medium density forest and 714.55 km2 of closed forest. Depending on phenological conditions and other ecological factors, the forests of Uttara Kannada are broadly divided into two types namely Moist and Dry types. The moist type may be sub divided into evergreen, semi evergreen and moist deciduous. The dry type can be divided into dry deciduous and thorny forest
The central part of Uttara Kannada is of the evergreen type as shown in Figure 9. They are composed of very tall trees, forming a very dense canopy and are many storied and impenetrable. The rainfall in this forest is as high as 4000-5000 mm. The semi evergreen forests are seen in pockets and often merges with the evergreen and the moist deciduous type. Therefore distinguishing them is rather difficult.
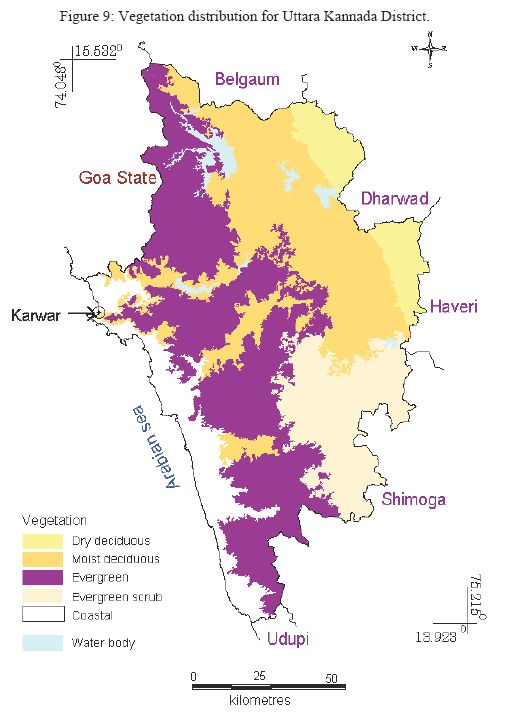
In the moist deciduous forest, tree species remain deciduous only for a short time. These forests have semi evergreen species in the upper canopy and evergreen in the lower storey. In these forests, some moist places have predominance of bamboo and on red soil Xylia is present. They have a rainfall of about 1000-2000 mm.
- Evergreen species : Dipterocarpus indicus, Diospyros candolleana, Artocarpus hirsutum, Vateria indica, Hoppea intergrifolia, Memecylon umbellatum, Mangifera indica, Actinodaphne agustifolia, Holigarna grahmie, Calamus rotang
- Semi evergreen species : Cinnamomum malabaricum, Holigarna arnottiana, Dalbergia latifolia, Ficus spp., Pterocarpus marsupium, Aglaia roxbhurgiana.
- Moist deciduous species : Terminalia paniculata, Terminalia tomentosa, Xylia xylocarpa Careya arborea, Spondias spp., Tectona grandis, Lagerstroemia parviflora, Dillenia pentagyna, Strychnos nuxvomica, Bambusa arundinaceae.
- Dry deciduous species : Acacia catechu, Sepium insigne, Anoegissus spp.,Bauhinia racemosa, Bombax ceiba.
- Plantations : Tectona grandis, Areca catechu, Cocos nucifera, Casuarina equisetifolia, Acacia auriculiformis, Acacia nilotica, Eucalyptus spp.
Ankola : From east to west the forest types changes from thorny to moist deciduous. There are pockets of semi-evergreen forests in the central part of Ankola. Towards the coastal side there is mainly coconut and arecanut plantations. Gangavalli river valley area supports valuable teak forests.
Bhatkal : The forest type in this taluk changes from thorny to evergreen. Moist deciduous forests are not very common. The evergreen forests around Kop village in the north-east part of the taluk contain valuable timber.
Haliyal : The eastern and north-western parts of Haliyal comprise teak pole area tending to scrub type at the border of Dharwad district. The forests towards the west yield high quality timber (teak and hardwoods). There is sandalwood in the drier parts of the area. There are patches of evergreen forests towards the western side in the lower portion of the river valleys.
Honnavar : The forest type in this taluk changes from semi-evergreen to evergreen. Moist deciduous forests are hardly found. The coastal strip is highly denuded and in some places the land has become unfit for even grass growth. The semi-evergreen and the evergreen forests in the northeastern corner comprises of palms. Southwest part of the taluk comprises of Areca catechu. The evergreen forest of Gersoppa comprises of canes.
Karwar : From west to east the forest type gradually changes from thorny to moist deciduous and from semi-evergreen to evergreen. The deciduous forests in the lower slopes consists of mainly high yielding timber of teak. The upper slopes, lower river valleys consists of patches of evergreen forests and large number of canes.
Kumta : The type of forest changes from thorny to moist deciduous and from semi-evergreen to evergreen as one advances from west to east. Timber bearing dense forests are seen in south-east part of the taluk. Bamboos are seen in Aganashini valley around Soppinahosahalli.
Mundgod : The forest type is basically scrub land. The eastern region comprises of teak pole area while the western region consists of dense forested area. Semi-evergreen patches are seen in the southwest and the perennial river belts. The drier part of the taluk, towards Dharwad district contain sandalwood. The forests also contain Bamboos.
Siddapur : The eastern part is drier, and as one moves towards the ghats, the forest changes to dense semi-evergreen type. There are many patches of evergreen forests called Kans in this taluk, which are mostly confined to the west, near Dodmane and Malemane ghats. North-east part comprises of sandal wood belt which extends to Sirsi and Mundgod.
Sirsi : The forests of Sirsi taluk are primarily semi-evergreen and evergreen types. The belt of sandalwood forest of Siddapur taluk runs over the taluk and is mostly confined to the southeastern part.
Supa : The forest area falls into two different types of forests. The south eastern part of the taluk consists of dense forest, while the Nagjhari valley and the Kalinadi slope consists of high yielding timber of valuable species. This region has the finest teak plantations. Evergreen patches are also found in the valleys. The northern part, near Castlerock consists of scrub jungle, where the soil is very poor. Bamboo grows abundantly in this taluk.
Yellapur : The northern part of Yellapur consists of teak forests. Bamboo is also plenty, which are confined to the catchment area of Bedthi. Central part of the taluk basically comprises the semi-evergreen type of forests.
Uttara Kannada vegetation is divided into 5 broad zones by Daniels et.al.(1989) namely, Coastal zone, Northern evergreen zone, Southern evergreen zone, Moist deciduous zone and Dry deciduous zone. Uttara Kannada has 21 habitat types according to Daniels (1989), based on a study in 181, 5x5 km grids. They are, Evergreen forests (65%), Rocky cliffs (14%), Degraded evergreen thickets (17%), Moist grasslands (9%), Moist/dry teak (29%), Humid betelnut (50%), Freshwater marshes (25%), Exotic tree plantations (25%), Rivers (10%), Hillstreams (55%), Coastline (9%), Beaches (6%), Coastal coconut (9%), Estuaries (5%), Scrub (2%), Dry deciduous forest (5%), Moist/Dry Bamboo facies (6%), Moist/Dry cultivation (31%), Moist/Dry Eucalyptus (10%), Moist Deciduous forests (18%), Urban population > 1000 (22%).
The major vegetation types of Uttara Kannada have been broadly grouped as
- Natural vegetation: which includes evergreen, moist deciduous and dry deciduous forests with their degraded stages.
- Plantations or Monocultures: The plantations of Areca catechu (Betelnut), Tectona grandis (Teak), Eucalyptus sp. (Blue gum) and other exotics were among the monocultures studied.
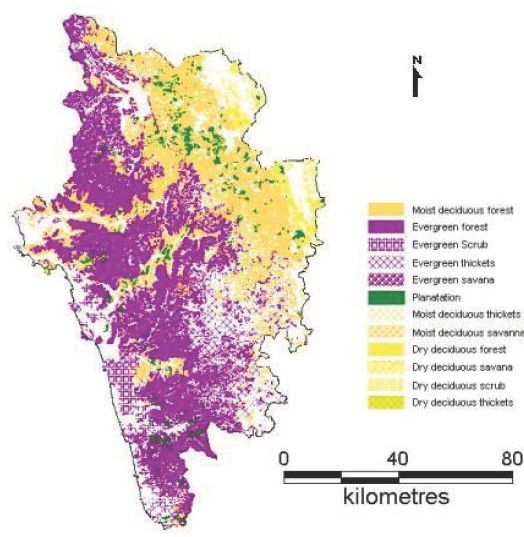
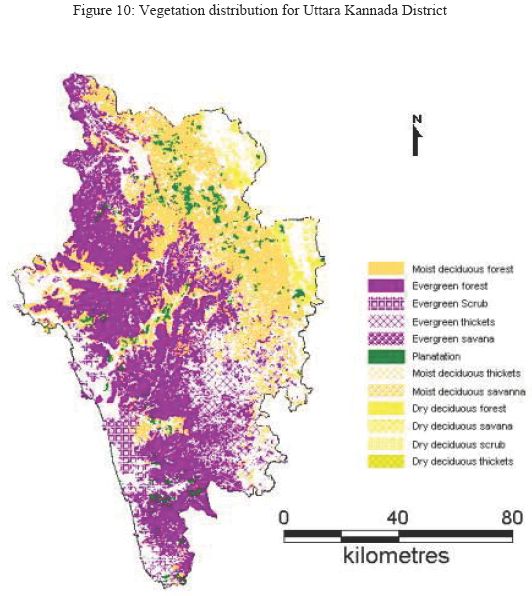
According to Pascals Forest Map of South India (Figure 10) the vegetation is classified as follows:.
Group I. Evergreen or semi-evergreen climax and potentially related forests
I. Evergreen or semi-evergreen climax and potentially related forests.
- Low elevation (0-850 m in the south and 0-650 m in the north).
Dipterocarpus indicus-Diospyros candolleana-Diospyros oocarpa type: Honnavarand Kumta (Scanty distribution only)
Persea macrantha-Diospyros spp-Holigarna type: Honnavar and Kumta.
Diospyros spp-Dysoxylum malabaricum-Persea macrantha kan forest type: Eastern Sirsi. - Medium elevation (650-1400 m)
Transition type: Joida
Memecylon umbellatum- Syzygium cumini- Actinodaphne angustifolia type.
- Evergreen and semi-evergreen forests Disturbed low elevation: all taluks except Haliyal and Mundgod Disturbed transition: Joida. Secondary low elevation: Bhatkal, Honnavar, Kumta, Sirsi and Siddapur.
- Secondary moist deciduous forests Dense forest: Joida, Yellapur, and Sirsi. Woodland to Savanna woodland: all except Haliyal and Mundgod.
- Other degraded stages Thicket low elevation: all except Haliyal and Mundgod. Thicket medium elevation: Joida. Tree savanna to grass savanna low elevation: all except Haliyal and Mundgod. Scattered shrubs low elevation: Bhatkal, Honnavar, Kumta, Ankola, and Karwar.
These forests and their degradations occur in the north-eastern parts of the district.
- Plantations
Acacia catechu, Casuarina equisetifolia, Eucalyptus spp., and Tectona grandis are planted widely in the district.
OBJECTIVES | TOP |
The main objective of this study is to assess the spatial and temporal vegetation changes and land-use pattern in the study area using GIS, GPS and remote sensing data. Also to classify the vegetation cover in the study area based on the forest types such as: Evergreen forest, Semi-evergreen forest, Moist deciduous forest, Dry deciduous forest and Thorny forest.
METHODOLOGY
The preliminary method adopted was to collect secondary data regarding the vegetation, forest cover, topography, species diversity, landuse in the past etc. of the study area, from governmental organisations such as forest department, forest research institutes, as well as non-governmental institutes such as French Institute, Pondicherry. Data was also obtained from reviewing certain literature works, which were of significant importance to this study. Apart from these, field investigations were undertaken in order to ascertain the spectral signatures in the remotely sensed data with ground condition type of patch, type of vegetation, etc.
After collecting the essential information required for this study, the digital analysis of these data was carried out. The methodology adopted for carrying out this analysis could be categorised into 4 steps as follows:
- Digitization
- Ground truth data
- Remote sensing data
- Digital Image Processing
- Data analyses, data integration
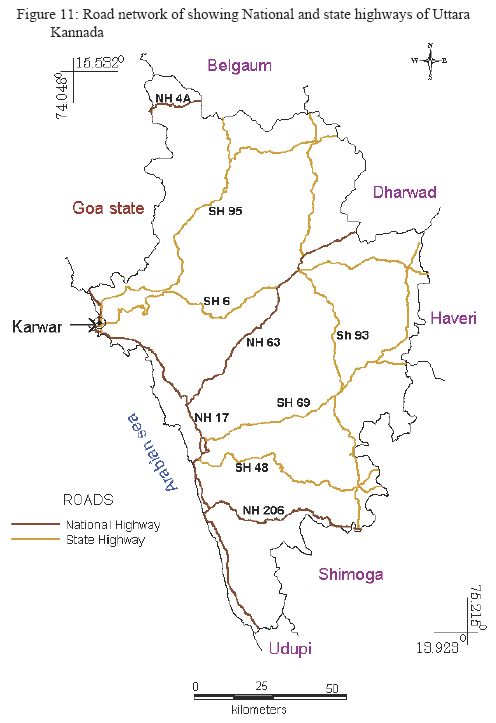
DIGITIZATION : Survey of India (SOI) topographical maps of scale 1:50,000 and 1:2,50,000, covering all taluks of Uttara Kannada district depicting taluk boundaries (Figure 2), road and rail network (Figure 11), and drainage pattern (Figure 3) were digitized. The district boundary was digitized using toposheets 48 J, 48 I, 48 M, and 48 N each of scale 1:2,50,000. The taluk boundaries, road and rail network, and the drainage network were digitized from toposheets of scale 1:50,000. The RMS errors for digitization were checked and found to be within the acceptable limits for the scales of maps used. The lat/long coordinate system was used for digitization. Vegetation map of South India (Figure 10) of scale 1:2,50,000 was digitized using Vegetation map developed by French Institute (1984). This helps in temporal analyses to find out the changes in vegetation during the last fifteen years.
These digitized images (major road network and drainage network) were used to georegister and also to implement geo correction of the satellite imageries. Vector layer of the district boundary and taluk boundaries were converted to raster images in order to crop the satellite imageries, along the boundary of the study area.The main advantage in having these baseline maps in digital form is that they allow us to apply computer analysis techniques to the image data - Digital Image Processing.
GROUND TRUTH DATA : Ground data were collected through field visits. The points were selected such that it could be easily identified and located on the satellite imagery and distributed uniformly all over the region. Based on this criterion, the control points, at crossroad junctions, bridges, forest area, agricultural lands, national highways, railway junction etc., were marked. These are referred as GCPs or Ground Control Points. The ground control points were marked using Global Positioning System (GPS) GARMIN ver 2.01, which marks the latitude and longitude of the points taken, in degrees. Also it gives the altitude of the point marked, in meters. The main aims of obtaining the ground control points, is to georegister the satellite imagery (in the image restoration process), and to use as interpretation keys for image classification.
The type of forest cover in the study area was also studied during the field visits. The type of vegetation, characteristic species of the forest type, and the forested areas were assessed. The data thus obtained was used to classify the satellite imagery based on the landcover, land use and also to sub-classify based on the forest type.
REMOTE SENSING DATA : Remote sensing data of IRS-1D; Path-97, Row-62, 63; LISS III sensor; 5th March 1999 satellite imageries corresponding to Uttara Kannada district were procured from National Remote Sensing Agency (NRSA), Hyderabad. While procuring these images it was ensured that, the data obtained is of latest time scale, and image scenes have cloud cover less than 5% . Summer season data was procured to carry out landcover classification (level 1 classification vegetation, soil, water, etc.)
DIGITAL IMAGE PROCESSING : The data, thus generated in digital form, is then analysed using IDRISI ver 2.0 (Image processing software, Eastman R.J., 1997), and MapInfo Professional (GIS software). Digital Image Processing consists of four basic operations:
- Image restoration
- Image enhancement
- Image classification
- Image transformation
Remotely sensed images are taken at a great distance from the earths surface. As a result, the electromagnetic energy must pass through a considerable distance of atmospheric path, before it reaches the sensor. Depending on the wavelength and the atmospheric conditions, the incoming energy will be substantially modified. As a result of this, the data obtained in turn is modified. Besides, at the time the image is being scanned, the satellite follows a path, which is subjected to minor variations at the same when the earth is rotating underneath. Consequently a number of systematic and apparently random disturbances can combine to degrade the quality of the image.
Image restoration is concerned with the correction and calibration of distorted images in order to achieve a satisfactory representation of the earths surface. Image restoration can be broadly classified into radiometric restoration and geometric restoration. Radiometric restoration refers to the removal of distortion in the degree of electromagnetic energy registered by the detectors.
Image enhancement deals with the modification of images to make them more suited to the capabilities of human vision. Digital sensors have a wide range of output values to accommodate the greatly varying reflectance values that can be found in different environments. However, in a single environment it is often seen that only a narrow range of values occurs over most areas. Thus the distribution tends to be skewed. Contrast stretching enables to correct these, by manipulation procedures. Digital filtering were done to provide edge enhancement or crispening, to remove image blur, and to isolate lineaments.
Composite generation : For visual analysis, colour composites make the image look much clearer. The colour composite helps in differentiating the earths features based on their spectral response patterns, which would also help in the identification and selection of heterogeneous sites for training data collection.
IMAGE CLASSIFCATION : Image classification is the process of assigning the pixels (picture elements) to different classes. Usually each pixel is treated as an individual unit composed of values in several spectral bands. By comparing the pixels with one another and with those of known identity it is possible to groups the similar pixels into classes that match the information category of interest. These classes form regions on the image and after classification these are presented as a mosaic or parcel, each identified by a colour or a symbol. Basic elements required for classification are;
- The presence of distinctive signatures for the land cover classes of interest in the band being used,
- The ability to distinguish these signatures from other spectral response patterns that may be present.
This process involves the identification of a set of sample locations that are visited in the field. The land cover found in the field is then compared to that which was mapped in the image for the same location. Statistical assessments of accuracy may then be derived for the entire study area as well as individual classes. There are two general approaches to image classification: Supervised & Unsupervised
SUPERVISED CLASSIFICATION : In case of supervised classification we detect already known specific types of land-use. Based on the spectral reflectance patterns or signatures of different features information classes are identified. These are called training sites. With theses a statistical characterisation of reflectance for each individual class were done, which is known as signature analysis and it may be as simple as the mean or range of reflectance on each band, or as complex as analyses of variance and covariance over all bands. After the signature analysis is done the image is classified by examining the reflectance of each pixel and making a decision about which of the signature it resembles most and assigning the appropriate pixels to their respective class. This decision making and assigning of pixels to their respective classes is done by classifiers. The three most commonly used classifiers are:
- Parallelepiped : It characterises each class by a range of values on each band. This range is defined by the minimum and maximum values of the training sites. It then classifies all the pixels, which fall within this range. If a pixel does not fall within this range then it is left unclassified.
- Minimum distance to mean : Based on the training site data, it characterises each class by its mean position on each band. Suppose 3 bands are used for analysis, the reflectance value of a pixel in all the three bands is taken, and the mean value is calculated. All the pixels which have the same value are assigned to their respective classes. The unassigned pixels are then assigned to that class to which it is nearer.
- Maximum likelihood : Using the information from a set of training sites, it uses the mean, variance and covariance data of the signatures to estimate a probability that a pixel belongs to each class.
Of the three hard supervised classifiers, Maximum likelihood is the best and computationally difficult.
UNSUPERVISED CLASSIFICATION : In contrast to the supervised classification, wherein the user defines the training sites, in an unsupervised classification the software itself classifies the image into many groups or clusters based on the prominent spectral reflectance values of each pixel. These groups or clusters will then have to be identified as a landcover by the analyst, with the help of the baseline maps or ground truth data.
IMAGE TRANSFORMATION : Image transformation refers to the derivation of new imagery as a result of some mathematical treatment of the raw image bands. There are two transformations that are of special significance to environmental applications.
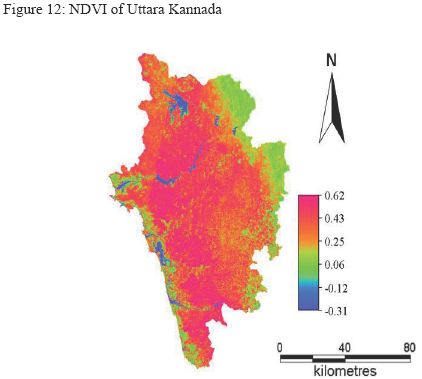
Vegetation Index : There are a number of vegetation indices that have been developed to help in monitoring vegetation. They are based on the interaction between vegetation and electromagnetic energy in the red (R) and infra red (IR) wavelengths. The reflectance in the red region (0.6-0.7 micro m) is low because of absorption by leaf pigments (chlorophyll). The infra red region (0.8-0.9 micro m), however, shows high reflectance because of scattering by the cell structure of the leaves. A very simple vegetation index can thus be achieved by dividing the measure of infrared reflectance by that of the red reflectance. Areas of strong vegetation will thus result in a very high index value. The most commonly used vegetation index is the Normalised Difference Vegetation Index (NDVI), which is calculated in the following manner:
NDVI = (NIR-R) / (NIR+R)
Where NIR = Near infra red, R = Red band
DIGITAL ANALYSIS OF THE IMAGE : The satellite image scenes of path 97 and row 62 and 63 where at first resampled or geocorrected with the help of the baseline maps created by means of digitization. The geometric correction of the images were carried out using the digitized road and rail network and the drainage vector layers. After resampling the two image scenes, they were merged with one another in order to obtain a complete image of the study area. Based on the latitude and longitude of the two images and the study area, they were resampled and then merged to generate a complete picture of the area under study. The number of columns and rows of the image were calculated during the process. The formula used to calculate the rows and columns are as follows:
Number of columns = Min X Max X / Resolution
Number of rows = Min Y Max Y / Resolution
After the two scenes were merged, it was cropped along the boundary of the study area. For this, the digitized boundary of the study area was converted from vector image to raster image. This image was then overlayed with the merged image and then resampled, in order to obtain the cropped image of the study area.
The image was then analysed for vegetation index, which highlights the areas of thick vegetation. Higher the index value, denser is the vegetation in that area. The NDVI was carried out by the image calculation :
Band 4 - Band 3 / Band 4 + Band 3
i.e.,
Near infrared - Red / Near infrared + Red
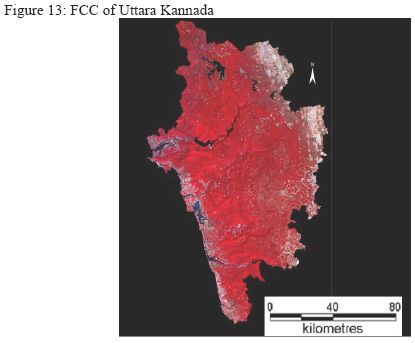
The False Colour Composite (FCC) of the images of band 2 (Green), 3 (Red) and 4 (IR)were created in order to differentiate the different features (enhancing the image contrast) on the image based on their reflectance in each band.
The training sites were identified in FCC and corresponding attribute information was collected using GPS in the study area.The ground truth data collected during field visits were applied to identify different landcover classes on the image. Based on the training site data the hard supervised classifiers classified the imagery into a number of classes. These classes were further grouped and reclassified to give the final landuse/landcover classification of the study area.
As the main objective of this study is to classify the forest cover of the study area, it is essential to sub classify the existing classified image. To carry out sub classification the forested area from the classified image alone was extracted and training sites were identified using the ground truth data and the digitized baseline images. The supervised classification was carried out using all the three types of classifiers namely, Maximum likelihood, Minimum distance to mean and Parallelepiped. The forest classes obtained were then identified as evergreen, semi-evergreen, moist deciduous, and dry deciduous.
Temporal change analysis was done considering the forest cover of Uttara Kannada in 1984. Digitised Forest Map of South India generated by J.P. Pascal of the French Institute, Pondicherry (1984), was compared with the classified image obtained, by overlaying the image on the digitized map. This gave the change in the forest cover and also the forest types over a period of about fifteen years.
RESULTS AND DISCUSSION | TOP |
According to Parallelepiped classifier, the percentage of each type of landcover area is less compared to that of Minimum Distance to Mean classifier and the Maximum likelihood classifier. For example, the percentage of forested area (evergreen type) depicted in case of Parallelepiped is 34, whereas, in case of Minimum Distance to Mean, it is 39.59%, and in case of Maximum Likelihood it is about 40.66%. Area under various Land-uses are listed in Table 3. The Maximum likelihood classifier is the best type of classifier with the overall accuracy (Table 4 and 5) of 88.5% compared to the other two types.
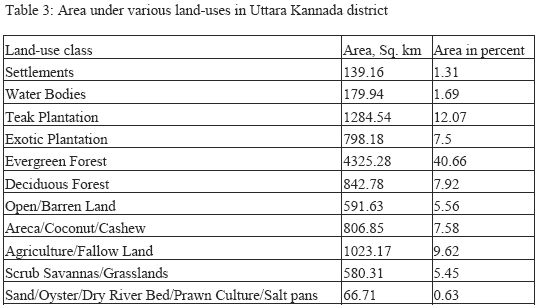
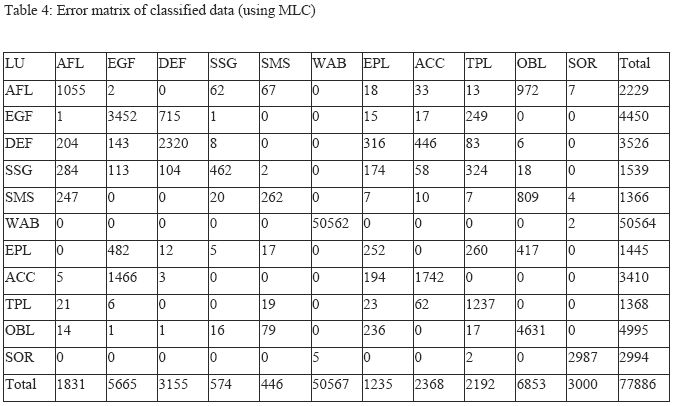
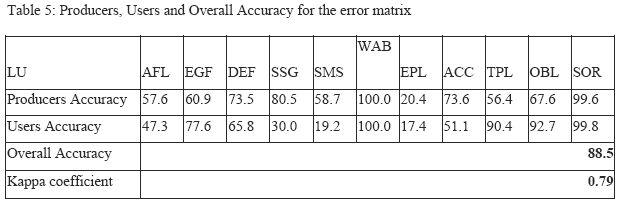
Agriculture/Fallow Land: AFL, Areca/Coconut/Cashew: ACC, Exotic Plantation: EPL Teak Plantation: TPL, Evergreen Forest: EGF, Deciduous Forest: DEF, Scrub Savanas/ Grasslands: SSG, Settlements: SMS, Open/Barren Land: OBL, Sand/Oyster/Dry River Bed/Prawn Culture/Salt pans: SOR, Water Bodies: WAB
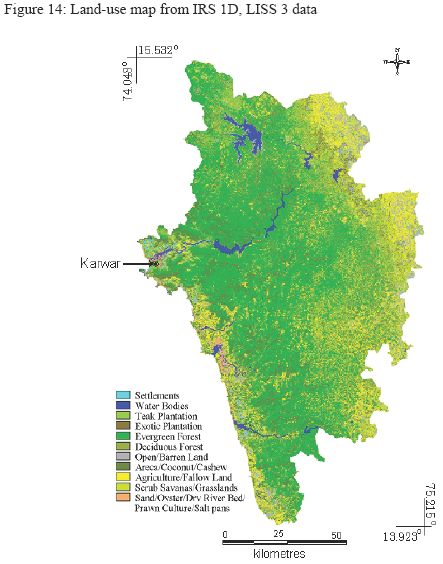
On comparing figure 10 and 13, it is very clear that the evergreen forests have undergone tremendous transformation. Most of the evergreen forested area have been transformed into semi-evergreen forests, and some have been converted into plantations such as, Teak, Arecanut, Acacia spp., etc. It is found that semi-evergreen and moist deciduous forest types predominate the forested area of Uttara Kannada. The complete stretch of the central ridge zone (ghat section), which was once dominated by the evergreen forests, is now dominated by the semi-evergreen forest. Evergreen is seen in patches mainly towards the south-west and in the ghat section. Moist deciduous is seen almost in all places distributed throughout the district. It is more common in the eastern Sirsi, south of Yellapur, eastern Siddapur and western region of the coastal taluks. Dry deciduous forests were spotted in the taluks of Mundgod, Haliyal, western Sirsi and north-eastern part of Yellapur. The scope of this study could broadly categorised as follows:
- Vegetation analysis : The forest type classification of Uttara Kannada could be further classified at the species level. The classification based on the species present in each forest type, enables us to identify the type of species and thus helps in the management of the biodiversity and its conservation.
- Conservation : The estimate of forest cover assessed in this study, helps in further analysis of the status of forest in each taluk of the district and thus enables foresters to develop good conservation strategies in order to conserve the forest.
- Drainage analysis : The drainage pattern of Uttara Kannada district, which have been made available in digital form, can be very useful for the studies on catchment yield. Besides, it is very essential in assessing the capacity of each catchment of a river. Hydraulic potential is the combination of the catchment yield and the distribution of gradients. With detailed investigation of the drainage network and slope analysis, potential sites can be identified for setting up hydel power plants.
- Ecological modelling : The landuse/landcover classification and the forest type classification which also provides the area under each class, could be an essential tool for ecological modelling.
ACKNOWLEDGEMENT
We are grateful to the Ministry of Environment and Forests, Government of India and Indian Institute of Science for the financial support. We thank Mr.Rosario M. Furtado and Mr. P.R. Bhat for their co-operation during field data collection.BIBLIOGRAPHY | TOP |
- Akbar Sha A., (1988), Integrated development of forests in Western Ghats, Karnataka Forest Department.
- Campbell J.,(1996), Introduction to Remote Sensing, Taylor and Francis publication, second edition.
- Clark labs, (1999) IDRISI for Windows, URL http://www.clarklabs.org/03prod/idrisi.htm
- Daniels R.J.R., (1989), A Conservation Strategy for the Birds of Uttara Kannada district, Ph.D thesis, Centre for Ecological Sciences, Indian Institute of Science, Bangalore, pg.: 27-47.
- Eastman R.J., (1997), Idrisi for Windows-users guide, Clark University, USA.
- Menon S. and Bawa K.S., (1997), Applications of Geographic Information systems, Remote Sensing, and Landscape ecology approach to biodiversity conservation in the Western Ghats, Current Science, July 25 1997, Vol. 73, pg.: 134-146.
- Murali K.S., Setty R.S, Ganeshaiah K.N., and Uma Shaanker R., (1998), Does forest type classification reflect spatial dynamics of vegetation? An analysis using GIS techniques, Current Science, August 10 1998, Vol. 75, pg.: 220-227.
- Murthy K.S.R. and Rao V.V., (1997), Temporal studies of Landuse/Landcover in Varaha river basin, Andhra Pradesh, India, Journal of the Indian society of Remote Sensing, September 1997, Vol.25, pg.: 145-155.
- Palaniyandi M and Nagarathinam V, (1997), Landuse/Landcover mapping and change detection using space borne data, Journal of Indian Society of Remote Sensing, March 1997, Vol. 25, pg.: 27-35.
- Pascal J.P (1988), Wet Evergreen Forests of Western Ghats of India- Ecology, Structure, floristic composition and Succession, French Institute, Pondicherry.
- Pascal J.P. (1986), Explanatory booklet on the forest map of South India, French Institute, Pondicherry, Chapter-3, pg.: 19-30.
- Prasad S.N., (1998), Conservation planning for the Western Ghats of Kerala: Assessment of habitat loss and degradation, Current Science, August 10, 1998, Vol. 75, pg.: 228-235.
- Prasad S.N., Vijayan L., Balachandran S., Ramachandran V.S., and Verghese C.P.A., (1998), Conservation planning for the Western Ghats of Kerala: A GIS approach for location of biodiversity hot spots, Current Science, August 10 1998, Vol. 75, pg.: 211-219.
- Samant H.P. and Subramanyan V., (1998), Landuse/Landcover change in Mumbai- Navi Mumbai cities and its effects on the drainage basins and channels- a study using GIS., Journal of Indian Society of Remote Sensing, June 1998, Vol. 26, pg.: 1-7.
- Smiet A.C., (1996), Landscape and Forest ecology of the Konto river upper watershed, Java, ITC journal, 1996-3/4, pg.: 215-224.
- Subash Chandran M.D., (1993), Vegetation Changes in the Evergreen belt of Uttara Kannada district of Karanataka State, Ph.D thesis, Karnataka University, Dharwad, pg.: 104-209.
- Udaya Lakshmi V., Murthy M.S.R. and Dutt C.B.S.,(1998), Efficient forest resources management through GIS and remote sensing, Current Science, August 10, 1998, Vol. 75, pg.: 272-281.
- Xing W.Z., Epema G.F., and Clevers G.P.W, (1998), Change detection in citrus by means of Lansat Thematic Mapper data, ITC journal, 1998-3/4, pg.: 225-233.