Assessment of (Sludge and Silt) deposits in the Lake
|
Devarabisanahalli lake, located in the southern direction of Bellandur Lake, Bangalore. Outflow of Devarabisanahalli lake joins the outflow of Bellandur Lake, about 400m downstream near Kariyammana Agrahara Road (Outer Ring road). Lake has an area of 5.45 hectares (Revenue Map) with a water spread of 4.4 hectares (Google earth-https://earth.google.com/). Digital elevation data from the Shuttle Radar Topographic Mission data of 30m resolution (earthexplorer.usgs.gov) along with the Survey of India Topographic maps of 1:50000 scale were used to map (i) the catchment / watershed region of the lake, which is about 118.9 hectares (Figure 1), (ii) digitize contours and (iii) map stream network.
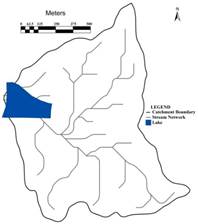
Figure 1: Catchment area of Devarabisanahalli Lake
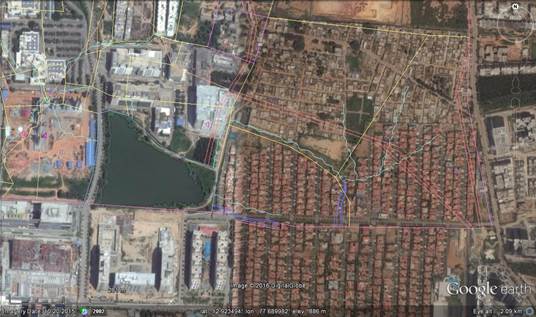
Figure 2: Cadastral Map (Source: http://landrecords.karnataka.gov.in/revenuemaps/)
Cadastral/Revenue map of Devarabisanahalli village from the Land records were overlaid on Google earth (Figure 2). Area with respect to the various data sources (RTC, Revenue Maps, Google Earth) area as specified in table 1, Figure 2 and Figure 4.
Table 1: Area under the lake
Slno |
Dataset |
Area in Ha |
Area in acre |
Figure No |
1 |
RTC Tippan
Source: www.bhoomi.karnataka.gov.in/ |
5.57 |
13.775 acre
13 Ac 31 Gunta |
3 |
2 |
Cadastral Map |
5.97 |
14.76 acre |
2 |
3 |
Current spatial extent 2015 |
5.45 |
13.45 acre |
5 |
|
Encroachment |
|
1.31 acre |
|
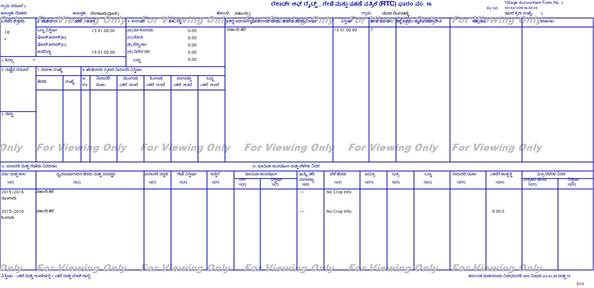
Figure 3: RTC Tippan, Taluk-Bangalore East, Hobli -Varturu 2, Village -Devarabisanahalli, Survey no: 18

Figure 5: Current Status of Lake based on Google earth 2015 dataset
Depth Profile: The Survey of India topographic maps (57H9) were used in order to digitize contours and estimate the depth. Depth is computed based on the bathymetry using this map (1:50000 scale and 20 m contour interval) and the current depth is estimated based on field investigations.
The current depth was estimated through field investigations using Global Positioning System (GPS) and depth sounder. The difference between the current depth and earlier depth (based on contours) indicate the extent of sedimentation due to silt transport from the catchment due to land use changes.
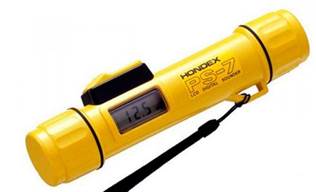
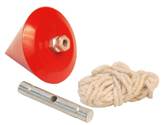
Bathymetric analysis for the lake was carried out on February 8th 2016 in order to understand the current status of lake. Various techniques adopted to measure the depth i.e., both classical survey technique (using scale, plumb bob, tape, etc.) and advanced technique of depth measuring using depth sounder and pre-calibrated Global Positioning System (GPS: provides the location and elevation). Figure 6 depicts these instruments and Figure 7 shows the field sampling locations of depth measurements in the lake.
 |
|
GPS |
Depth Sounder |

|
|
|
Tape |
Scale (1 m) |
Plumb bob |
Figure 6: Instruments used

Figure 7: Locations of depth measurement
Based on the field data, depth profile (bathymetry) was developed through surface interpolation techniques and the current depth profile / bathymetric details is depicted in Figure 8. The current depth varies from near 0 meters (near the upstream) to about 1.6 meters depth near the outlet. Current storage capacity of the lake is about 48,863 cubic meters.
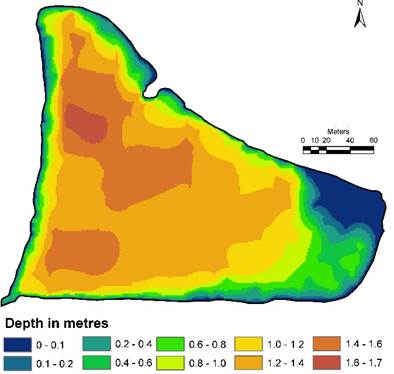
Figure 8: Current depth profile of Devarabisanahalli Lake
Figure 9 gives the depth of lake across various section and this helped in generating bathymetric map (Figure 10) through interpolation using contours based on the Survey of Topographic map of 1970’s and scale 1:50000 and contour interval of 20 m. This illustrates that maximum depth of lake was over 2.5 meters (about 10’) near the outlet. Estimated full storage capacity of the lake is about 72,588 cubic meters.

Figure 9: Cross section at various places
(Red dots indicating contour points (880m) and lake boundary (878m) along the cross section)
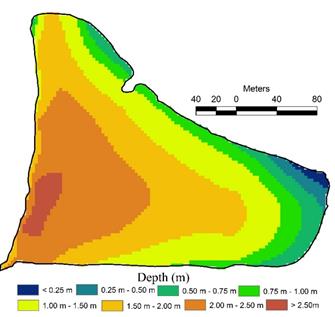
Figure 10: Bathymetric map derived using Topographic sheet
Sediments deposited in the lake: Sedimentation in a dynamic system (such as interconnected lakes) happens due to silt transport from the catchment. Due to drastic land use changes with unplanned urbanisation, large quantity of silt / sediment are deposited in the lake. Difference in bathymetric profile of 1970 and 2016 gives the picture of silt deposited in the lake during 1970 to 2016. Figure 11 illustrates the sediment profile / deposited in the lake, which amounts to about 23725 cubic meters (with depths of deposition varying between 0.25 to 2 meters, and an average, depth of deposit considered is about 0.57 meters).
Figure 11: Deposition of Solids
Economic value of the sediment in the lake: Table 2 lists the value of the silt/sediment in the lake considering estimated quantity and the current market price as discussed next:
- Sediment deposited is the difference between the two bathymetric maps (1970’s Topographic and current depth based on field sampling).
- a truck carries about 4.5 to 14.5 cubic meters of sand, and an average of 10 (350 – 400 cft) cubic meter (http://www.ashokleyland.com/product/trucks, and interviews with contractors) was considered.
- Cost of filter sand is about 25,000 rupees per load (of 350 - 400 cubic feet) and cost of river sand is about 55,000 rupees (per load of 350 - 400 cubic feet) (Current, http://houseconstructiontips.com/construction-materiel-prices/, and interviews with to contractor’s).
- Total number of truck loads is computed considering the volume of sediment and capacity of a truck.
- Value of sediment (silt/sand) =

Table 2: value of the sediment
Sl.no |
Description |
Units |
1 |
Deposition of sediment in cubic metres (estimated) |
23725 |
2 |
Capacity of a Truck in cubic metres (375 cft per truck) |
10 |
3 |
Total number of truck loads |
2372 |
4 |
Value of sand per truck load [Rs. 25000 (filter sand) to 55000 (river sand) |
Rs. 25,000/- |
5 |
Total value of the sediment (depending on the treatment and further use) |
Rs. 5.93 to
13 crores |
|