 |
Linkages between catchment landscape dynamics and the natural flow regime |
 |
1Energy & Wetlands Research Group, Centre for Ecological Sciences, IISC, Bangalore, 2 Centre for Sustainable Technologies, IISc, Bangalore 3Centre for infrastructure, Sustainable Transportation and Urban Planning, IISc, Bangalore
4Dept of Civil Engineering, Visvesvaraya Technological University, Belgaum
Web URL: http://ces.iisc.ac.in/energy; http://ces.iisc.ac.in/foss
*Corresponding author: cestvr@ces.iisc.ac.in
|
RESULTS AND DISCUSSIONS
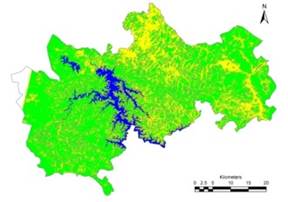
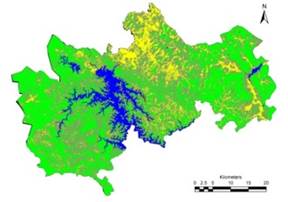
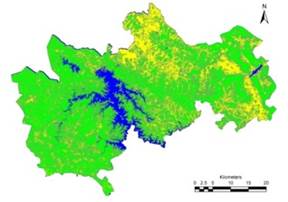
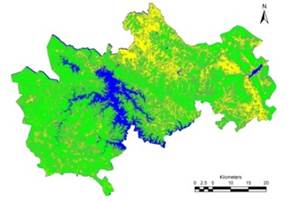
Land use analysis was carried out using Landsat series and IRS series of satellite data to understand the landscape dynamics of Sagara taluk and the results area as presented in Figure 6 and Table 1. Land use analysis between 1973 and 2012 indicate that forest cover has reduced from 57.3% in 1973 to about 45.5% in 2012.
Figure 6. Land use dynamics
Table 1. Land use dynamics of Sagara (all units in %)
Year |
Built up |
Forest |
Water |
Others |
Plantations |
1973 |
0.08 |
57.29 |
4.90 |
26.98 |
10.76 |
1990 |
0.11 |
44.17 |
7.71 |
12.13 |
35.87 |
2001 |
0.13 |
46.03 |
6.35 |
10.73 |
36.77 |
2012 |
0.18 |
42.57 |
6.81 |
13.29 |
37.20 |
Ground water dynamics were assessed in the wells located in catchments and in the vicinity of Baruru, Lavigere, Pandavarakoldu, Hosagunda, Yelakundali lakes respectively and is depicted in Figure 7. The results indicate the availability of water in wells is correlated with its proximity to forests and lakes, evident from lower deviations. Wells farther away from lakes and also forested catchments, had poor ground water table, indicating the lower quantum of water in the well with large variations across seasons.
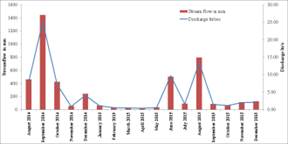
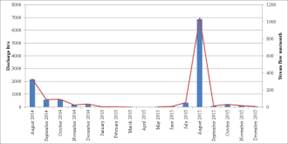
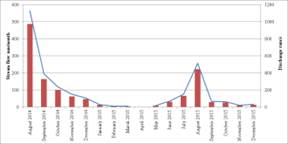
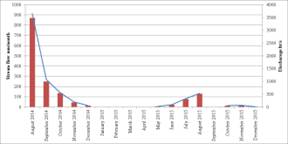
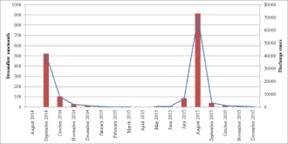
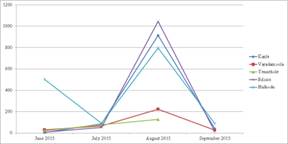
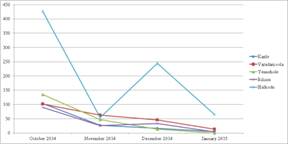
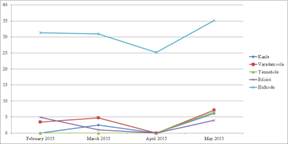
Discharges were measured using area velocity method at Varadamoola, Bilisiri, Hulkodu, YenneHole and Varada are presented in Figure 8. Discharges were normalized and compared across seasons w.r.t catchments. Results indicate streams at Hulkodu (i.e., sacred grove with pristine evergreen forest cover) were perennial with higher water yield during post and pre monsoon periods compared to other (with degraded landscape and mixed land use types). Intermittent stream flows of 7 to 11 months at Varadamoola, Bilisiri, Yennehole and Varada confirm the silent role played by native vegetation in sustaining water in streams. Average seasonal flow for each of the gauged streams were quantified and compared as depicted in Figure 9 and Table 2, Comparative assessment of the 5 gauging stations showed that Hulkodu had richer water resource throughout with nearly 5 times higher availability in the post monsoons and 10 times higher availability in the pre monsoon (Table 2).

|

|

|
a. Baruru |

|

|
b. Lavigere |

|

|
c.Pandavarakodlu |

|

|

|
e. Hosagunda |

|
f. Yelakundali |
Figure 7. Ground Water Dynamics
 |
|
a. Hulkodu |
b. Bilisiri |
|
|
c. Varadamoola |
d. Yenneholé |
|
e. Varada river (at Kanle) |
Figure 8. Stream flow Dynamics
|
|
a. Monsoon |
b. Post Monsoon |
|
c. Pre Monsoon |
Figure 9. Comparative assessment of stream flows
Table 2. Comparative assessment (all units in mm)
Season /Watershed |
Monsoon |
Post Monsoon |
Pre Monsoon |
Kanle |
261.00 |
25.68 |
2.15 |
Varadamoola |
165.97 |
38.82 |
3.80 |
Yennehole |
269.44 |
32.17 |
1.66 |
Bilisiri |
256.03 |
29.67 |
2.46 |
Hulkodu |
563.90 |
157.04 |
30.62 |
|
|
Citation : Vinay S, Bharath HA,Subash Chandran M D, Shashishankar A, Ramachandra TV, (2016). Linkages between catchment landscape dynamics and the natural flow regime. International Journal of Earth Sciences and Engineering, ISSN 0974-5904, Volume 09, No. 03, June 2016, P.P.244-251.
|


