RESULTS AND DISCUSSION
Land-use analysis:
Figure 4 depicts the unrealistic urban growth during the last two decades. Overall accuracy of the classification was 72 percent (1973), 77 percent (2010 to 2016) and land use is as shown in
Table 2.
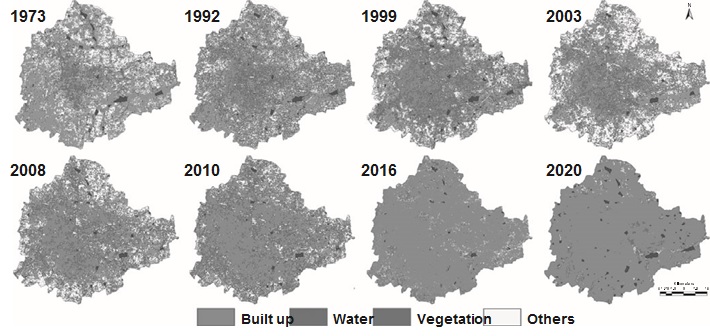
Figure 4: Urban dynamics in Bangalore and visualization of growth by 2020
Class |
1973
| 1992
| 1999
| 2002
| 2008
| 2010
| 2016
| 2020 |
Built-up |
7.97% |
27.30% |
35.37% |
37.74% |
49.54% |
54.42% |
76.91% |
93.26% |
Vegetation |
68.27% |
46.22% |
45.77% |
38.72% |
28.19% |
23.41 |
7.53% |
2.96% |
Water |
3.40% |
2.62% |
2.26% |
1.85% |
0.86% |
0.90% |
0.98% |
2.09% |
Other |
20.35% |
23.86% |
16.61% |
21.70% |
21.41% |
21.27% |
14.59% |
1.69% |
Table 2: Land-use statistics of urban pattern in Bangalore
Geo-visualization of urban growth:
The transition suitability (of MCE) along with transition probabilities (from Markov) were used to calibrate the parameters and simulate the sprawl for the year 2016 based on cellular automata using CA–Markov transitions. Validation of the simulated output was carried out with respect to the classified data for 2016. The simulated model for 2016 closely agrees with that of the classified land use with kappa of 0.86. The calibrated parameters were further used to derive the land use for 2020. This prediction has been done assuming water bodies to remain constant over all time frames, due to recent stringent norms. The simulation shows a predominant growth along the east and south directions showing the effect of upcoming industrial hubs in these directions. The process of urbanization in the simulated results is evident along the arterial roads and at the core of the city; the built-up density increases in lateral directions to a very large extent almost to the verge of being saturated, followed by gradual sprawl along the boundary of the city. Geo-visualization of likely land uses in 2020 through multi-criteria decision-making techniques (fuzzy AHP) reveals a calamitous picture of 93 percent of the Bangalore landscape filled with paved surfaces (urban cover) and drastic reduction in open spaces and green cover (Table 2 and Figure 4).
Wetlands of Bangalore:
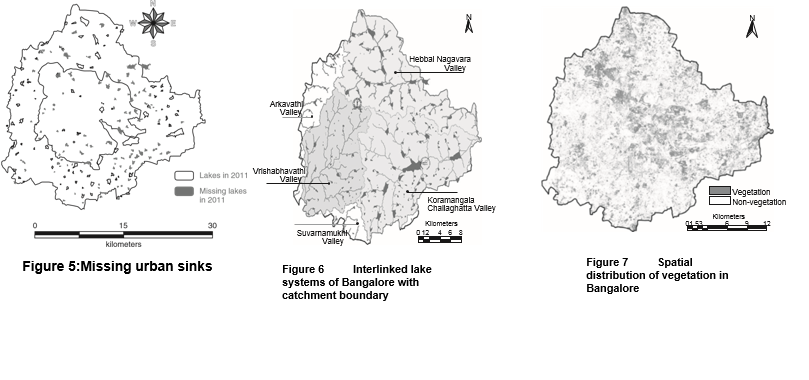
The latest field survey (2015–2016) of lakes reveals that 98 percent of lakes have been encroached on by illegal buildings (high rise apartments, commercial buildings, slums, etc.); 90 percent of lakes are sewage fed; 38 percent are surrounded by slums; and 82 percent showed loss of catchment area. Also, lake catchments were used as dumping grounds for municipal solid waste or building debris. The surroundings of these lakes have illegally constructed buildings and slum-dwellers occupy most of the adjoining areas. At many sites, water is used for washing and household activities, and fishing was even observed at one of these sites. Multistoried buildings have come up on some lake beds, affecting the natural catchment flow and thus leading to a deteriorating quality of water bodies. Unauthorized construction in valley zones, lake beds, and storm water drains (rajakaluves) highlight the apathy of decision-makers while revealing weak and fragmented governance. This is correlated with the increase in concreted areas which severely affect open spaces
and, in particular, water bodies. Figure 5 and Table 3 show that Greater Bangalore had 207 water bodies in 1973, which had declined to 93 in 2010. The Bangalore landscape forms an important catchment for the lake system and the present status of drains is reflected in Figure 6. These interconnected lake systems with their drainage networks help in transporting storm water beyond the city limits. Bangalore, being a part of peninsular India, had the tradition of harvesting water through surface water bodies to meet domestic water requirements in a decentralized way. These lake systems also helped in recharging groundwater resources. The groundwater table has declined to 300 m from 28 m (with the removal of water bodies) and 400 to 500 m in intensely urbanized areas such as Whitefield over a period of 20 years with the decline in wetlands and green spaces. Bangalore depends on the groundwater resources to an extent of 40 percent. The disappearance of local water sources and consequent decline in the groundwater table have led to a severe water scarcity in the region.
Vegetation status:
The vegetation cover in the city depicted in Figure 7 was derived from the fused remote sensing data (MSS IRS data of 5.8 m and Cartosat data of 2.7 m) using the MLC classifier. This highlights that the vegetation cover is about 100.02 hectares (14.08 percent). Accuracy assessment of classified data shows an overall accuracy was 91.5 percent, the kappa of 0.86 indicating higher agreement of classified data with field reference data:
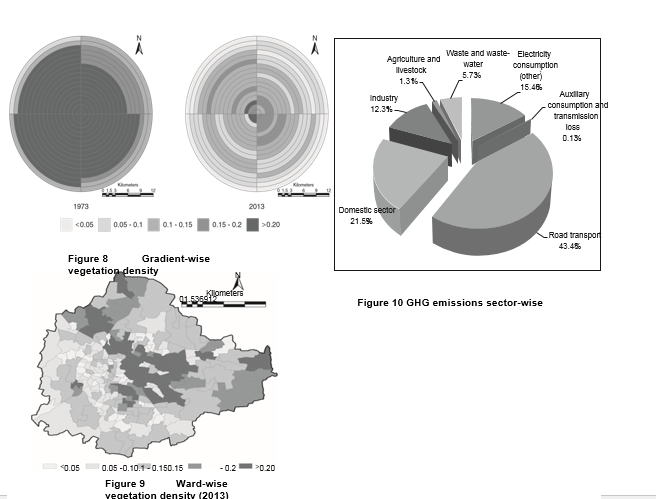
Spatialpatternsofvegetationcover:Bangalore was divided into 1 km radius circles (with respect to the central business district) to assess the vegetation gradient. Figure 8 depicts vegetation density in each concentric region in 1973 and 2013. Bangalore has an average vegetation density of 0.14 (i.e., area of Bruhat Bangalore: 741 km2, area under vegetation: 100.20 km2 and vegetation density: 0.14). Vegetation extent in each ward was computed by overlaying the ward boundary, as shown in Figure 9. Wards such as Hudi, Aramane nagara, and Vasantha pura have higher vegetation density of more than 0.4, while Chickpete, Laggere, Hegganahalli, Hongasandra, and Padarayanapura have lower density with less than 0.015.
Greenhouse gas emissions:
The GHG footprint (aggregation of carbon dioxide equivalent emissions of GHGs) was 19796.5 Gg (19.796 million tonnes) and the major contributing sectors are the transportation (43.48 percent), domestic (21.6 percent), and industrial sectors (12.31 percent). Figure 10 shows the contributions of various sectors to the city’s GHG footprint. Emissions from transport are due to the large-scale use of private vehicles, and mobility related to jobs accounts for 60 percent of total emissions due to the lack of an appropriate public transport system and haphazard growth with unplanned urbanization. There is a lack of integrated land use and mobility planning, and therefore the majority of people commute long distances,thus contributing to emissions. Higher fuel consumption, enhanced pollution levels due to the increase of private vehicles, and traffic bottlenecks have contributed significantly to carbon emission. The consumption of electricity has drastically increased in certain corporation wards with the adoption of inappropriate building architecture for the tropical climate region. This is evident from higher per capita electricity consumption in the zones dominated by high rise buildings with glass facades, which require 14,000–17,000 units (kWh) per year compared to the zones with eco-friendly buildings (1300–1500 units/person/year). In addition, mismanagement of solid and liquid wastes has aggravated the situation. Dumping of untreated solid and liquid waste into the water bodies has increased the anaerobic condition, leading to emission of greenhouse gases (methane, CO2, etc.).
Land surface temperature and urban heat island:
Temporal analysis of LST shows a gradual increase from 19.03 ± 1.47 ∘C (in 1991),
26.57 ± 1.25 (2000), 31.24 ± 2.21 (2007), to 37.14 ± 2.68 ∘C (2016) with the increase in paved surfaces in the city. Relatively lower temperatures in the regions with vegetation cover (25.79 ± 0.44), 24.20 ± 0.27 (water bodies) highlights the role of natural resources in moderating the local climate. Urban heat islands are formed with the increase of surface and atmospheric temperatures due to anthropogenic heat discharge due to energy consumption, increased land surface coverage by artificial materials having high heat capacities and conductivities, radiation by buildings due to inappropriate architecture, and the drastic decline in vegetation and water pervious surfaces (which aid in reducing the surface temperature through evapotranspiration, etc.). The implication for local climate is evident, with an increase of ∼2.5 to 3 ∘Ctemperature during the last two decades) with the decline of natural resources (decline in vegetation cover and disappearance of water bodies) that aided in moderating the local climate.
year |
Bangalore city(BMP, before 2004)
| Greater Bangalore |
1973 |
58 |
207 |
2010 |
10 |
93 |
Table 3 Status of water body of Bangalore
Citation : T. V. Ramachandra, Bharath H. Aithal, 2019.Bangalore.The Wiley Blackwell Encyclopedia of Urban and Regional Studies. Edited by Anthony Orum.© 2019 John Wiley & Sons Ltd. Published 2019 by John Wiley & Sons Ltd. DOI: 10.1002/9781118568446.eurs0014
|