 |
Adsorption of Fast Green on to Coffee Husk |  |
| Abstract | | | Introduction | | | Review of Related Literature | | | Research Methodology | | | Findings and Discussion | | | Conclusion | | | References | | | | | HOME |
N. Ahalya1, M.N. Chandraprabha1, R.D. Kanamadi2, T.V. Ramachandra3,*
|
||
Findings and Discussion: Characterisation of coffee husk: The carbon, hydrogen and nitrogen content of the husk showed very low percentage of nitrogen (0.63) in comparison to the carbon quantities (45.33%). This indicates that few nitrogen containing compounds are involved in the adsorption of dyes. A relatively larger percentage of hydrogen (6.21%) in comparison to nitrogen compounds indicates that carbon-hydrogen groups might be available for adsorption of metals and dyes. The relatively low percentage of nitrogen shows that very less percentage of protein might be present in the husks. This is advantageous over protein rich adsorbents since proteinious materials are likely to putrefy under moist conditions FT-IR spectra of the coffee husk in the range of 400-4000 cm-1 were taken in order to obtain information on the nature of functional groups on the husk and dye interaction. It exhibits absorption bands at 3412, 2921 - 2851, 1733 and 1652-1512 cm-1, which indicate the presence of –OH, -CH, C=H and C=O groups respectively.
Effect of initial pH: Initial pH is one of the most important environmental factors influencing not only site dissociation, but also the solution chemistry of the dyes: hydrolysis, complexation by organic and/or inorganic ligands, redox reactions, precipitation are strongly influenced by pH and, on the other side, strongly influence the speciation and the adsorption availability of the dyes. The effect of initial pH on the biosorption of fast green is presented in Figure. 1. Fast green, an anionic dye showed maximum adsorption in the pH of 2. The percent removal of fast green decreased with increase in initial pH. In highly acidic media the adsorbent surfaces are highly protonated (positively charged) and favour the uptake of negatively charged dye – fast green. With increase in the initial pH of the dye, the degree of protonation of the adsorbent surface decreases gradually. Namasivayam and Yamuna, 1992 have reported the percent adsorption of congo red (anionic, direct dye) decreased with increase in pH. The anionic dyes namely amaranth, fast green and sinsset yellow was maximally adsorbed by peanut hull at pH 2.0 (Gong et al, 2005).
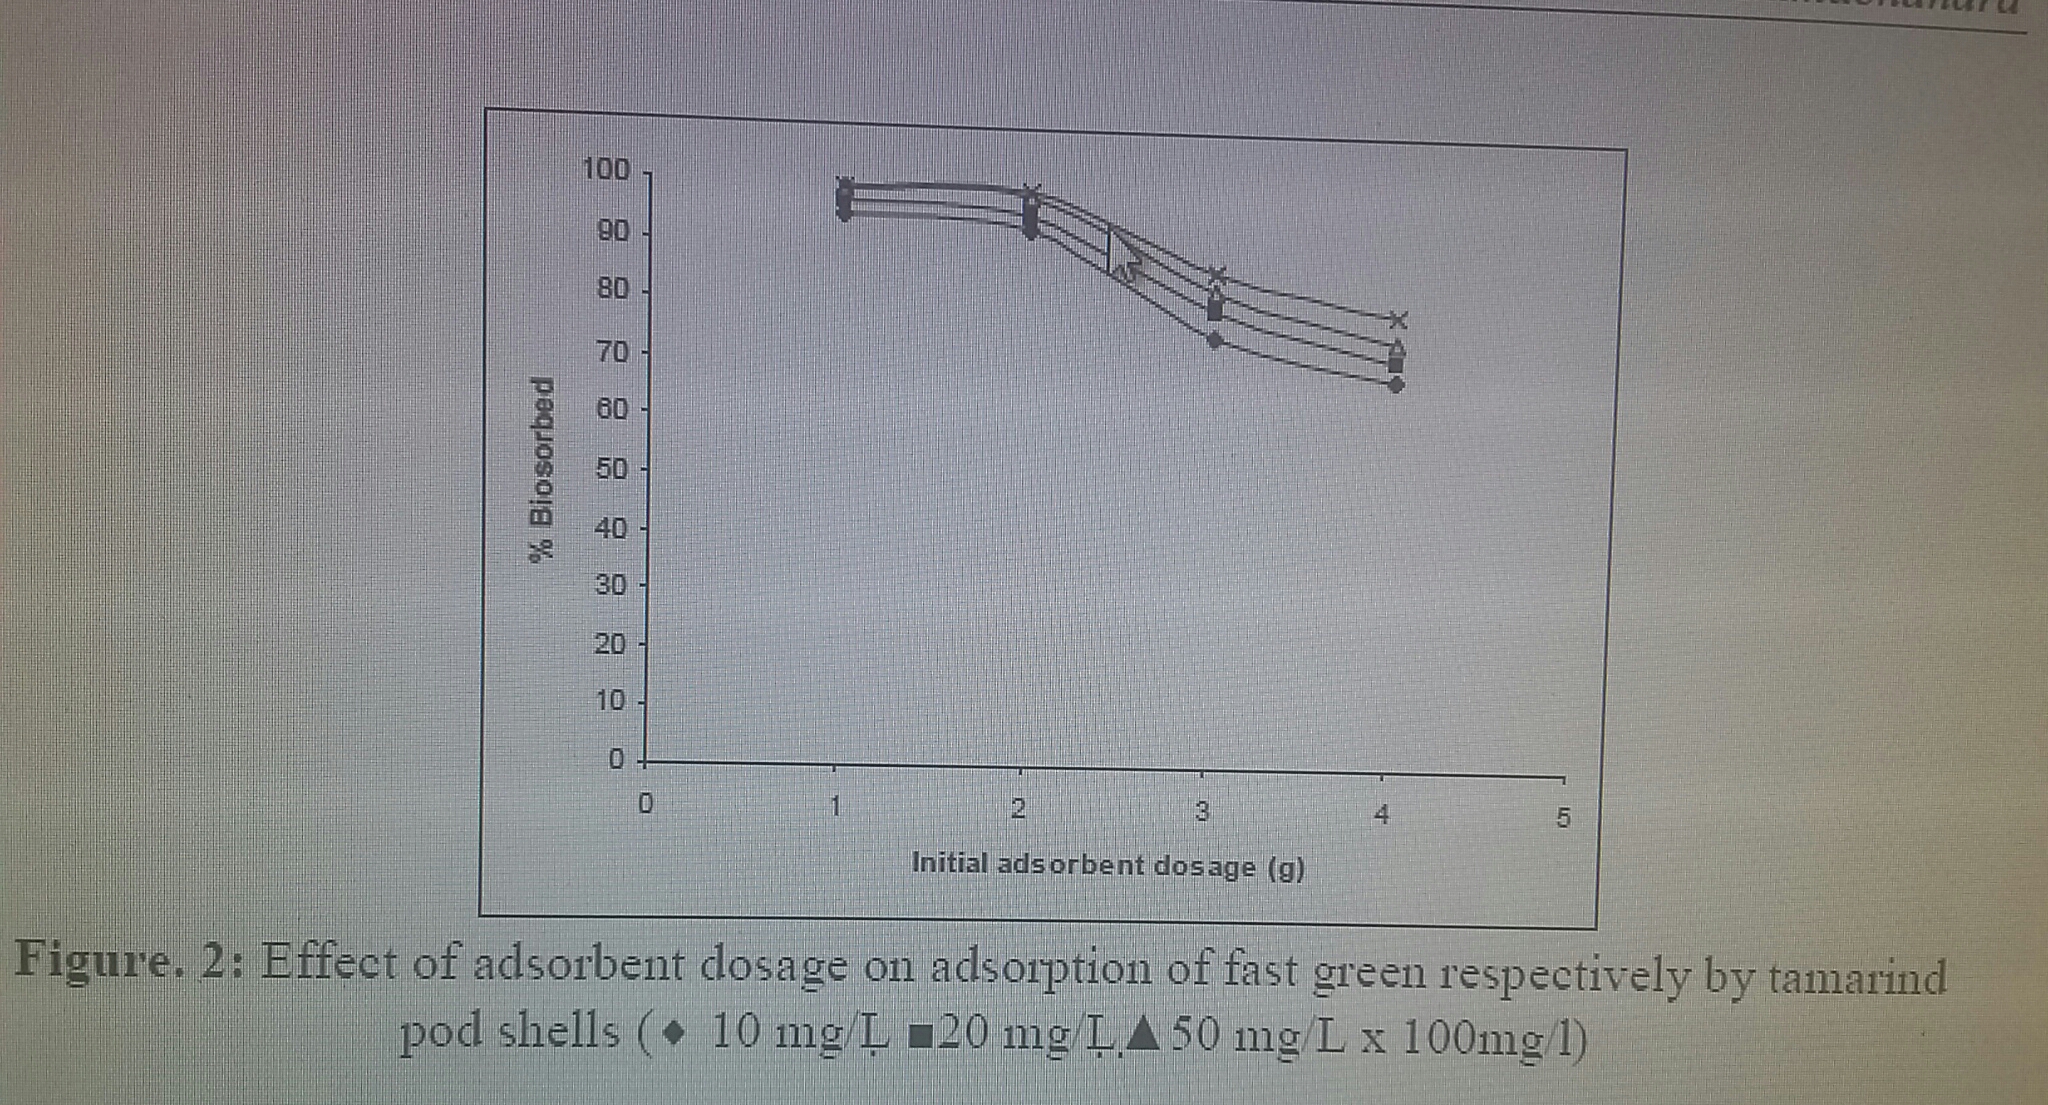
The biosorption of fast green by coffee husk was studied at various biosorbent concentrations ranging from 0.5 to 5 mg/L. The percentage removal of the dye increased with increase in the sorbent dosage (Figure. 2). The results revealed that the colour removal increased with increase in adsorbent dosage upto 1 g l−1 and then it remained almost constant. Increase in the percentage of dye removal with adsorbent dosage could be attributed to an increased in the adsorbent surface area, which increased the availability of more adsorption sites. In the further experiments the adsorbent dosage was fixed at 1 g l−1 for adsorption of fast green
The uptake of fast green by coffee husk increased with the increase in contact time and it remained constant after an equilibrium time as shown in Figure. 3. The percent dye removal at equilibrium time decreased with increase in dye concentration, although the amount of dye removed increased with increase in initial dye concentration. It is clear that the percentage removal of dyes depends on the initial concentration of the dye. The time taken to attain equilibrium was less than 100 minutes.
In order to optimize the design of a sorption system to remove dyes from aqueous solutions, it is important to establish the most appropriate correlation for the equilibrium curves. The isotherms data were analyzed using two of the most commonly used equilibrium models, Langmuir (Langmuir, 1918) and Freundlich (Freundlich, 1906) isotherm models (Fig 4 & 5). The mathematical expressions are given by Equations 1 and 2, respectively, as follows: q = qmax b Ceq / 1+ b Ceq ……………………..(1) q = Kf Ceq 1/n…………………………………… (2) The calculated isotherm constants given in Table 1 were evaluated from the linear plots represented by Equations 3 and 4, respectively for Langmuir and Freundlich isotherms.
Mechanism of adsorption of dyes: Based on the results obtained, the mechanism of adsorption of methylene blue and amaranth is discussed below. Adsorption of Fast green: When dye anions (fast green) are introduced in the system containing adsorbents, they may be adsorbed onto the positively charged surface in two ways (Sharma and Forster, 1994): The first way: CxOH2 2+ + 2 Dye- → Cx OH2 dye+……………….. (8) This reaction does not account for the change in pH of the solution after dye adsorption compared to the blank i.e. in the absence of dye anion. The second way: CxOH+ + Dye- → Cx O (Dye) + + OH- ………. (9) This accounts for the increase in pH of the solution after dye adsorption.
|