|
Result and Discussion
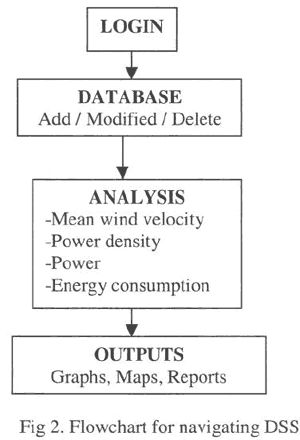
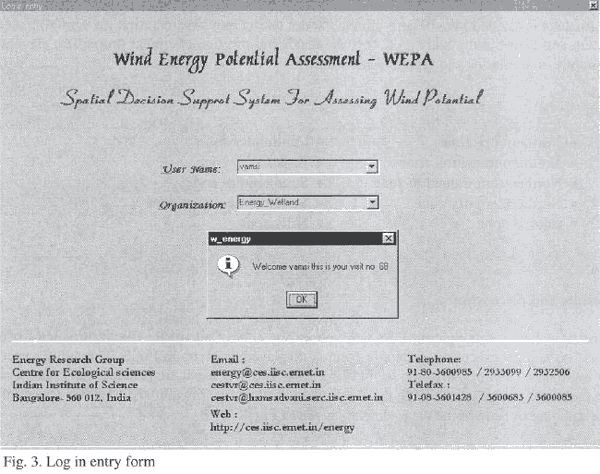
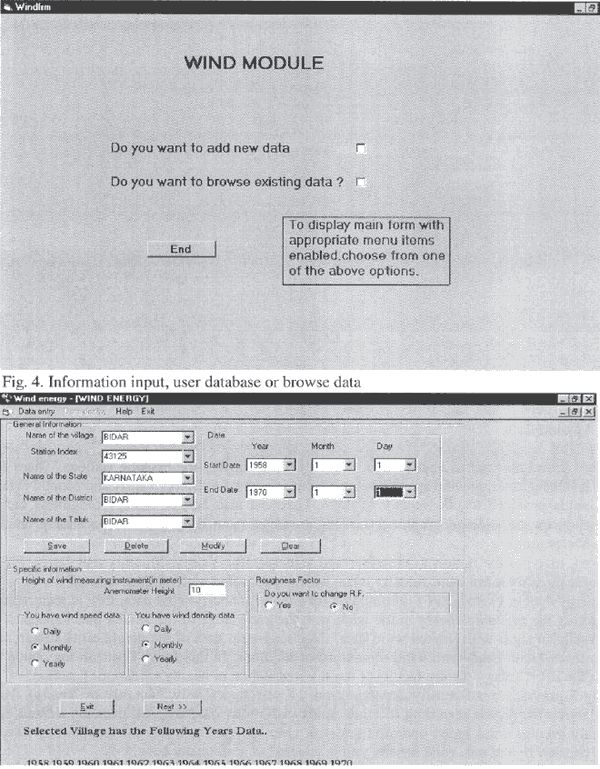
The flowchart for navigating DSS is given in Fig 2. An Executable file is provided for this application and by executing, the login form is displayed as given in Fig 3. This allows user to enter login name and organization for existing users and new users are prompted to create a new login name and organization. With these information input, user is allowed to either append data to the database or browse the data, which is given in Fig 4.
6. 1. Append data
This allows the user to append new data as well as display the existing stations. There are three levels for entering wind speed data, wind density data. i.e. Daily, Yearly and Monthly (Fig. 5). User is provided to choose any of them. User can also add or modify roughness factor depending on the sites geographical aspects. a ranges from 0.16 to 0.30 (depending on the station's location).
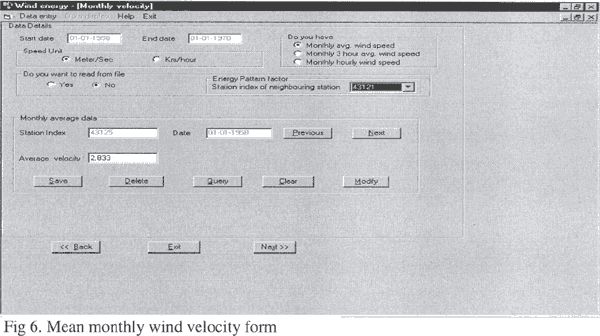
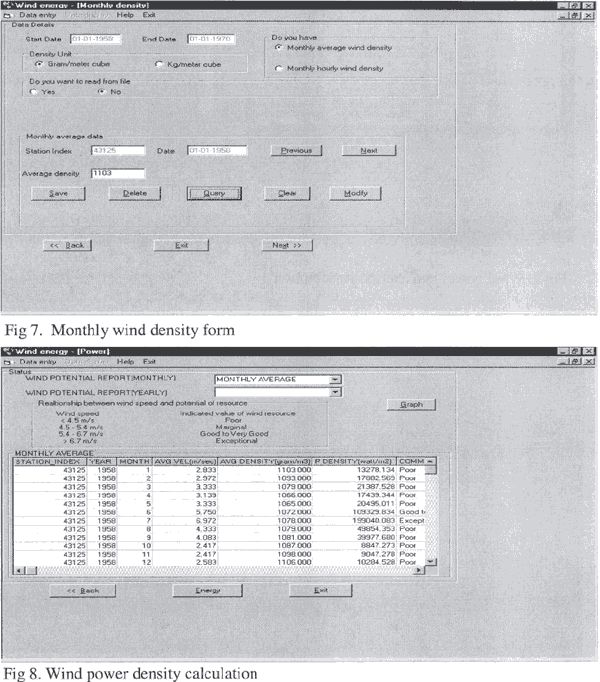
Next, user has the option to view average velocities for Yearly, Monthly and Daily. Fig 6 gives the monthly mean wind velocity fonn, which is activated with monthly option. Energy Pattern Factor (EPF) is computed for sites with hourly wind data. EPF is required for computing the available energy in the wind with the knowledge of the annual mean speed. It is also useful in cases with limited wind data, since long-tenn data of the neighboring station can be correlated with short-tenn wind measurement locations. In this fonn, User has the option to select the EPF (Energy pattern factor) of the selected station or nearby neighboring station. Fig 7 provides wind density depending on the selection (Daily, Monthly or Yearly). This fonn shows the details regarding to wind density with start date and end date. By default, the monthly average wind speed option is selected. User has the option to choose monthly hourly wind density. By default, wind density unit is selected as gram/meter cube.
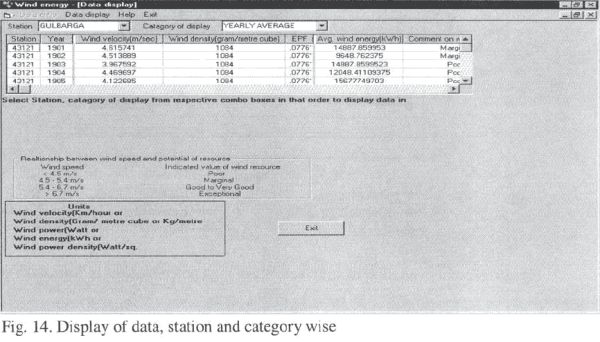
Fig 8 gives power density and status of wind power potential (depending on the velocity as given in table 1). By choosing the appropriate option from wind potential report (monthly / yearly), results are displayed in grid.
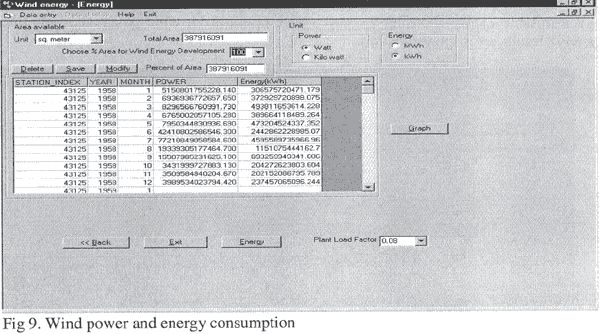
Wind power is computed as follows,
Wind power =average (power density) * area--------------(9)
Wind energy =[[wind power * (count of days * 24)]/1000] * plant load factor----------(10)
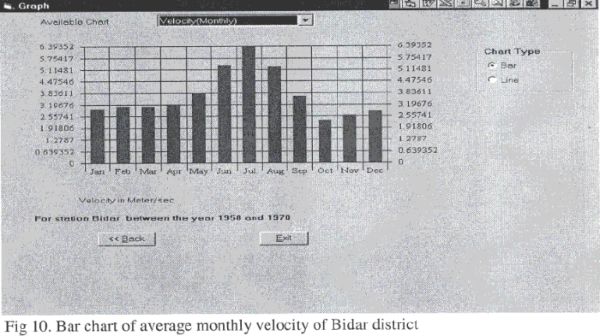
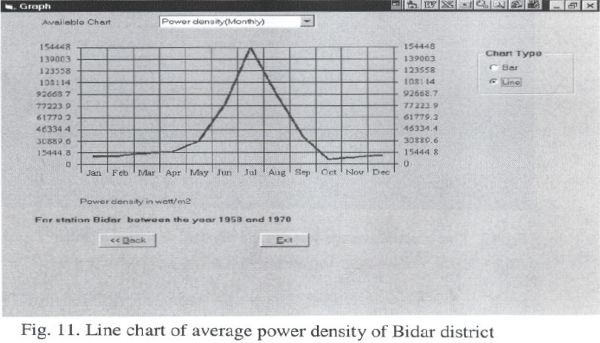
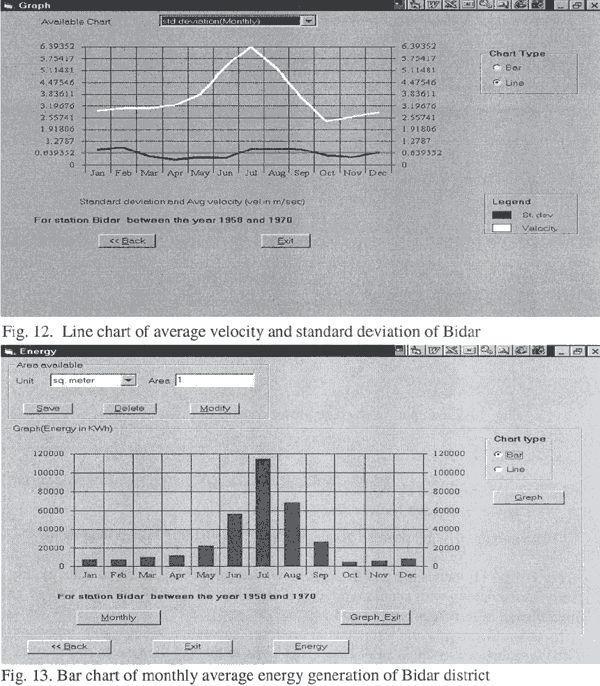
Fig 10 and 11, shows bar and Line chart options for displaying mean velocity. Fig 12 depicts mean velocity along with standard deviation. Bar chart of monthly average energy generation of Bidar district is shown in Figs 13 and 14.
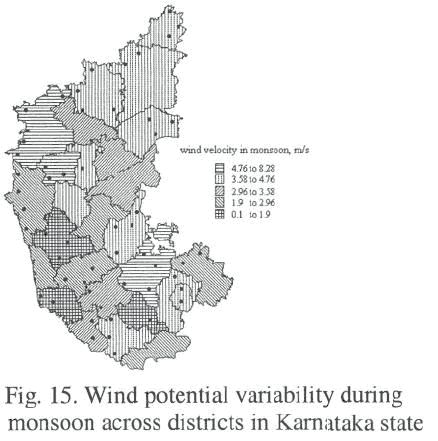
In order to provide the user spatial analyses capability, Geographic information systems (GIS) is embedded in the WEPA DSS. This helps to display the results and identify the needed modifications to the constraints so as to consider the spatial structure. It is used for identifying and quantifying the effect of local constraints on the wind energy potential. This helped in providing the flexibility to enrich the database, with spatial data on which decisions are based. Wind potential maps across various seasons were generated using GIS considering seasonal wind velocities at various locations. Wind velocities are presented as thematic layers, which helps to identify the sites with higher energy production. Fig 15 depicts the wind potential variability during monsoon across districts in Kamataka state, India. The wind potential is evaluated station wise and is represented by a polygon in the map.
6. 2. Wind power density
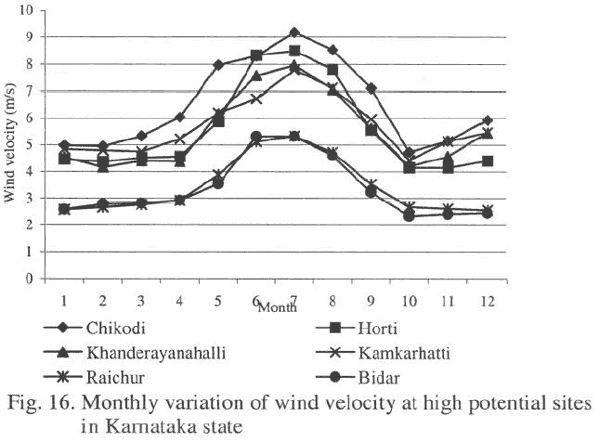
Table 2 lists locations with mean wind speed greater than 18 km per hour. Fig 16 shows monthly variation of wind velocity at high potential sites in Karnataka state. It is assumed that 2% of wastelands could be made available for harnessing wind energy (please note the extent of wasteland / barren land available district-wise in the state ranges from 15% to 45%). With this assumption, month wise wind potential has been computed at all these locations. It is found that about 0.75 to 2 MW could be generated at many locations during seasons. Human pressure on forests to meet the daily energy requirement in the form of fuel wood and fodder for domestic purposes and rural industries is quite evident from the barren hill tops in the coastal and drier belts of Karnataka. Therefore, harnessing of a renewable source like wind at feasible sites would help in the eco-development of the region. Local need for energy in a decentralized way for industrial needs, and for irrigation purposes (in the pre-monsoon period for agriculture and plantations like areca, coconut, etc.) makes the exploitation of wind energy feasible and desirable.
|


 Abstract