|
Methodology
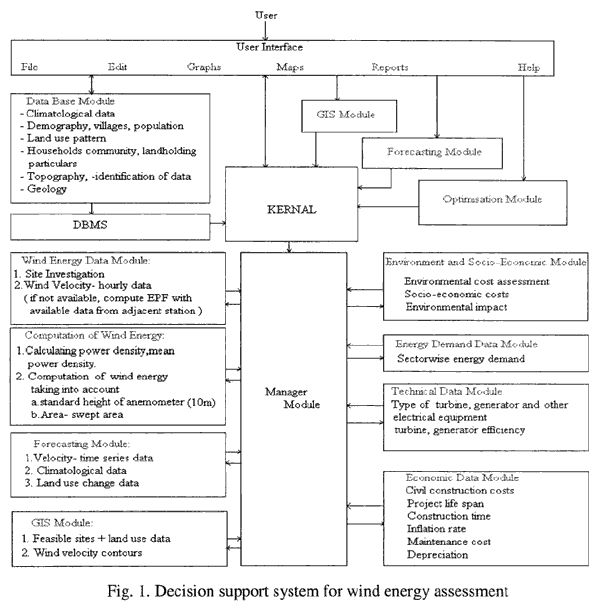
The DSS for wind energy assessment is given in Fig 1, with user friendly Graphic User Interface (GUI) is developed using Microsoft Visual Basic 6.0 as frontend with MS Access database as backend. This GUI environment helps in entry, edit or update of database along with the options to compute the power and energy. Visualization of the data in the form of maps and graphs helps the decision maker in effective interpretation. Currently the database consists of the data for Karnataka state, India.
The Database consists of primary data (selected sites) and daily wind data for the period 1969-2000 from meteorological observatories of India Meteorological Department (IMD), Government of India (IMD, Pune and IMD, Bangalore). Cup counter anemometers with hemispherical cups measuring 7.62 cm in diameter were used in India Meteorological Department observatories until 1973. During 1973-1979, these anemometers were replaced with 3-cup anemometers with 127mm diameter conical cups, in conformit with international practice. The wind instruments are at 10m above ground over open terrain in all these observatories.
Wind speed is a continuously varying parameter, hence it is customary to average the wind speeds during each hour and use the hourly mean wind speed as the basic parameter in calculations of wind power.
4.1. Mean wind speed and energy resource
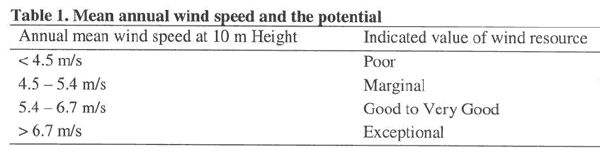
The annual wind speed at a location is useful as an initial indicator of the value of the wind resource. The relationships between annual mean wind speed and potential value of the wind energy resource are listed in Table 1.
In locations where data are not available, a qualitative indication of a high annual mean wind speed can be inferred from geographical location, topographical features, wind-induced soil erosion, and deformation of vegetation. However, accurate determination of the mean annual wind speed requires anemometer data for at least 12 months. The power P due to the kinetic energy of wind is proportional to (112)*[Massx (Velocity)2], that is, the mass of air passing through an area A at velocity V. The mass of air passing through an area A per unit time is pAV and the total power available from wind is,
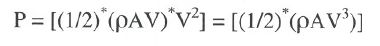 ------ (1) ------ (1)
where  is the mass density, AV air mass flow rate, and V the air-stream velocity. is the mass density, AV air mass flow rate, and V the air-stream velocity.
4. 2. Adjustment of heights of anemometer
Anemometers at different meteorological stations are set at different levels. The measurements and wind speed recorded at each station, prior to any analysis, had to be adjusted to the same height. A level of 10m is the standard for a typical meteorological station to measure the wind speed. If the data collected is at different height they are adjusted to 10m by the India Meteorological Department according to Equation 2,
(V1/V2) =(H1/H2) -------------------(2) -------------------(2)
where V1 is wind speed at height H1 of 10m above ground level, V2 wind speed at height H2 above ground level, and the roughness factor (0.30).
4.3. Windspeedfrequency distribution
The wind speed frequency distribution at a given location is either tabulated from wind speed data measured as a function of time or approximated by a probability distribution function based on measured data or assumed wind resources characteristics. In recent years, much effort has been made to construct an adequate statistical model for describing the wind frequency distribution. Earlier studies have shown that the Weibull distribution gives a good fit to the experimental wind speed data [5, 6]. The probability density function F (v) for wind data is given by,
F (v) =(k/c)*(V/c)k-1 * Exp [-(V/c)k]------------ (3)
The cumulative distribution function (CDF) is
M (v) =1- Exp [-(V/c)k]----------------- (4)
where k is a dimensionless shape factor, c scale factor with units of speed, and F (v) the probability or percentage of occurrence per unit speed of the wind speed V.
4.4. Energy pattern factor (EPF)
The power density per unit area is given by,
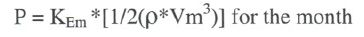 ------------ (5) ------------ (5)
 ------------------(6) ------------------(6)
where, is the density, and KEm and KEa the energy pattern factor [EPF] for month and year respectively [7].
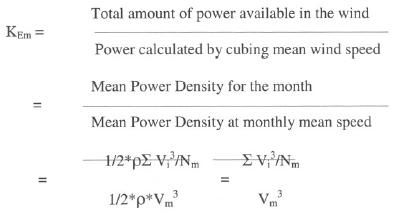 ------------------(7) ------------------(7)
where Vi is the hourly wind speed during the month, Nm the number of hourly wind speed
values during the month and Vm the monthly mean wind speed = SVi/Nm, while the annual
energy pattern factor is,
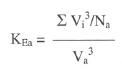 ------------------(8) ------------------(8)
The mean power density for the month =KEm *1/2* *Vm3, and for the year =KEa *1/2* *Va3
4. 5. Windfarm and turbine size
It is found at present that the wind turbines of 225 kW each are economically attractive. If 10% of wasteland (in the region of 10 km width along the coastal tract) is made available for power generation, the calculations show that along the coastal tract of Karwar and Kumta, wind farm of rated capacity of 1.35 megawatt (6 units of 225kW each) can be established [8].
4. 6. Estimation of output
Turbine efficiency of 40% and electric generator efficiency of 85% are used in the calculation. With this, an overall efficiency of 35% in wind-electric generator units could be achieved. A load factor of 0.3 is assumed in the computation of energy output.
Apart from well-known day-night and seasonal variation of wind regime, it is to be noted that the wind is fairly reliable compared to Hydel resources (rainfall). The coefficient of variation (COV) of mean wind speed is about 5.85 per cent compared to a higher COV of rainfall (of about 28%).
|


 Abstract