|
Results and Discussion
The classified images from 1989 – 2006 showed an overall accuracy of 76%. Land Use changes were more prominent in the area during the last 2 decades consequent to increase in barren land as indicated in Table 1 and represented in Figure 2. The LU analysis shows that there has been 55% increase in urban and open areas during 1989-2000 and 39% increase during 2000-2005, and 18.92% increase during 2005-06 (Figure 3). This land cover changes have also influenced the local climate. The minimum (min) and maximum (max) temperature was found to be -2º C and 31º C from Landsat Data as tabulated in the Table 2. The analysis showed that there has been an increase in temperature from 1989 to 2006, evident from Figure 4.
Table 1(a): Land use changes in Himachal Pradesh
| Class |
Himachal Pradesh (1989) |
Himachal Pradesh (2000) |
Himachal Pradesh (2005) |
Himachal Pradesh (2006) |
| Ha |
% |
Ha |
% |
Ha |
% |
Ha |
% |
| Water |
16485.67 |
0.78 |
16039.310 |
0.68 |
10655.53 |
0.44 |
9454.23 |
0.53 |
| Vegetation |
1774602.38 |
73.16 |
1537166.84 |
63.37 |
1250625.53 |
51.56 |
1150875.26 |
47.32 |
| Snow |
142757.71 |
5.8 |
107648.80 |
4.43 |
99234.98 |
4.09 |
98756.32 |
4.07 |
| Rock and Urban |
491566.38 |
20.26 |
764532.92 |
31.52 |
1064898.29 |
43.09 |
1166326.25 |
48.08 |
| Total(ha) |
2425412.17 |
Table 1(b): Land use changes in Shimla, Himachal Pradesh
| Year > |
Shimla (1989) |
Shimla (2000) |
Shimla (2005) |
Shimla (2006) |
| Class |
Ha |
% |
Ha |
% |
Ha |
% |
Ha |
% |
| Vegetation |
240397.53 |
87.45 |
223778.3 |
81.3 |
217684.6 |
79.13 |
215684.6 |
78.4 |
| Water |
10.88 |
0.05 |
12.98 |
0.1 |
7.44 |
0.05 |
7.41 |
0.05 |
| Snow |
9373.37 |
3.4 |
9092.591 |
3.3 |
9499.76 |
3.45 |
9199.76 |
3.35 |
| Rock & Urban |
25176.713 |
9.1 |
42074.63 |
15.30 |
47766.69 |
17.37 |
50066.72 |
18.20 |
| Total(ha) |
274958.493 |
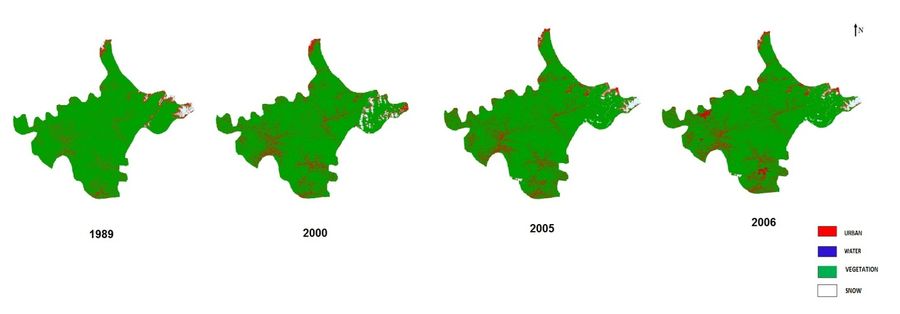
Figure 2. Land use in 1989, 2000, 2005 and 2006
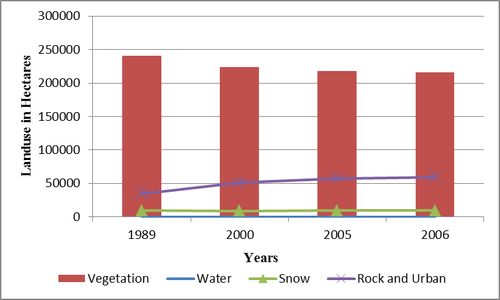
Figure 3: Land use changes in Shimla, Himachal Pradesh
Table 2: Land surface Temperature changes in Shimla, Himachal Pradesh
| Year |
Temperature oC
(Maximum) |
Temperature oC
(Minimum) |
| 1989 |
27 |
3 |
| 2000 |
28 |
-1 |
| 2005 |
30 |
-1 |
| 2006 |
31 |
-2 |
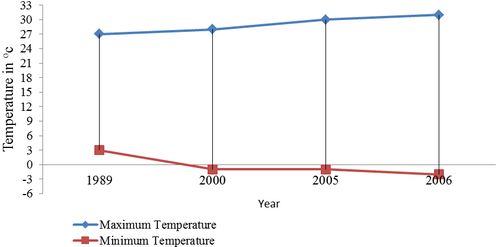
Figure 4: Changes in the temperature with respect to time in Shimla, Himachal Pradesh
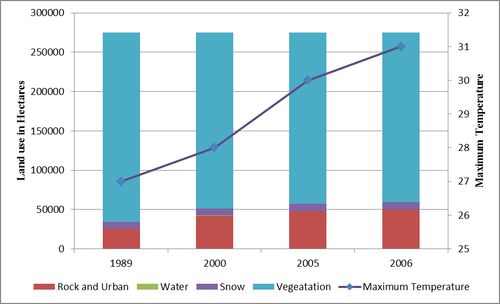
Figure 5: Temporal Variations in Land-use and temperature in Shimla, Himachal Pradesh
Figure 5 illustrates the linkages between local temperatures with the changes in land-uses. The temperature in the study area during the year 1989 was minimum 3º C and maximum 27º C, where as in the year 2006 the minimum -2º C and maximum 31º C (given in Table 2), which highlights that LU characteristics play a significant role in maintaining the ambient temperature and also in the regional heat island phenomenon. The population of this region exceeds its carrying capacity and is exerting pressure on the local natural resources such as land, water, etc. [27, 28, 29].
|
