 |
Land Surface Temperature Analysis in an Urbanising Landscape through Multi-Resolution data |
 |
Ramachandra T V 1,2,3,* Bharath H. Aithal 1,2 Durgappa Sanna D.2
1 Energy & Wetlands Research Group, Center for Ecological Sciences [CES],
2 Centre for Sustainable Technologies (astra),
3 Centre for infrastructure, Sustainable Transportation and Urban Planning [CiSTUP],
Indian Institute of Science, Bangalore, Karnataka, 560 012, India
*Corresponding author: cestvr@ces.iisc.ac.in
|
Methodology
The RS data used to study the temporal changes in landscape pattern were Landsat Thematic Mapper (TM), Landsat Enhance TM Plus (ETM+) of 1989 to 2006 [21]. The data were geo-referenced, rectified and cropped pertaining to the study area. Landsat ETM+ bands of 2010 were corrected for the SLC-off by using image enhancement techniques, followed by nearest-neighbour interpolation.
- Land use and land cover analysis: This was carried out using data of Landsat satellite using supervised pattern classification using Gaussian maximum likelihood classifier (GMLC). This method has already been proved as a superior method as it uses various classification decisions using Probability density functions [22]. Mean and covariance matrix are computed using estimate of Maximum likelihood estimator. Application of this method resulted in accuracy of about 75% in all the datasets. For the purpose of accuracy assessment, a confusion matrix was calculated. Land Use was computed using the temporal data through open source program GRASS: Geographic Resource Analysis Support System (http://ces.iisc.ac.in/grass, http://grass.fbk.eu/)
- Calculation of Land surface Temperature from Landsat data: LST was computed [23] from TIR bands (Landsat TM and ETM). Emissivity corrections for specified LC is carried out using surface Emissivity as per Snyder et al., (1998); Stathopoplou et al., (2007) [20, 24] and land surface temperature is calculated as per Artis and Carnahan (1982) [25], Carnahan and Larson, 1990 [26] and Friedl, M.A., 2002 [16].
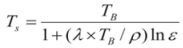 ……. … ……. 1 ……. … ……. 1
where, λ the wavelength of emitted radiance for which the peak response and average of the limiting wavelength (λ = 11.5µm) [5] were used, ρ=1.439 x 10⁻² mk and E=Spectral Emissivity.
LC was determined through the computation of Normalised Difference Vegetation Index (NDVI) using Landsat visible Red (0.63 – 0.69 µm) and near-infrared band (0.76 – 0.9 µm) bands of Landsat TM/ETM. NDVI was computed in order to calculate emissivity for computing LST.
NDVI is given by
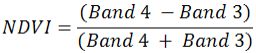 ……………. (2) ……………. (2)
|
|
Citation : Ramachandra. T.V., Bharath H. Aithal and Durgappa Sanna D., 2012. Land Surface Temperature Analysis in an Urbanising Landscape through Multi-Resolution Data., Journal of Space Science & Technology, Volume 1, Issue 1, April 2012, Pages 1-10.
|