|
Results and discussion
Seasonal variability of GHI; geographic and climatic influences
The NASA and NREL datasets were analysed spatially using GIS. Results based on both datasets show that Himachal Pradesh receives an average insolation of 5.86±1.02 – 5.99±0.91 kWh/m2/day in the warm summer months of March, April and May; 5.69±0.65 – 5.89±0.65 kWh/m2/day in the wet monsoon months of June, July, August and September; 3.73±0.91 – 3.94±0.78 kWh/m2/day in the colder winter months of end October, November, December, January and February. It is observed that the period from March to October which covers the summer and monsoon seasons over the entire agro-climatic zones of Himachal Pradesh receives insolation above 4 kWh/m2/day. The insolation throughout Himachal Pradesh drops down with the onset of winter by the end of October, and a low insolation period prevails till the end of February.
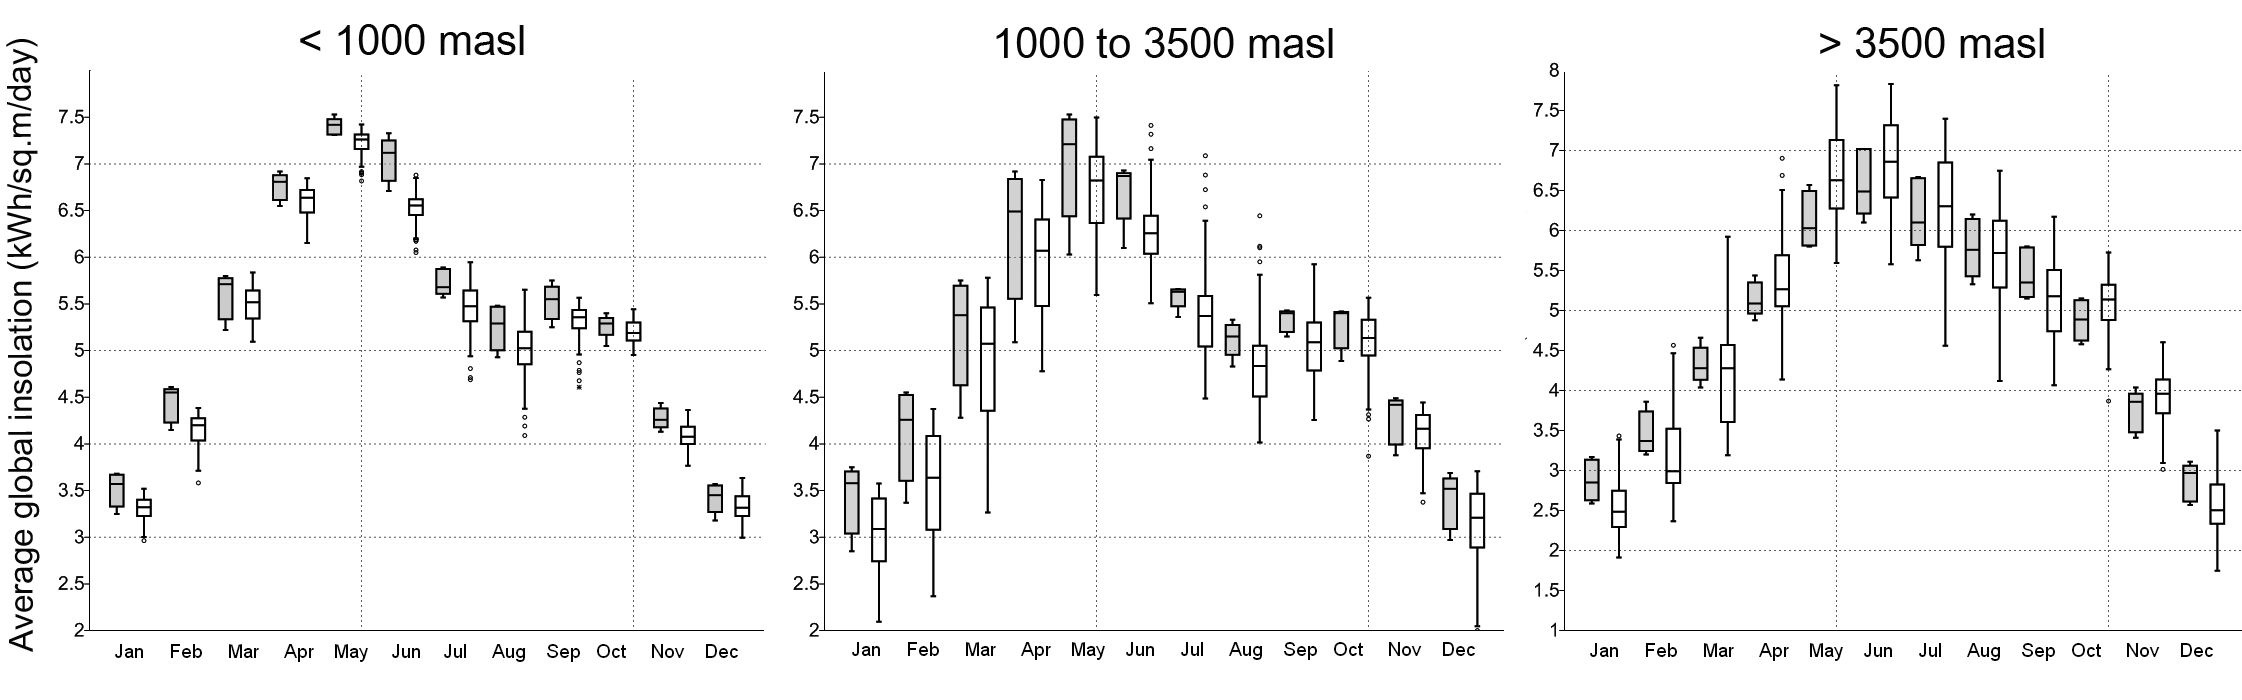
Cloud cover increases with increasing elevation as a consequence of the cloud-topography interactions and orographically-induced convection. This is evident from the monthly average cloud cover data procured from a 100 years average meteorological dataset (Figure 7). Lahul Spiti district in the high altitude alpine zone has the highest average cloud cover and Solan district in the low altitude tropical zone has the least. This also highlights the fluctuation in cloud amount over the advection facing and opposite sides of the mountains [35]. The relief and resultant cloud cover influences the regional variation in insolation to a bigger extent and are apparent in the box plots given in Figure 6. The insolation in Himachal Pradesh is observed to increase from high altitude cold and dry alpine zone to the low altitude warmer regions (below 1000 m). This regional insolation variation is observed for a major part of the year from October to May. However, the trend reverses from June to September with the high altitude zone receiving comparatively higher insolation. These trends could be attributed to the Southwest monsoon and the increase in cloud cover over the low as well as middle altitude regions (below 3500m) and the northeast dry monsoon winds from Central Asia setting in October.
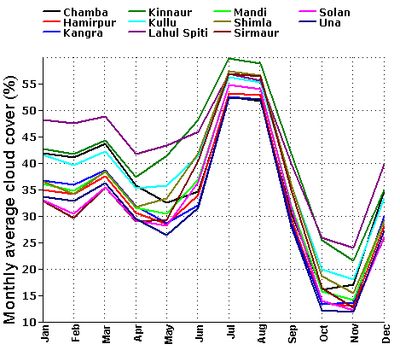
Figure 7: District wise monthly average cloud cover (%) in Himachal Pradesh
Regional variability of GHI; solar resource availability and utilization
The monthly GHI maps based on NASA SSE enriched with isohels (regions receiving same amount of insolation) show the regional variability of the solar resources in Himachal Pradesh (Figure 8 - Figure 9). The results are validated by the district level monthly GHI maps generated based on NREL SUNY data (Figure 10 - Figure 11). The monthly solar resource availability as well as variability in different districts of Himachal Pradesh is noted. It is observed that the lower and middle altitude (< 3500 m) districts of Una, Bilaspur, Hamirpur, Solan, Mandi, Sirmaur and Shimla receive annual average GHI above 5 kWh/m2/day. The districts of Lahaul Spiti, Kinnaur, Kullu and Chamba located at higher altitude (>3500 m) receive annual average GHI in the range 4.5 – 5 kWh/m2/day. As pointed in section 6.1, the entire state receives monthly average GHI above 4 kWh/m2/day from March to October. The lower and middle altitude districts receive monthly average GHI above 4 kWh/m2/day in the winter months of November and February; 3 – 3.5 kWh/m2/day in December and January. However the entire winter witnesses least values ranging from 2.5 – 3 kWh/m2/day in the higher altitude districts.
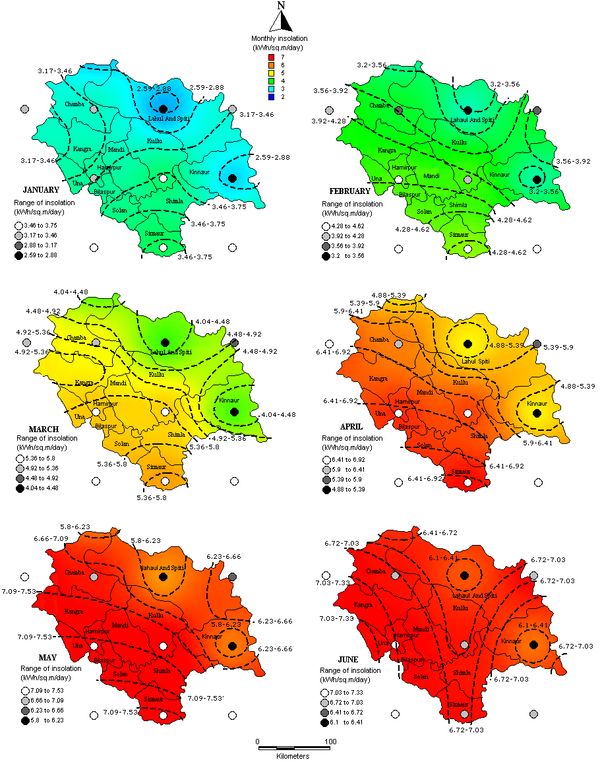
Figure 8: Monthly average GHI maps based on NASA SSE data enriched with isohels for January - June
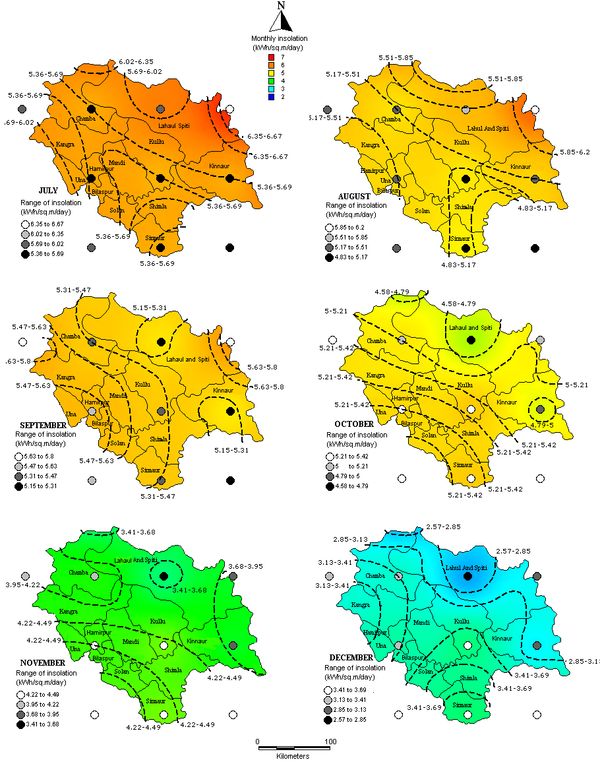
Figure 9: Monthly average GHI maps based on NASA SSE data enriched with isohels for July- December
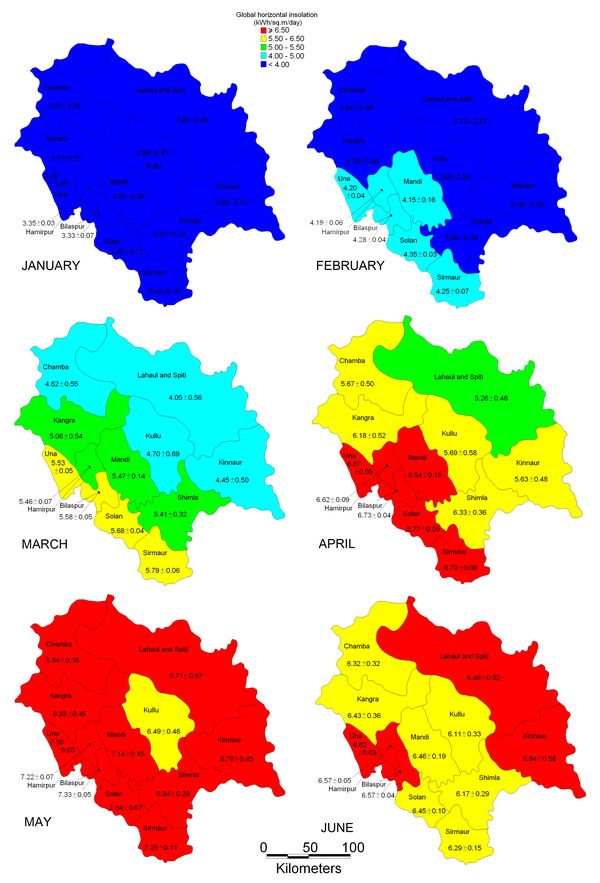
Figure 10: Monthly average district level GHI maps based on NREL SUNY data for January-June
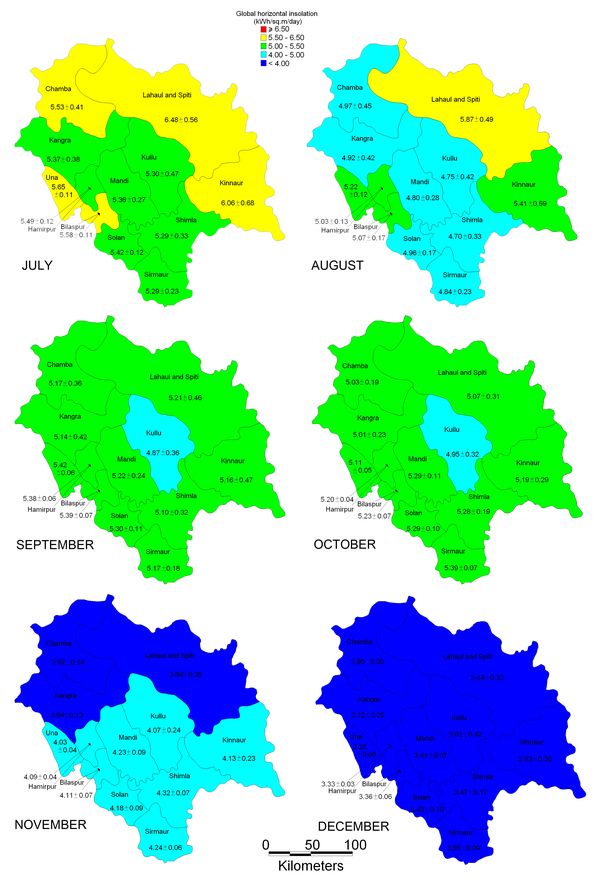
Figure 11: Monthly average district level GHI maps based on NREL SUNY data for January-June
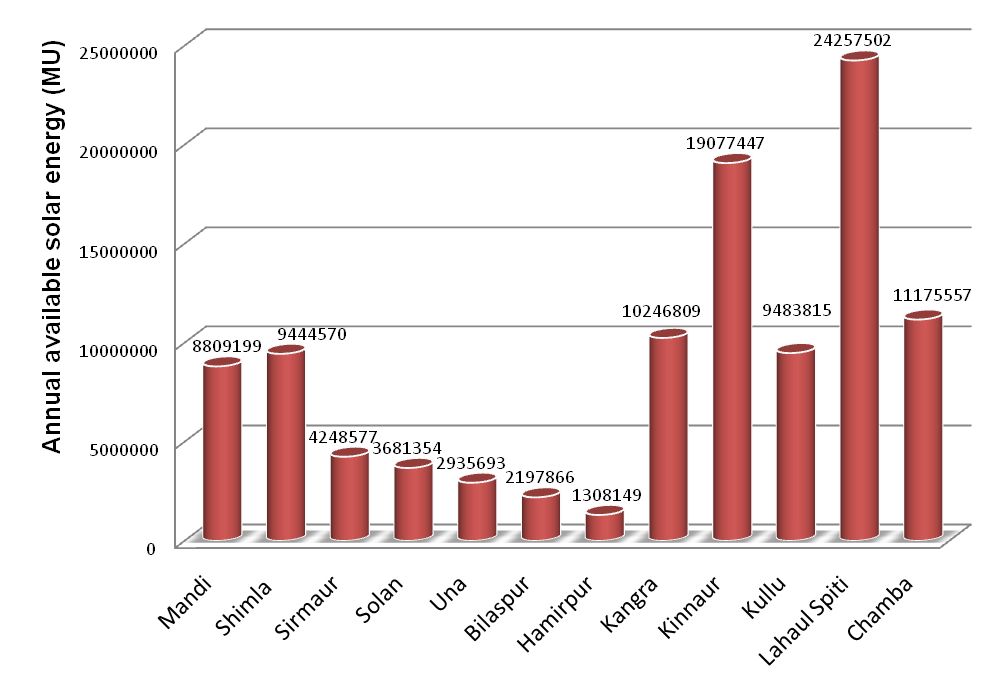
The state of Himachal Pradesh consumed 5814 Million kWh (or Million Units, MU) of electricity in 2009-10 [36] giving us an estimate of the power requirement in the state. Analyses based on NREL SUNNY data show that Himachal Pradesh receives 99530395MU of solar energy per year. Figure 12 shows the district wise annual average solar energy received. Considering 0.1 % of the total land area in low and middle altitude districts available for solar energy utilization, 43324 MU is available annually for conversion through solar applications. Higher altitude districts with sparse and isolated population require decentralized energy. The annually available solar energy of 56206 MU (considering 0.1 % of the land area per district) could be effectively utilized along with additional energy sources as hybrids.

Figure 12: Annual available solar energy (in Million Units) in the districts of Himachal Pradesh
|


