 |
Solar Potential in the Himalayan Landscape |
 |
Ramachandra T V 1,2,3,* Gautham Krishnadas 1 Rishabh Jain 1
1 Energy & Wetlands Research Group, Center for Ecological Sciences [CES],
2 Centre for Sustainable Technologies (astra),
3 Centre for infrastructure, Sustainable Transportation and Urban Planning [CiSTUP],
Indian Institute of Science, Bangalore, Karnataka, 560 012, India
*Corresponding author: cestvr@ces.iisc.ac.in
|
|
|
|
Data procurement and comparison
The 1° X 1° resolution NASA SSE monthly averages of GHI for the study region were collected. Within a grid of ~10000 km2 area, any points which do not lie on its Northern or Eastern boundaries share a common GHI value corresponding to the midpoint of the grid. Out of 13 optimal grids 10 provide a complete coverage of the land area of the state while the other 3 are used to support an optimal interpolation through Geographic Information System (GIS). Among all, 6 grids cover Chamba, Lahaul-Spiti, Krishnaganj/Kinnaur, Hamirpur, Kullu and Sirmaur districts of Himachal Pradesh, 5 grids cover the districts of Kargil, Kathua (Jammu & Kashmir), Fatehgarh Sahib (Punjab), Muzaffarnagar (Uttarpradesh), Tehri Garhwal (Uttarakand) and 2 grids cover the Tibetan region (Figure 5). The NREL SUNY data cover an average area of 95.185 km2 per grid in the study region. The monthly averages of GHI for 610 optimum grids covering the entire state of Himachal Pradesh were collected. This provides higher spatial resolution information preferable for regional level potential assessment within the state.
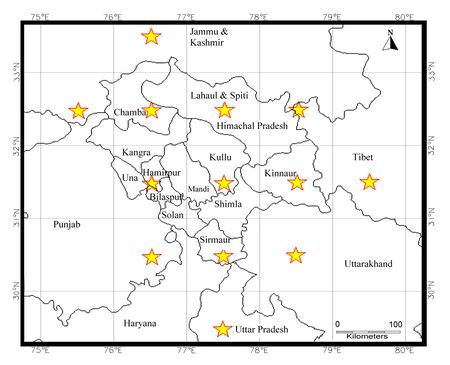
Figure 5: Selected grids (star marked) for procuring NASA SSE GHI data of Himachal Pradesh
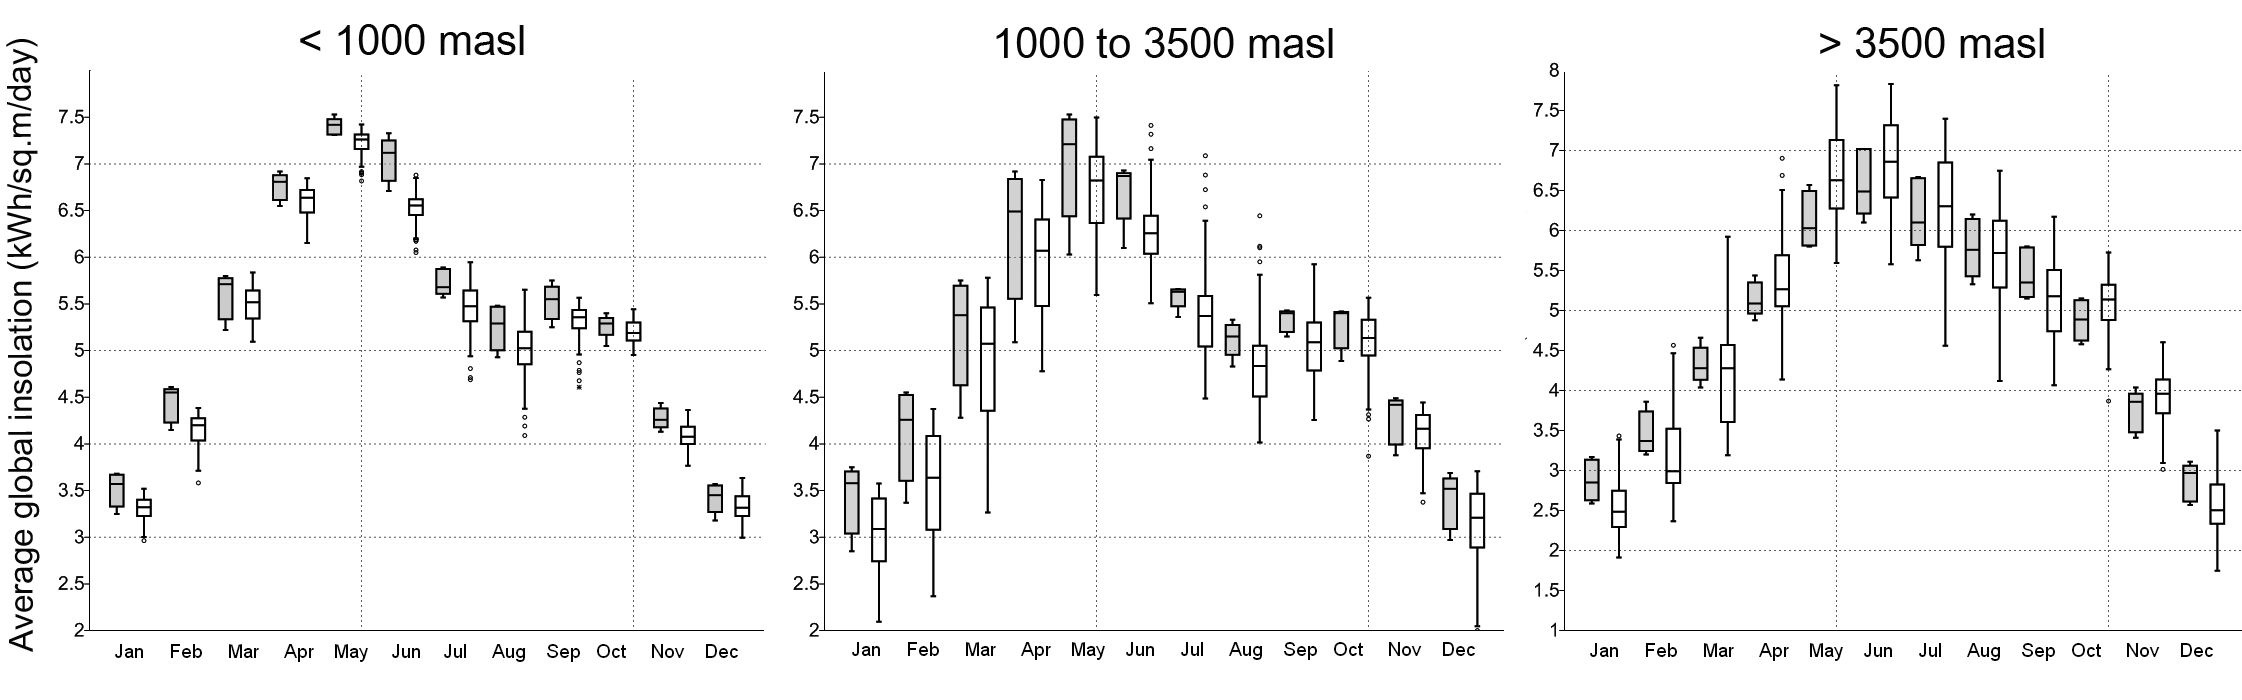
The collected datasets from NASA SSE and NREL SUNY were compared and validated for three different elevation zones viz < 1000 m, 1000 – 3500 m and > 3500 m as shown in Figure 6. The monthly variations of average GHI were comparable for different elevation gradients. The RMSE of monthly average GHI between NASA and NREL datasets were 0.24, 0.32 and 0.28 kWh/m2/day for < 1000 m, 1000 – 3500 m and > 3500 m zones respectively. NASA SSE based GHI values were observed to be positively biased to NREL SSE GHI data. These datasets were also validated with a reliable surface measurement [2] given in Table 1, showing RMSE of 0.25 kWh/m2/day with NASA SSE and 0.38 kWh/m2/day with NREL SUNY data. The relatively lower resolution NASA SSE data were used to generate GHI maps for the entire state. This helps in identifying the regional and seasonal variability of GHI within the state. The higher resolution NREL SUNY data were used for district level GHI maps of the state essentially to quantify the regional potential for solar applications design.
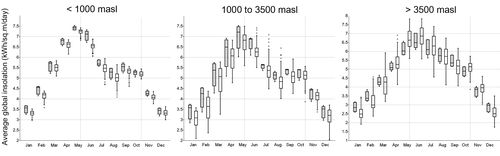
Figure 6: Comparison of monthly average GHI from NASA SSE (shaded box) and NREL SUNY (clear box) over different elevation zones (<1000 m, 1000-3500 m, >3500 m) of Himachal Pradesh
Table 1: Solar radiation data through ground based pyranometer [2]
| Months |
Jan |
Feb |
Mar |
Apr |
May |
Jun |
Jul |
Aug |
Sep |
Oct |
Nov |
Dec |
Annual |
Average insolation
(kWh/m2/day) |
3.55 |
4.19 |
5.32 |
6.33 |
7.10 |
6.5 |
5.48 |
5.81 |
5.33 |
5.20 |
4.00 |
3.23 |
5.17 |
|
|
Citation : Ramachandra. T.V., Gautham Krishnadas and Rishab Jain, 2012. Solar Potential in the Himalayan Landscape., International Scholarly Research Network,
ISRN Renwable Energy,
Volume 2012, 13 pages.
|
