|
Results and Discussion
Temporal land cover analysis was done through NDVI reveals the transition of vegetation from 96.13 % (1989) to 89.07 % (2009). The non-vegetated areas have increased by 10.93% (2009) from 3.87% (1989). The temporal variation of land cover is shown in table 2 and figure 3.
Table 2: land cover analysis
| Year |
% vegetation |
% non-vegetation |
| 1989 |
96.13 |
3.87 |
| 1999 |
94.33 |
5.67 |
| 2009 |
89.07 |
10.93 |
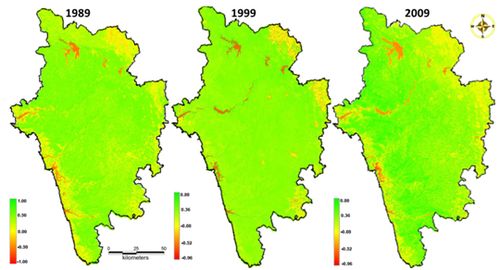
Figure 3: Temporal land cover analysis
Temporal land use analysis depicts land scape status and its transition from 1989 to 2009. The results show the primeval evergreen forest cover is reduced from 57.65% (1989) to 39.78% (2009) due to anthropogenic activities. Built-up area has increased from 1.13% (1989) to 2.00% (2009). The intensified agriculture activities have contributed to the decline of forests. Table 3 and figure 4 portray the transition of landscape during 1989 to 2009.
Table 3: temporal land use analysis
| Year |
1989 |
1999 |
2009 |
| Land use Category |
Ha |
% |
Ha |
% |
Ha |
% |
| Built-up |
11,569 |
1.13 |
15,991 |
1.56 |
20,616 |
2.0 |
| Water |
19,454 |
1.89 |
26,391 |
2.57 |
28190 |
2.73 |
| Crop land |
175,236 |
17.06 |
170,886 |
16.63 |
185,642 |
18.02 |
| Open fields |
40,336 |
3.93 |
19,116 |
1.86 |
19,042 |
1.8 |
| Moist deciduous forest |
85,087 |
8.28 |
208,677 |
20.31 |
207924 |
20.18 |
| Evergreen to semi evergreen forest |
592,238 |
57.65 |
447,475 |
43.56 |
409926 |
39.78 |
| Scrub/grass lands |
33,843 |
3.29 |
51,439 |
5.01 |
49003 |
4.75 |
| Acacia plantations |
46,963 |
4.57 |
55,292 |
5.38 |
67969 |
6.60 |
| Teak/ Bamboo plantations |
10,702 |
1.04 |
18,463 |
1.80 |
25242 |
2.45 |
| Coconut_ Areca nut plantations |
3001 |
0.29 |
10,839 |
1.06 |
14305 |
1.39 |
| Dry deciduous forest |
8831 |
0.86 |
2703 |
0.26 |
3121 |
0.30 |
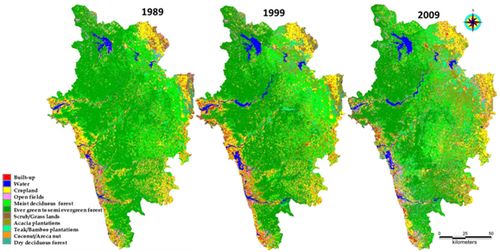
Figure 4: supervised classification-land use analysis
The increase in plantation of exotic species led to the removal of primeval forest cover. Intensified cultivation and cash crop activities also aggregated the change. The accuracy assessment was included in table 4. The field data, vegetation map and Google earth data sets are used for analysing accuracy. It shows accuracy ranges as 84.53 % (1989), 92.22 % (1999) and 89.83 % (2009).
Table 4: Accuracy assessment
M
A
P
2 |
MAP 1 |
1989 |
| Category |
Built-up |
Water |
Crop land |
Open land |
Moist deciduous |
Ever green to semi |
Scrub |
Acacia |
Teak |
Coco nut |
Dry deciduous |
Row sum |
% Commission |
% Omission |
PA |
UA |
| Built-up |
110518 |
38 |
4234 |
617 |
172 |
89 |
733 |
372 |
139 |
786 |
154 |
117852 |
6.22 |
23.11 |
93.78 |
76.89 |
| Water |
652 |
183385 |
3747 |
1607 |
12 |
291 |
698 |
20631 |
1250 |
1603 |
93 |
213969 |
14.29 |
0.58 |
85.71 |
99.42 |
| Crop land |
23989 |
54 |
1267257 |
52420 |
97996 |
4407 |
128358 |
16069 |
25368 |
62569 |
18329 |
1696816 |
25.32 |
6.01 |
74.68 |
93.99 |
| Open land |
3318 |
294 |
23260 |
304600 |
2486 |
1588 |
2353 |
44103 |
2680 |
1969 |
405 |
387056 |
21.30 |
21.14 |
78.70 |
78.86 |
| Moist deciduous |
689 |
7 |
9410 |
3009 |
1008588 |
57697 |
19969 |
28545 |
52357 |
31852 |
46107 |
1258230 |
19.84 |
36.44 |
80.16 |
63.56 |
| Ever green to semi |
1884 |
617 |
25031 |
17998 |
455344 |
5824268 |
17713 |
117922 |
42901 |
122920 |
6849 |
6633447 |
12.20 |
1.43 |
87.80 |
98.57 |
| Scrub |
1219 |
23 |
10465 |
3588 |
7741 |
7271 |
289700 |
4714 |
4530 |
15208 |
947 |
345406 |
16.13 |
40.85 |
83.87 |
59.15 |
| Acacia |
975 |
24 |
1724 |
1499 |
6824 |
6356 |
8338 |
381337 |
14926 |
4422 |
6313 |
432738 |
11.88 |
38.36 |
88.12 |
61.64 |
| Teak |
169 |
2 |
151 |
310 |
3033 |
3163 |
2703 |
3196 |
91861 |
357 |
2109 |
107054 |
14.19 |
61.25 |
85.81 |
38.75 |
| Coco nut |
3 |
0 |
1705 |
67 |
4520 |
3479 |
30 |
652 |
203 |
113931 |
11 |
124601 |
8.56 |
67.98 |
91.44 |
32.02 |
| Dry deciduous |
324 |
4 |
1287 |
558 |
232 |
41 |
19155 |
1119 |
823 |
181 |
70171 |
93895 |
25.27 |
53.68 |
74.73 |
46.32 |
| Column Sum |
143740 |
184448 |
1348271 |
386273 |
1586948 |
5908650 |
489750 |
618660 |
237038 |
355798 |
151488 |
11411064 |
|
| Overall accuracy |
84.53 |
Kappa |
0.78 |
M
A
P
2 |
MAP 1 |
1999 |
| Category |
Built-up |
Water |
Crop land |
Open land |
Moist deciduous |
Ever green to semi |
Scrub |
Acacia |
Teak |
Coco nut |
Dry deciduous |
Row sum |
% Commission |
% Omission |
PA |
UA |
| Built-up |
173333 |
0 |
0 |
2 |
0 |
0 |
14 |
180 |
974 |
10 |
73 |
174586 |
1.72 |
22.40 |
98.28 |
77.60 |
| Water |
118 |
289130 |
0 |
2 |
0 |
0 |
0 |
449 |
283 |
258 |
3 |
290243 |
0.38 |
4.47 |
99.62 |
95.53 |
| Crop land |
37396 |
0 |
1733799 |
1725 |
0 |
0 |
0 |
12436 |
14725 |
5676 |
3522 |
1809279 |
4.17 |
12.91 |
95.83 |
87.09 |
| Open land |
4167 |
0 |
0 |
193784 |
0 |
0 |
0 |
9124 |
3609 |
47 |
862 |
211593 |
8.42 |
6.16 |
91.58 |
93.84 |
| Moist deciduous |
3540 |
0 |
0 |
1379 |
2034807 |
42455 |
0 |
119981 |
70035 |
18330 |
2046 |
2292573 |
11.24 |
3.00 |
88.76 |
97.00 |
| Ever green to semi |
1760 |
11243 |
176465 |
8075 |
46198 |
4667018 |
0 |
5471 |
7768 |
9179 |
776 |
4933953 |
5.41 |
2.16 |
94.59 |
97.84 |
| Scrub |
666 |
0 |
0 |
403 |
0 |
10230 |
514664 |
20064 |
8208 |
3199 |
257 |
557691 |
7.72 |
1.84 |
92.28 |
98.16 |
| Acacia |
784 |
0 |
0 |
229 |
0 |
0 |
0 |
591806 |
13134 |
1083 |
349 |
607385 |
2.56 |
25.67 |
97.44 |
74.33 |
| Teak |
806 |
0 |
0 |
40 |
0 |
0 |
0 |
30096 |
180830 |
259 |
2200 |
214231 |
15.59 |
40.82 |
84.41 |
59.18 |
| Coco nut |
655 |
2297 |
80580 |
870 |
16645 |
50383 |
9649 |
3422 |
3662 |
106897 |
233 |
275293 |
61.17 |
26.25 |
38.83 |
73.75 |
| Dry deciduous |
155 |
0 |
0 |
0 |
0 |
0 |
0 |
3199 |
2354 |
2 |
24165 |
29875 |
19.11 |
29.93 |
80.89 |
70.07 |
| Column Sum |
223380 |
302670 |
1990844 |
206509 |
2097650 |
4770086 |
524327 |
796228 |
305582 |
144940 |
34486 |
11396702 |
|
| Overall accuracy |
92.22 |
Kappa |
0.90 |
M
A
P
2 |
MAP 1 |
2009 |
| Category |
Built-up |
Water |
Crop land |
Open land |
Moist deciduous |
Ever green to semi |
Scrub |
Acacia |
Teak |
Coco nut |
Dry deciduous |
Row sum |
% Commission |
% Omission |
PA |
UA |
| Built-up |
347785 |
0 |
0 |
0 |
0 |
0 |
0 |
0 |
0 |
0 |
0 |
347785 |
0.00 |
0.80 |
100.00 |
99.20 |
| Water |
0 |
311622 |
0 |
0 |
0 |
0 |
0 |
0 |
0 |
0 |
0 |
311622 |
0.00 |
0.22 |
100.00 |
99.78 |
| Crop land |
0 |
38 |
1574483 |
136 |
22127 |
0 |
0 |
12718 |
3273 |
0 |
0 |
1612775 |
2.37 |
1.85 |
97.63 |
98.15 |
| Open land |
0 |
0 |
0 |
414479 |
0 |
0 |
0 |
0 |
0 |
0 |
0 |
414479 |
0.00 |
0.93 |
100.00 |
99.07 |
| Moist deciduous |
0 |
80 |
5405 |
513 |
1740979 |
0 |
0 |
149651 |
43013 |
3 |
0 |
1939644 |
10.24 |
5.83 |
89.76 |
94.17 |
| Ever green to semi |
0 |
113 |
2008 |
1296 |
55625 |
3614057 |
8302 |
15406 |
0 |
20216 |
0 |
3717023 |
2.77 |
1.50 |
97.23 |
98.50 |
| Scrub |
0 |
48 |
742 |
58 |
9181 |
0 |
451649 |
4292 |
1502 |
2 |
0 |
467474 |
3.39 |
1.80 |
96.61 |
98.20 |
| Acacia |
2818 |
412 |
21495 |
1892 |
20903 |
54889 |
0 |
1194683 |
706659 |
0 |
0 |
2003751 |
40.38 |
13.22 |
59.62 |
86.78 |
| Teak |
0 |
0 |
0 |
0 |
0 |
0 |
0 |
0 |
0 |
0 |
0 |
0 |
0.00 |
0.00 |
100.00 |
100.00 |
| Coco nut |
0 |
0 |
0 |
0 |
0 |
0 |
0 |
0 |
0 |
523448 |
0 |
523448 |
0.00 |
3.72 |
100.00 |
96.28 |
| Dry deciduous |
0 |
0 |
0 |
0 |
0 |
0 |
0 |
0 |
0 |
0 |
109679 |
109679 |
0.00 |
0.00 |
100.00 |
100.00 |
| Column Sum |
350603 |
312313 |
1604133 |
418374 |
1848815 |
3668946 |
459951 |
1376750 |
754447 |
543669 |
109679 |
11447680 |
|
| Overall accuracy |
89.83 |
Kappa |
0.88 |
LST computed at landscape level for both Landsat TM and ETM thermal bands as explained earlier. The minimum and maximum temperature from Landsat TM data and ETM+ data are given in table 5. The corresponding temperatures for all data were converted to degree Celsius. Figure 5 shows the LST map of Uttara Kannada from 1989, 1999 and 2009. Variability can be attributed to diverse landscape and higher values in recent year to the decline of forests and other human induced activities. The higher temperature can be seen especially in plains due to higher proportion of barren land and in coastal region due to intensified built-up activities. The rise in temperature can be attributed to the regions of higher deforestation and industries. The hilly regions are still maintaining moderate surface temperatures due to the presence of good vegetation cover. The region’s temperature has increased from 32.7oC to 41oC; which is comparable with ground data. The same phenomenon is observed with the mean average temperature of per decade data of NASA NEO (http://neo.sci.gsfc.nasa.gov/Search.html).
Table 5: LST details
| Year |
Min (oC) |
Max (oC) |
| 1989 |
14 |
32.7 |
| 1999 |
16 |
37.56 |
| 2009 |
17 |
41 |
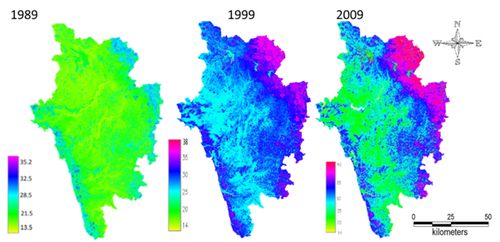
Figure 5: LST from 1989 to 2009
The study is done based on agro-climatic zones - 3 zones; coast, Sahyadri and plains with different levels of land cover. Figure 6 & table 6 for the coastal region shows an increase in temperature from 31oc to 41oc due to rise in built-up areas and industrialization. The Asia’s largest novel base, Kaiga nuclear project and a major industrial estate are situated in this region. The activities associated with these are the major drivers of regional temperature. It is evident from this study; the built-up and area under agriculture is increased at the loss of evergreen forest.
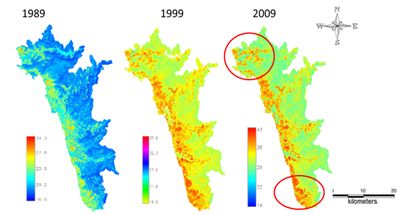
Figure 6: LST with respect to Coastal region
Table 6: Coastal zone variations of LST
| Year |
Min (oC) |
Max (oC) |
| 1989 |
16.49 |
31.34 |
| 1999 |
22.01 |
38.81 |
| 2009 |
22.95 |
42.45 |
Figure 7 & table 7 illustrates the role of vegetation in moderating the local temperature. Sahyadri region of the district maintain moderate rise in temperature, while plain regionswith the enhanced deforestation activities show escalation in temperature. The rise in temperature can be observed due to the increase in crop lands and plantation of exotic species. Table 7 shows increase of temperature from 29oC to 37oC.
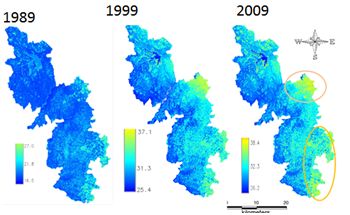
Figure 7: LST with respect to Sahyadri region
Table 7: Sahyadri region LST variations
| Year |
Min (oC) |
Max (oC) |
| 1989 |
16 |
29 |
| 1999 |
24 |
36 |
| 2009 |
26 |
37.2 |
Plains in eastern and north-western parts Uttara Kannada district comprises of extensively planted teak regions and scrub type at the border of Dharwad district. It is observed that the plains are more prone to anthropogenic activities due to the proximity to urban centers. The loss of evergreen forest cover shows deforestation pattern influence on LST (figure 8), evident from steady rise in temperature from 36 to 42oC (table 8).
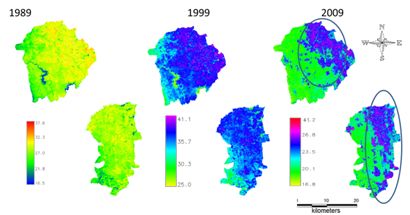
Figure 8: LST with respect to plains
Table 8: LST of plains
| Year |
Min (oC) |
Max (oC) |
| 1989 |
16 |
36 |
| 1999 |
25 |
41.2 |
| 2009 |
16 |
42 |
The time series analysis of air temperature is produced based on monthly average of five year time period interval from 1981-2012. The temperaturesare compiled from weather data of NOAA meteorological stations measurements in and around the study region. This four-decade period functions as a baseline for the analysis. It can be inferred from the generalised curve (figure 9) that the development of the temperature averages runs in irregular rhythm of upand downswings. A trend-like increase in air temperature overlies thecyclic fluctuations of 5 year annual temperature averages sincethe post 2000s. The most significant rise in air temperaturescommenced in 1995-2000, post 2001 the substantial raise in air temperature is observed. The monthly average temperature from 1981-2012 also clarifies this micro level change. The situation of cyclic and trend-like developments has resulted in the fact that the warming has notoccurred steadily, but it is an abrupt rise due to land use changes. As outlook, theresults obtained for the trend analysis have to be putin a general framework by applying the method to long-term correlationsof temperature trendsin order to substantiate these findings.
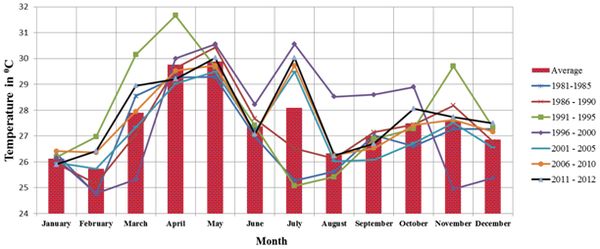
Figure 9: Ambient air temperature as recorded by weather stations from 1981to2012
Table 9: Long term temperature trends
| Month |
1981-1985 |
1986 - 1990 |
1991 - 1995 |
1996 - 2000 |
2001 - 2005 |
2006 - 2010 |
2011 - 2012 |
Average |
| January |
26.3 |
25.9 |
26.18 |
26.14 |
25.97 |
26.41 |
25.90 |
26.1 |
| February |
24.7 |
25.1 |
26.97 |
24.78 |
25.73 |
26.36 |
26.42 |
25.7 |
| March |
28.6 |
27.1 |
30.14 |
25.32 |
27.34 |
27.95 |
28.95 |
27.9 |
| April |
29.3 |
29.6 |
31.67 |
30.00 |
29.04 |
29.52 |
29.20 |
29.8 |
| May |
29.3 |
30.4 |
29.68 |
30.56 |
29.49 |
29.73 |
30.03 |
29.9 |
| June |
27.0 |
27.7 |
27.42 |
28.23 |
27.18 |
27.06 |
27.07 |
27.4 |
| July |
25.3 |
26.5 |
25.07 |
30.56 |
29.49 |
29.73 |
30.03 |
28.1 |
| August |
25.6 |
26.1 |
25.42 |
28.52 |
26.03 |
26.27 |
26.24 |
26.3 |
| September |
27.0 |
27.1 |
26.88 |
28.60 |
26.08 |
26.52 |
26.71 |
27.0 |
| October |
26.6 |
27.4 |
27.29 |
28.90 |
26.73 |
27.42 |
28.06 |
27.5 |
| November |
27.3 |
28.2 |
29.70 |
24.95 |
27.51 |
27.63 |
27.74 |
27.6 |
| December |
27.3 |
26.8 |
27.34 |
25.38 |
26.55 |
27.17 |
27.50 |
26.9 |
Forests in the central Western Ghats are experiencing the transition due to many developmental projects including timber, mining, power generation, etc. This has resulted in the decline of primeval evergreen forest cover from 57.65% (1989) to 39.78% (2009), which has changed LST affecting local ecology.
|
