Results and Discussions
The flowchart for navigating DSS is given in figure 4. This DSS is implemented and the results
are discussed for Kolar district, Karnataka State. An Executable file is provided for this
application and by executing this, a form with Login, Level of Analysis and Resources Menu
options are displayed.
Figure 4: Navigation of DSS
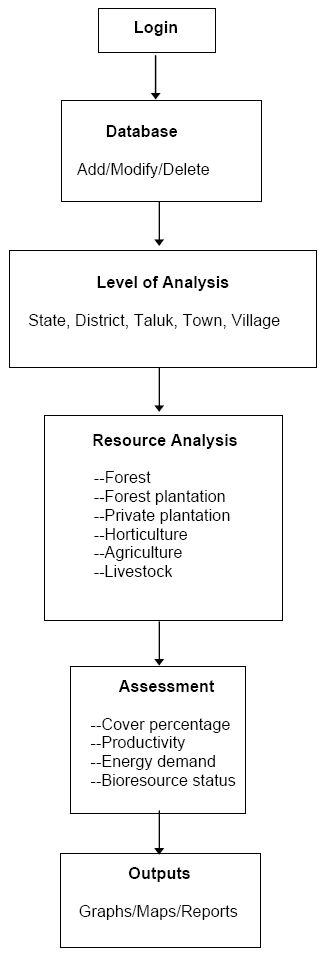
After logging with the user information, the Level of Analysis option is enabled for hierarchical
administrative levels of analysis such as state, district, taluk, town and village levels. This
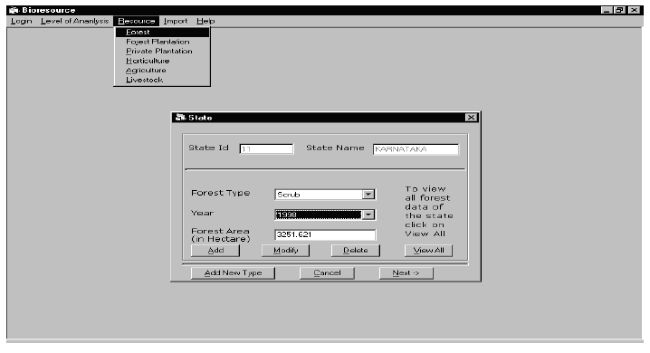
option also enables user to either append data to the database or browse the data. Figure 5 shows
the form enabling the data entry of forest type, productivity, year of estimate and spatial extent
of the forest. Similar options are available for computing bioenergy from agriculture,
horticulture and livestock sectors.
Figure 5: Bio--resource from forests
Total forest area in Karnataka State is 38,284.30 sq. km, of which 74.93% is reserved forest,
10.26% is protected forest, 0.32% is village forest, 13.66% is unclassified forests and 0.805%
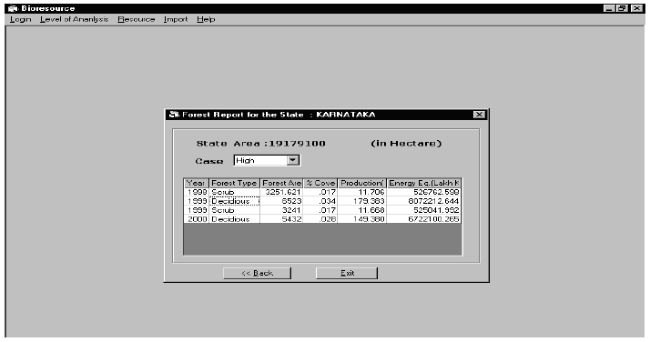
private forests. Provisions to modify or delete or add new forest type with biomass productivity
values to the database are provided. Figure 6 displays the computed cover percentage,
productivity, biomass yield, and energy equivalent values. User can visualize biomass situation
for three cases namely high, low and medium productivity values.
Figure 6: Forest bio--resource, cover percentage, productivity, energy analysis
The vegetation cover in Kolar district as per NDVI and TSAVI analyses is about 52.5 %, while
47.5% is not under vegetation. Land use analyses using Maximum likelihood classifier indicate
that 46.69% is agricultural land, 42.33% is wasteland (barren land), 4.62% is built up, 3.07%
plantation, 2.77% natural forest and 0.53% water bodies. Overlaying district layer with taluk
boundaries on the classified district image, talukwise land use details were obtained. Table 1
shows land use details of Kolar district and corresponding percentage share is given in Table 2.
Table 1: Land use details of Kolar district
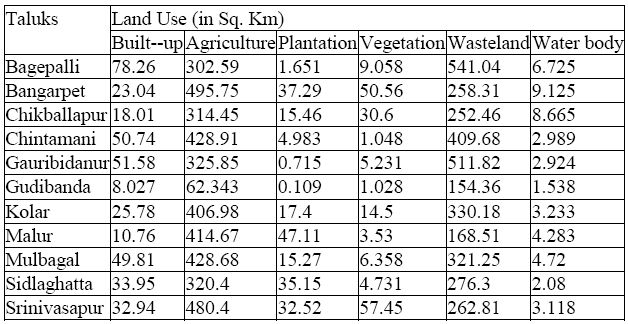
Table 2: Talukwise percentage share of land use
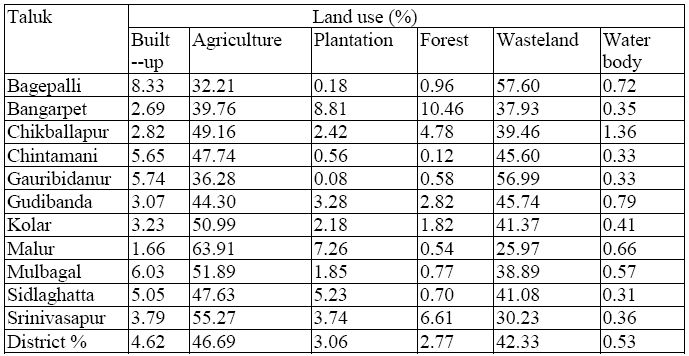
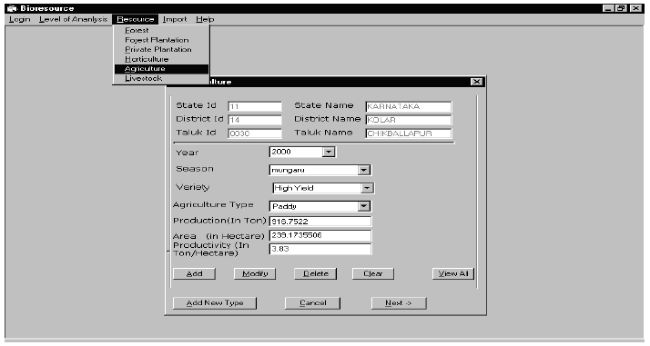
Figure 7 shows data entry of agriculture bioresource for the selected taluk (Chikballapur),
district (Kolar) and State (Karnataka). User is provided with options to append, edit and delete
agriculture resource details. For appending user has to provide year, season and crop type,
production, and area details. A new agriculture crop type, if not present in the database, can be
appended with an add/append option. There are options to calculate vegetation cover
percentage, productivity and energy equivalent for appended and existing data of a selected
taluk. Aggregation of bioresources from various sources (forests, agriculture, horticulture,
plantations, animal residues, etc.) represents the bioresource availability.
Figure 7: Land use analysis--agriculture bio--resource for Chikballapur taluk
The ratio of availability to the demand (bioresources) gives an idea of its status in a region.
Ratio less than one gives the scarcity of bioresource in that region. The demand was calculated
by considering the per capita consumption as 1.3 kg/person/day. Analysis shows that
bioresource status in Srinivasapur taluk is higher compared to all other taluks in Kolar district.
Table 3 gives the bioresource status talukwise for Kolar district.
Bioresource status ratio (resource to demand) showed that more than 95% villages have very
less value (0--0.2), while very few villages have average value (>0.6).
Table 3: Talukwise bioresource status for Kolar district

Based on bioresource availability and demand, Kolar can be categorized as bioresource deficit
district. Kolar depends mainly on non--commercial forms of energy. Non commercial energy
constitutes 84%, met mainly by sources like firewood, agricultural residues and cow dung,
while commercial energy share is 16%, met mainly by electricity, oil etc.
Plantation and forest area is very less in Kolar district, which causes scarcity of bioresource,
specially fuel wood and imbalance of environment. To maintain the environmental balance and
to meet the bioresource demand there should be tree plantations in waste lands and some
alternative energy source should be found for cooking need.
Availability of animal residues for biogas generation gives a viable alternative for cooking and
lighting fuel and fertiliser. However, to support the present livestock population fodder from
agricultural residues is insufficient in this district. Various alternatives such as fuel--efficient
stoves, biogas and energy plantations are proposed for improved utilisation of bio resources and
to enhance bioresource. Also renewable energy sources such as solar could be viable
alternatives for cooking and lighting.
The bioresource potential (from forests, plantations, agriculture, horticulture and animal
residues) and demand (domestic, agriculture, industry, etc.) were computed across the agro--
climatic zones for Karnataka. Bioresource status computed for various zones shows that the
value ranges from 0.23 to 3.8. Bioresource status in north eastern dry zone is 0.23, 0.48 in north
eastern transition zone, 0.58 in northern dry zone, 0.46 in northern transition zone, 1.4 in
central dry zone, 0.4 in eastern dry zone, 0.93 in southern dry zone, 3.12 in southern transition
zone, 3.79 in hilly zone and 3.4 in coastal zone. These values reveal that among the ten agro--
climatic zones, the central dry zone, the southern transition zone, hilly zone and the coastal
zone are bioresource surplus, while the north eastern transition zone, north eastern dry zone,
northern dry zone, eastern dry zone, southern dry zone and northern transition zone are biomass
deficient zones. |