Methodology
The DSS of biomass energy assessment (figure 1) provides an user friendly Graphic User
Interface (GUI), developed using Microsoft Visual Basic 6.0 as frontend with Microsoft Access
database as backend. This GUI Environment helps in entry, edit or update of database along
with the options to compute biomass energy potential spatially. Various sub--modules are
Database, Database Management System (DBMS), GIS, level of analysis, land cover analysis,
land use analysis, productivity, power and energy, and forecasting.
Figure 1: Design of Decision support system for Bioresource assessment
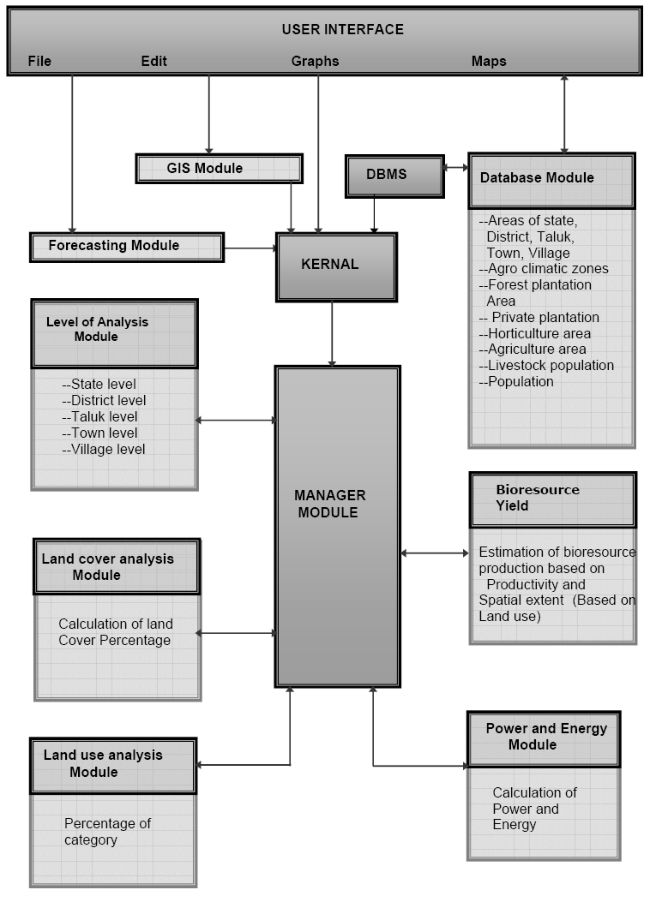
- Database module helps in compilation of the data required for bioresource
energy assessment. The data collected from secondary sources (Government
offices, etc.) as well as primary (field measurements) are stored in the
database. Data entry, Retrieval and Edit are the options provided in the
module. Data redundancy is minimized through normalized data tables.
- GIS module with GRAM++ (Spatial analysis software developed by Indian
Institute of Technology, Mumbai) provides the user with capabilities such as
spatial and temporal analysis, querying and visualisation. The flexibility to
enrich the database with spatial aspects helps to identify and quantify the local
constraints in the resource management.
- Level of analysis module helps in hierarchical data input and analysis--state,
district, taluk, village and town.
- Land cover analysis module calculates the extent of vegetation cover in a
region using remote sensing data. Land use module helps in mapping the
extent of different land use pattern (agriculture, forest, plantation, etc.) in a
region.
- Bioresource yield module computes sectorwise resource yield based on spatial
extent (forest, agriculture, plantation, etc.) and productivity.
- Energy module computes the available energy for the selected bioresource.
- Forecasting module helps in predicting the resource status considering various
scenarios.
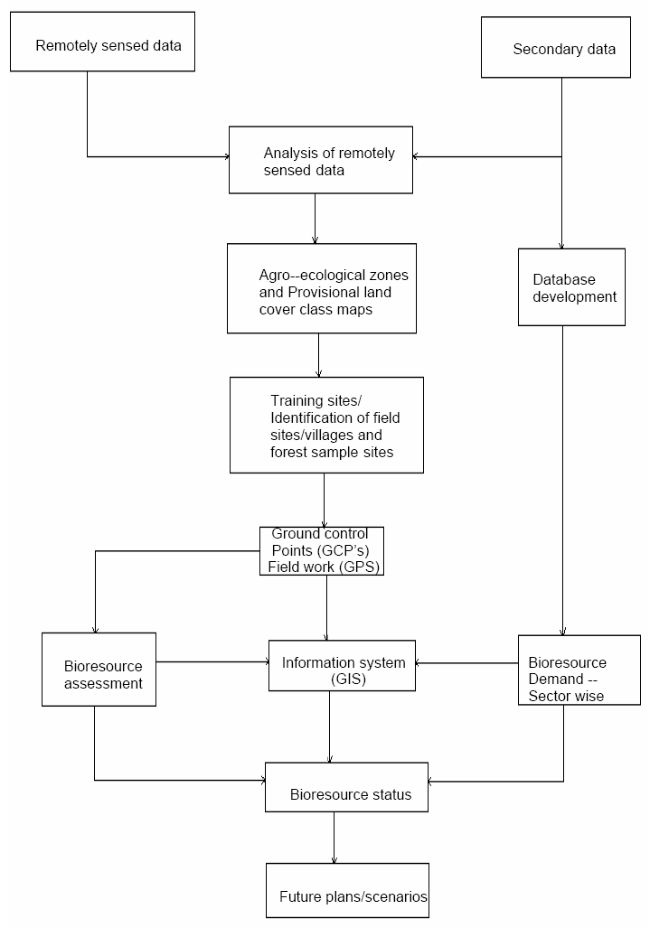
As a case study, the DSS was implemented for energy assessment using the data of
bioresources done at different--scale mapping of land use pattern in Kolar district. The data sets
needed to develop the bioresource database included village maps, Survey of India toposheets
(1:50000, 1:250000), satellite images (multispectral and panchromatic sensor data) and
information from field surveys (training data) using Global Positioning System (GPS). Figure 2
shows the methodology for assessment of regional bio--resources potential. Landuse analyses
were carried out using Geographical Information System (GIS), GPS and remotely sensed data
(IRS--1C) covering the district. GIS is used to map spatially the resource availability and
demand. It integrates common database operations, such as query and statistical analysis, with
the spatial data (maps). It helps to efficiently store, manipulate, analyse and display spatial data
according to the user specifications. GPS helps in collecting the ground data (spatial and
attribute data), which is required for interpreting the remote sensing data for land cover and
land use analyses.
Figure 2: Methodology for assessment of regional bio--resources potential
Land cover and land use analysis was based on IRS--1C (Indian Remote Sensing Satellite--1C)
LISS III and PAN (Panchromatic) data of November 2000 and November 2003. Spatial
resolution of LISS--III data in multi spectral bands (G, R and NIR bands) is 23.5 m and that of
PAN is 5.8 m. By merging LISS--III multispectral bands with PAN helps in determining the
spectral response patterns of vegetation at species level (or crop type). Merging helps in
retaining the spectral advantage of multispectral bands while taking advantage of PAN’s spatial
resolution. This helps in mapping bioresources at pixel levels (covering an area of few square
meters).
The methodology developed for landscape analyses (landscape classification) at disaggregated
levels provides an up--to--date land characteristic database and a model for further research.
Taluks located in northern part of Kolar (Gudibanda, Gauribidanur, Bagepalli and northern part
of Sidlaghatta) have lesser vegetation compared to southern part of the district. The landscape
of mixed vegetation is of deciduous and scrub species. Plantations of Eucalyptus and Acacia
auriculiformis are found in most parts compared to natural vegetation.
Land cover analysis was done with the computation of the vegetation indices namely NDVI
(Normalized Difference Vegetation Index) and TSAVI (Transformed Soil Adjusted Vegetation
Index) from the LISS--III bands (RED and NIR) of IRS--1C. This helps in identifying observed
physical cover--vegetation and non--vegetation. It roughly indicates the extent of the vegetation
cover in the region. NDVI is defined as
NDVI = (NIR-RED) / (NIR+RED) --------------------(1)
The index normalizes the difference between the bands so that the values range between -1 and
+1. The negative value represents non--vegetated area while positive value represents vegetated
area. Kolar district being in semi--arid region, vegetation cover is poor and sparsely spread.
Pixels (remote sensing data) contain a mixture of vegetation and soil background. Hence to
cancel the effect of soil brightness, Transformed Soil--adjusted Vegetation Indices (TSAVI1 and
TSAVI2) were computed. These indices are slightly less sensitive to changes in vegetation cover
than NDVI at low levels of vegetation cover. These indices are also more sensitive to
atmospheric variations than NDVI. TSAVI1 assumes that the soil line has arbitrary slope and
intercept and it makes use of these values to adjust the vegetation index and is written as:
TSAVI1= a (NIR-a *RED-b)/ (RED +a*NIR-a*b +X (1+a2)) -----------------(2)
Where, NIR: reflectance in near infrared band,
RED: reflectance in red band,
a: slope of the line,
b: intercept of the soil line,
X: adjustment factor that is set to minimize soil noise.
Red band is taken as independent variable for regression analysis. Ratio value less than -9.0 is
taken as non--vegetation while greater than -9.0 is taken as vegetation. With some resistance to
high soil moisture, TSAVI1 proves to be a very good candidate for use in semi--arid regions.
TSAVI1 was specifically designed for semi--arid region and does not work well in areas with
heavy vegetation. TSAVI2 is modified version of TSAVI which was readjusted with an additive
correction factor of 0.08 to minimize the effects of the background soil brightness and is given
by,
TSAVI2= a (NIR-a*RED-b)/ (RED +a*NIR-a*b+0.08(1+a2))-------------(3)
Land use analysis for Kolar district was done through supervised classification approach using
multi spectral data of IRS--1C. The Maximum likelihood classification method is found to be
more appropriate (based on confusion matrix analyses) compared to other classification
approaches.
Bioenergy status assessment was done taluk--wise and aggregated for the district. This is based
on compilation and computation of bioresource supply (forests, agriculture, plantations, etc.)
and sector--wise bioenergy requirement (domestic, agriculture, industry, etc.). Bioresource
supply from agriculture (residues), forest, horticulture, plantation and livestock is considered to
assess the energy status taluk wise. This data is compiled from the agriculture, horticulture,
forest and veterinary departments of the State apart from land use analyses using remote
sensing data. The talukwise potential is evaluated using maps of administrative boundaries
(taluk boundaries) along with remote sensing and statistical data.
Bioresource supply is based primarily on land use data, yield of various crop residues
(agriculture and horticulture) and plantation and forest biomass productivities. Data on the
historical land use pattern were collected from the Directorate of Economics and Statistics,
Government of Karnataka. The major source of information on forest lands is the Karnataka
Forest Department (KFD), which maintains a variety of records like the annual administration
reports, working plans, forest inventory reports, which gave information on the growing stock,
current status of the forests, the management practices adopted, plantations maintained and
their prescribed felling cycle. The inventory of forest resources published by the Forest Survey
of India was also referred [13]. The forest area by types, given division wise in the forest
records, was used to compute the forest type at the taluk level. The biomass potential of the
forests is dependent on the type of forest and its distribution.
Above ground standing biomass of trees is the weight of trees above ground, in a given area, if
harvested at a given time. The change in standing biomass over a period of time is called
productivity. The standing biomass helps to estimate the productivity of an area and also gives
information on the carrying capacity of land. It also helps in estimating the biomass that can be
continuously extracted. The standing biomass is measured using the harvest method or by using
the biomass estimation equations. In the harvest method, vegetation in the selected sample plots
is harvested and the weight is estimated in fresh and dry form to measure biomass. For trees,
this method is inappropriate, as it requires their felling or destructive sampling. However, this
could be computed by the knowledge of its height and girth (at 130 cm). Standing biomass (in
kg) is given by
Tree biomass = b + (a D2 H) ---------------(4)
Where D is the diameter at 130 cm, H is the height of the tree, a and b are constants. Equations
involving the basal area are used for all tree species and therefore are used to estimate the
standing biomass of mixed forests. Productivity, which is the increase in weight or volume of
any biomass over a period of time, can be estimated when the standing biomass estimates are
available for two consecutive years. It can also be calculated by knowing the age of the forest
stand in addition to the litter available annually. Productivity is equal to standing biomass per
hectare/age of a tree or the trees per forest stand. Using the low, high and average productivity
values, the annual biomass production from each forest type was computed at the taluk level.
Energy equivalent of 4000 kcal/kg was taken for ever green, semi--evergreen and moist--
deciduous forest types, while for the dry deciduous and scrub type vegetation 4800 kcal/kg and
3400 kcal/kg respectively were taken. Total bioenergy from forest (Bio1) is computed by:
Bio1 = Bioenergy from forests (kcal) = Forest area * Productivity * (Energy equivalent) ------ (5)
BEPA requires inputs such as forest types (i.e. Deciduous, Evergreen, etc.), respective spatial
extent, annual productivity (tonne/hectare) and energy equivalent (kcal/tonne). Outputs of the
DSS are annual bioenergy--forest type wise, regionwise, etc. (Note: Forest plantation inputs and
outputs are similar to forest).
Plantation inventory involves the assessment of spatial extent of plantation, annual
productivity, mean annual increment and cycling time. Based on an average productivity of 5
t/ha/year, the biomass production of plantations was calculated. The area of plantations raised
by the forest department under various schemes was obtained from the State forest department
and updated using latest remote sensing data (species wise extent). The details of plantations
raised on different sites like canal side, roadside, institutional premises, etc., available with the
forest department, were also used for computation. The biomass that could be obtained was
calculated assuming that 30% of them were adult plantations (30% of the land is planted and
also adult plantation about 30% is harvested annually by the forest department). Energy from
plantations (Bio2) is computed by
Bio2 = Bioenergy from plantations (kcal) = Area * Productivity * (Energy equivalent) -------- (6)
The area under the horticulture plantations at the taluk level was obtained from the State
horticulture department for the previous 4 years. The average yield figures of the district were
used to compute the production at the taluk level. For the computation of number of trees in the
given area, tree counts of 150/hectare and 800/hectare were assumed for Coconut and Arecanut
plantations.
BEPA requires input data such as crop type (i.e. Coconut, Arecanut etc.), spatial extent,
number of trees per hectare, residues (leaf, shell, husk) actual count, anticipated use percent,
conversion to weight (kg) and energy equivalent (kcal/kg), while output of the DSS is annual
energy--horticulture crop wise, regionwise, etc. Energy from horticulture (Bio3) is computed
by
Bio3 = Bioenergy from horticulture (kcal) = Area * Productivity * (Energy equivalent) -------- (7)
The taluk--wise agriculture area of the dominant crops cultivated in each taluk was collected
from the State agriculture department for the last 10 years. The yield of a crop (season and
variety wise) across an agroclimatic zone was obtained by averaging the yields of the previous
10 years. Crop yields were also verified considering the area sampling frame (ASF)
methodology. It involves the delineation of long-term sampling segments from satellite
imagery. These were then used as sampling frames for subsequent agricultural surveys. The
crop residues are surveyed during both the Kharif and Rabi season. Field sampling is carried
out within one week before harvest to ensure that crop yield and residue measurements are
related to fully mature crops.
Area under cultivation was not variety specific for a crop at the taluk level. The proportion of
the area under high yielding variety and the traditional variety of a crop at the district level was
used to segregate the area by variety at the taluk level. The grain yield and production figures
for each crop were available only at the district level, which were used to compute the grain
production at the taluk level.
The ratio of the main product to the by--product for each crop grown under local conditions
along with their energy equivalents was used to compute the agro residues production. The
energy equivalent of these residues was taken based on what would be obtained if they were
subjected to the most energy efficient transformation processes. Apart from this, the actual
availability of residues as energy supplements would also depend on other factors like efficiency
of collection, mode of transportation and storage. Considering these, in the computation of bio
residue from agriculture only 50% is accounted for fuel. Bioenergy from agriculture residues
(Bio4) is computed by:
Bio4 = Bioenergy from agriculture (kcal)
= (Productivity of waste * Crop area* Energy equivalent) -----------(8)
To compute bioenergy from agricultural crops, BEPA requires inputs such as crop type (i.e.
Cotton, Green grams, etc.), spatial extent, crop yield or productivity, residue to crop ratio,
energy equivalent (kcal/tonne), while outputs are annual energy--crop wise, regionwise, etc.
The livestock population of cattle, buffalo, sheep and goat was collected from the State
veterinary department. The field survey shows that quantity of dung yield varies from region to
region. It was taken as 12--15 kg/animal/day for buffalo, 3--7.5 kg/animal/day for cattle and 0.1
kg/animal/day for sheep and goat. The total dung produced annually was calculated by
multiplication of the animal dung production per year and the number of heads of different
animals taking the lower and higher dung yield. Assuming 0.036--0.042 m3 of biogas yield per
kg of cattle/buffalo dung, the total quantity of gas available was estimated. Total bioenergy
from livestock (Bio5) is computed by:
Bio5 =Bioenergy from livestock (kcal) = (Biogas * Energy Equivalent) -------------(9)
Where, Biogas (m3) = Biogas yield * Dung * 1000 and
Dung (tonnes) = Dung yield * Population * 365 (for annual energy computation).
Data input for BEPA to compute energy from livestock are livestock type (i.e. Buffalo, Cattle,
Goat, etc.); population, dung yield (kg/animal/day), biogas yield (m3/kg) and energy equivalent
(kcal/m3), and output would be biogas (m3) and annual energy.
Total bioenergy available from various sectors is computed by aggregating the energy
computed from individual sectors (forestry, plantation, horticulture, agriculture, livestock) and
is given by,
Where i=1, 2…5 and Bio1: Bioenergy from forest, Bio2: plantation, Bio3: horticulture, Bio4:
agriculture and Bio5: livestock.
Estimation of rural energy demand for domestic purposes was based on the State rural
population, which was obtained from the provisional population total, Census of India 2001,
Karnataka. Bioresource demand is the sector--wise bioenergy requirement that was computed
based on the statistics of earlier energy surveys from a sample of 3500 households covering
various agro--climatic zones in Karnataka. Energy--demand survey results reveal that 80--85%
of the rural population is dependent on bioenergy and hence the demand was projected taking
into account the entire rural population. Domestic fuel consumption depends on the size of the
family. Energy consumption patterns are seen to vary across geographical, agroclimatic zones,
seasons and the different economic strata of the society. Hence, analysis was done for agro--
climatic zones in Karnataka. Per Capita Fuel Consumption (PCFC) is computed to
- Determine the fuel consumption pattern in various agro-climatic zones,
- Find the various parameters involved in the variation and level of consumption,
- Estimate the daily per capita consumption of fuel wood in traditional and
improved stoves for cooking and water heating.
The per capita fuel consumption is given by
PCFC=FC/P ------------------------- (11)
Where FC is the fuel consumed in kg/day and P is the number of adult equivalents, for whom
the food was cooked. Standard adult equivalents of 1, 0.85 and 0.35 for male, female and
children (below 6 years) respectively, were used.
Bioresource demand for domestic activity in a region is given by,
Bioresource demand (domestic) = (average PCFC) * Population * 365 ----------------(12)
Where PCFC=Per Capita Fuelwood Consumption.
Bioresource Status for a particular region is computed by,
Bioresource Status = Bioenergy availability/ Bioresource demand (Domestic)---------(13) |