http://www.iisc.ernet.in/
Advanced Machine Learning Algorithms based Free and Open Source Packages for Landsat ETM+ Data Classification
http://wgbis.ces.iisc.ernet.in/energy/
Uttam Kumar1,2,3          Anindita Dasgupta1          Chiranjit Mukhopadhyay2           T.V. Ramachandra1,3,4,*
1Energy and Wetlands Research Group, Centre for Ecological Sciences [CES], 2Department of Management Studies, 3Centre for Sustainable Technologies (astra),
4Centre for infrastructure, Sustainable Transportation and Urban Planning [CiSTUP], Indian Institute of Science, Bangalore – 560012, India.
*Corresponding author:
cestvr@ces.iisc.ernet.in

RESULTS AND DISCUSSION

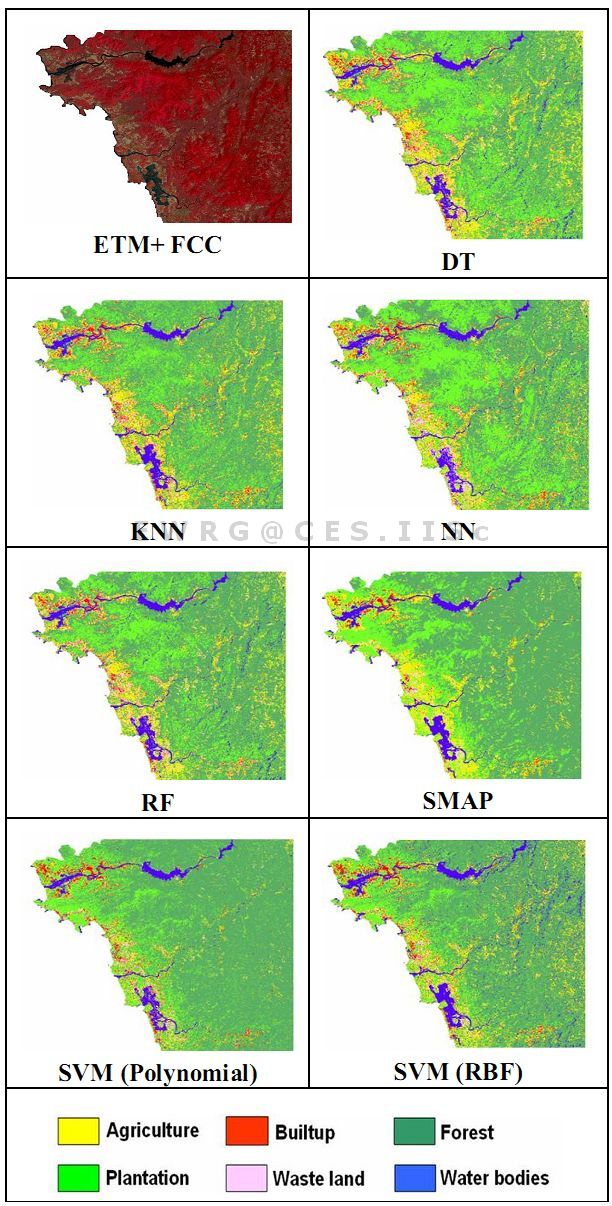
Seven classifications were carried out with Landsat ETM+ bands 1 to 5 and band 7 of 2000 x 2000 size (acquired on March 14, 2000) using training data collected from field and validated using separate test data into agriculture, builtup, forest, plantation, wasteland and water bodies that are the six major categories in the forested and mountainous terrain of Uttara Kannada district in Central Western Ghats (Fig. 1). Figure 2 shows the classified images and the LU statistics are listed in Table I. Accuracy assessment was done by generating error matrix; producer’s, user’s, overall accuracies and kappa were computed (Table II). The highest two overall accuracies are highlighted in bold.

Table 1. LU estimates from ETM+ using advanced classifiers

Classes → Agriculture Builtup Forest Plantation Wasteland Water bodies
Algorithms↓ ha % ha % ha % ha % ha % ha %
MLC 18824 5.80 6386 1.97 226695 69.88 54043 16.66 5322 1.64 13157 4.06
DT 51617 15.91 6398 1.97 158049 48.72 83446 25.72 9411 2.90 15502 4.78
KNN 48566 14.97 8663 2.67 195457 60.25 50793 15.66 7582 2.34 13361 4.12
NN 39075 12.04 8068 2.49 151979 46.85 97686 30.11 10609 3.27 17005 5.24
RF 41629 12.83 5732 1.77 194666 60.00 56483 17.41 10826 3.34 15121 4.66
SMAP 35992 11.09 4249 1.34 201454 62.01 64034 19.74 4953 1.53 13739 4.24
SVM (Poly) 19292 5.95 6385 1.97 226815 69.92 54024 16.65 5319 1.64 12548 3.87
SVM (RBF) 37680 11.62 6421 1.98 193195 59.56 54437 16.78 5319 1.64 27331 8.43
Total 324421.68 (ha) 100%

Table 2. Accuracy assessment for ETM+ classified data

Algorithm Class Producer’s Accuracy (%) User’s Accuracy (%) Overall Accuracy (%) Kappa
DT Agriculture 83.33 86.67 84.54 0.7946
Builtup 95.00 85.00
Forest 82.63 80.61
Plantation 85.75 80.00
Wasteland 85.00 84.00
Water bodies 83.33 83.21
           
KNN Agriculture 84.41 87.00 86.98 0.8314
Builtup 97.00 87.00
Forest 76.43 89.79
Plantation 87.45 86.67
Wasteland 87.00 89.00
Water bodies 87.00 85.00
           
NN Agriculture 83.33 70.00 74.98 0.7142
Builtup 85.00 82.00
Forest 62.63 60.61
Plantation 87.85 76.66
Wasteland 77.00 71.00
Water bodies 66.67 77.00
           
RF Agriculture 87.44 86.66 83.37 0.7505
Builtup 87.00 82.00
Forest 74.26 81.82
Plantation 82.57 84.73
Wasteland 82.00 79.00
Water bodies 90.91 82.00
           
SMAP Agriculture 85.48 86.66 89.03 0.8596
Builtup 98.00 99.00
Forest 80.65 87.76
Plantation 88.94 89.57
Wasteland 89.00 87.00
Water bodies 87.33 89.00
           
SVM (Polynomial) Agriculture 87.27 80.00 85.35 0.8324
Builtup 85.00 95.00
Forest 88.70 81.82
Plantation 81.66 85.47
Wasteland 85.00 87.00
Water bodies 85.55 81.67
           
SVM
(RBF)
Agriculture 76.25 83.33 83.77 0.7977
Builtup 80.00 93.00
Forest 80.85 80.91
Plantation 81.66 83.33
Wasteland 89.00 85.00
Water bodies 90.91 81.00

Landsat data having a spatial resolution of 30 m were classified most accurately using SMAP algorithm (89.03% overall accuracy as given in Table I). SMAP takes into account the intra class spectral variations and exploits spatial information among neighbouring pixels to improve classification results [17]. NN was difficult to train before it reached convergence as evident from the training RMS plot (not shown here). The area covered by this image has forested landscape, dominated by evergreen and semi-evergreen flora. Plantation was overestimated in DT and NN which had 4 hidden layers with 0.2 learning rate and 0.2 momentum with 20000 epochs, took 77 seconds to train. A second degree polynomial function with gamma as 0.167 was used in SVM (Poly), which gave lower accuracies in detecting water bodies in comparison to other seven techniques. DT, NN, RF and SVM (RBF) showed abnormal trends and have classified mountain ridges as narrow water channels (Fig. 2).


Figure 2. Classification of ETM+ Plus data through advanced classification algorithms.

Wasteland are often mixed with fallow land due to seasonal differences in crop practices, and also reflect similar to sand on the sea shores/sea beaches (Arabian sea on the west portion in the image), which were prominent in DT classification as depicted in Fig. 2. The above reported results are obtained with certain parameter settings and may not result in similar output when the parameters are altered or adjusted. At a regional scale, medium spatial resolutions such as Landsat TM/ETM+, Terra ASTER are most frequently used data. Eva et al., (2010) [18] demonstrates the usage of medium spatial resolution satellite imagery (Landsat-5 TM and SPOT-HRV) for monitoring forest areas from continental to territorial levels. Uncertainties involved in different stages of classification procedures influence classification accuracy, as well as the area estimation under different land use and land cover classes [19]. Understanding the relationships between the classification stages, identifying the probable factors that influence the accuracy and improving them are essential for successful image classification.

BACK   «   TOP   »   NEXT
Citation :Uttam Kumar, Anindita Dasgupta, Chiranjit Mukhopadhyay and Ramachandra. T.V., 2012, Advanced Machine Learning Algorithms based Free and Open Source Packages for Landsat ETM+ Data Classification., Proceedings of the OSGEO-India: FOSS4G 2012- First National Conference "OPEN SOURCE GEOSPATIAL RESOURCES TO SPEARHEAD DEVELOPMENT AND GROWTH” 25-27th October 2012, @ IIIT Hyderabad , pp. 1-7.
* Corresponding Author :
Dr. T.V. Ramachandra
Energy & Wetlands Research Group, Centre for Ecological Sciences, Indian Institute of Science, Bangalore – 560 012, India.
Tel : +91-80-2293 3099/2293 3503-extn 107,      Fax : 91-80-23601428 / 23600085 / 23600683 [CES-TVR]
E-mail : cestvr@ces.iisc.ernet.in, energy@ces.iisc.ernet.in,     Web : http://wgbis.ces.iisc.ernet.in/energy, http://ces.iisc.ernet.in/grass
E-mail    |    Sahyadri    |    ENVIS    |    GRASS    |    Energy    |      CES      |      CST      |    CiSTUP    |      IISc      |    E-mail