|
RESULTS AND DISCUSSION
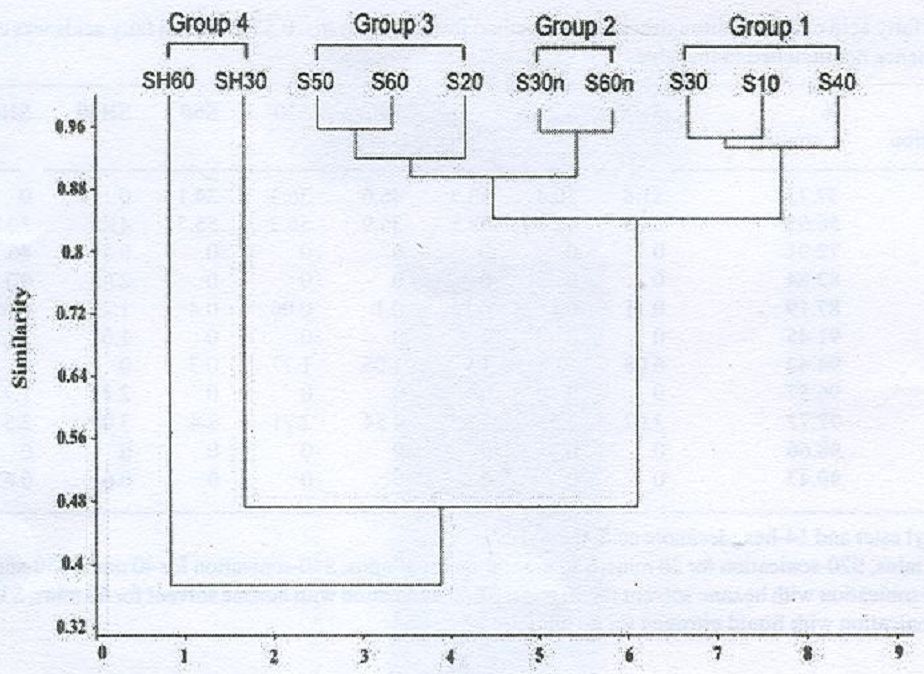
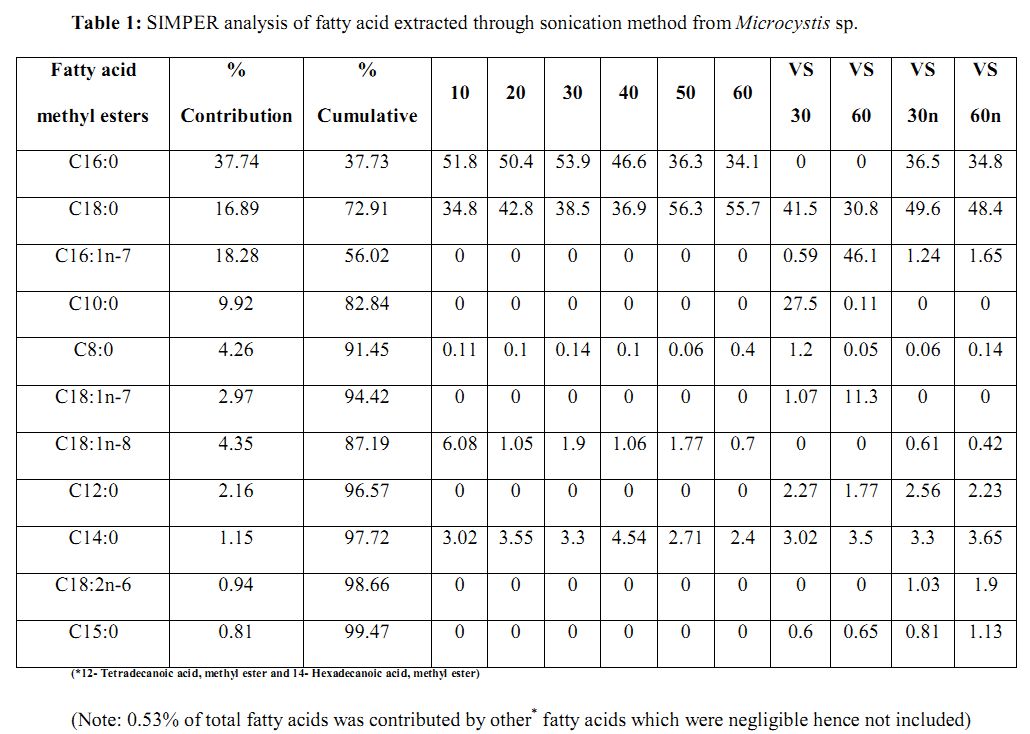
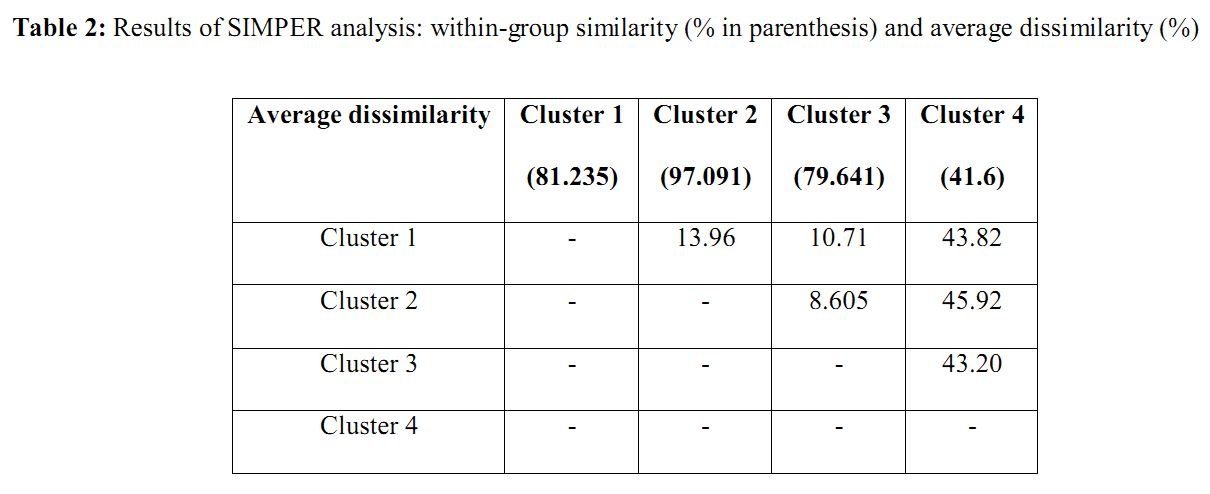
- Sonication: Cell disruptions based on sonication methods showed overall average inter dissimilarity of 30.2% through SIMPER analysis of the fatty acid composition. The principal fatty acids C16:0, C18:0 and C16:1n-7 contributed at least 50% of the fatty acid methyl esters in all the methods (Table 1). High percentage dissimilarity was found in the fatty acids C16:0, C18:0 and C16:1n-7 with highest mean abundance of 53.9% being in the sonication method subjected for 30 minutes for fatty acid C16:0, 55.7% in the sonication method subjected for 60 minutes for C18:0 and 46.1% in the sonication method subjected for 60 minutes with hexane solvent for C16:1n-7. The hierarchical cluster analysis separated the methods into 4 clusters viz., cluster 1 consisting of S10, S30 and S40; cluster 2 consisting of S30n and S60n; cluster 3 consisting of S50, S60 and S20 and cluster 4 consisting of SH60 and SH30 based on the composition of fatty acids (Figure 1). SIMPER analysis showed these groupings had high within group similarities (Table 2). The fatty acids C16:0, C18:0 were dominant to form a single cluster of 10, 30 and 40 methods. The results show that sonication for a period of 60 minutes (60) and sonication for a period of 60 minutes with hexane solvent (SH60) contributes more amounts of fatty acids (Table 1).
Table 1: SIMPER analysis of fatty acid extracted through sonication method from Microcystis sp.
| Fatty acid methyl esters |
%Contribution |
% Cumulative |
10 |
20 |
30 |
40 |
50 |
60 |
VS 30 |
VS 60 |
VS 30n |
VS 60n |
| C16:0 |
37.74 |
37.73 |
51.8 |
50.4 |
53.9 |
46.6 |
36.3 |
34.1 |
0 |
0 |
36.5 |
34.8 |
| C18:0 |
16.89 |
72.91 |
34.8 |
42.8 |
38.5 |
36.9 |
56.3 |
55.7 |
41.5 |
30.8 |
49.6 |
48.4 |
| C16:1n-7 |
18.28 |
56.02 |
0 |
0 |
0 |
0 |
0 |
0 |
0.59 |
46.1 |
1.24 |
1.65 |
| C10:0 |
9.92 |
82.84 |
0 |
0 |
0 |
0 |
0 |
0 |
27.5 |
0.11 |
0 |
0 |
| C8:0 |
4.26 |
91.45 |
0.11 |
0.1 |
0.14 |
0.1 |
0.06 |
0.4 |
1.2 |
0.05 |
0.06 |
0.14 |
| C18:1n-7 |
2.97 |
94.42 |
0 |
0 |
0 |
0 |
0 |
0 |
1.07 |
11.3 |
0 |
0 |
| C18:1n-8 |
4.35 |
87.19 |
6.08 |
1.05 |
1.9 |
1.06 |
1.77 |
0.7 |
0 |
0 |
0.61 |
0.42 |
| C12:0 |
2.16 |
96.57 |
0 |
0 |
0 |
0 |
0 |
0 |
2.27 |
1.77 |
2.56 |
2.23 |
| C14:0 |
1.15 |
97.72 |
3.02 |
3.55 |
3.3 |
4.54 |
2.71 |
2.4 |
3.02 |
3.5 |
3.3 |
3.65 |
| C18:2n-6 |
0.94 |
98.66 |
0 |
0 |
0 |
0 |
0 |
0 |
0 |
0 |
1.03 |
1.9 |
| C15:0 |
0.81 |
99.47 |
0 |
0 |
0 |
0 |
0 |
0 |
0.6 |
0.65 |
0.81 |
1.13 |
(*12- Tetradecanoic acid, methyl ester and 14- Hexadecanoic acid, methyl ester)
(Note: 0.53% of total fatty acids was contributed by other* fatty acids which were negligible hence not included)
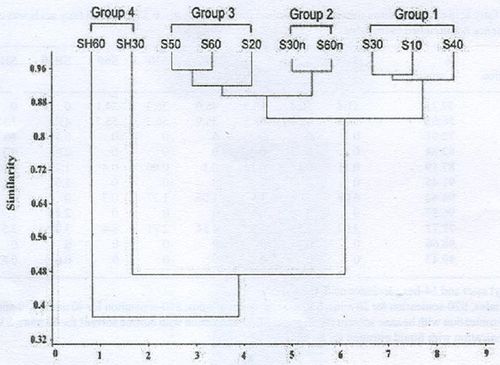
Figure 1: Hierarchical cluster analysis of fatty acid composition (%) of the triacylglycerol extracted through sonication method from Microcystis sp.
Table 2: Results of SIMPER analysis: within-group similarity (% in parenthesis) and average dissimilarity (%)
| Average dissimilarity |
Cluster 1
(81.235) |
Cluster 2
(97.091) |
Cluster 3
(79.641) |
Cluster 4
(41.6) |
| Cluster 1 |
- |
13.96 |
10.71 |
43.82 |
| Cluster 2 |
- |
- |
8.605 |
45.92 |
| Cluster 3 |
- |
- |
- |
43.20 |
| Cluster 4 |
- |
- |
- |
- |
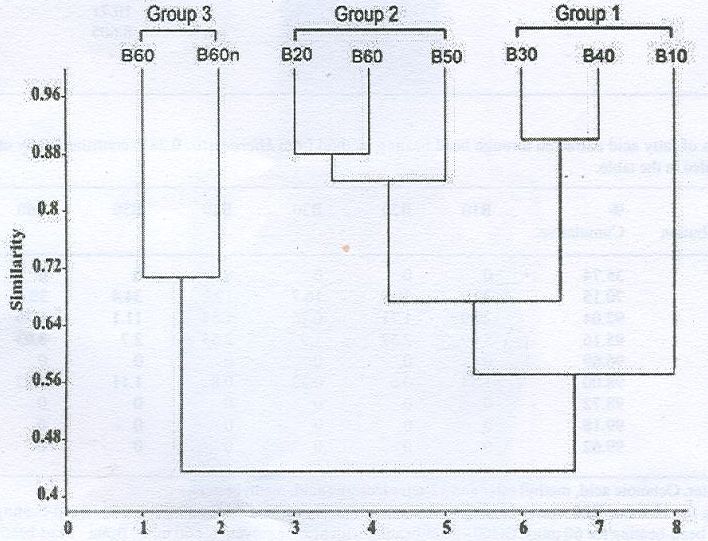
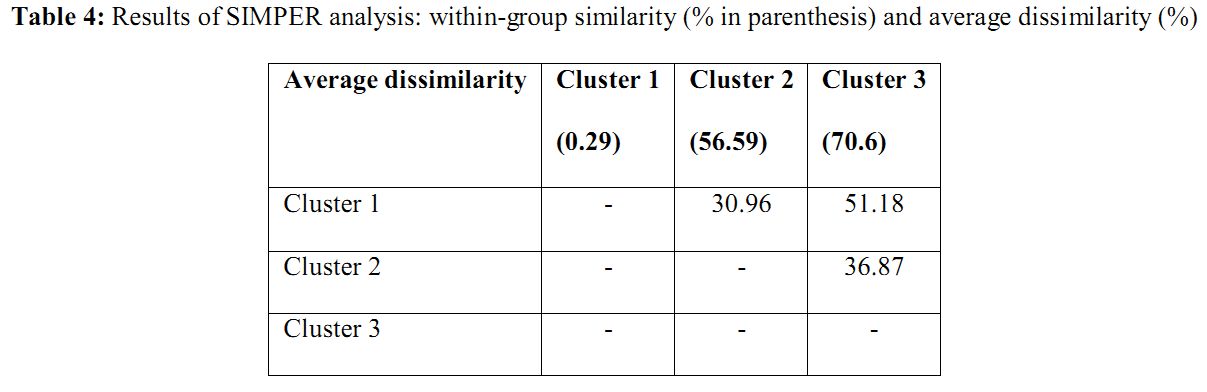
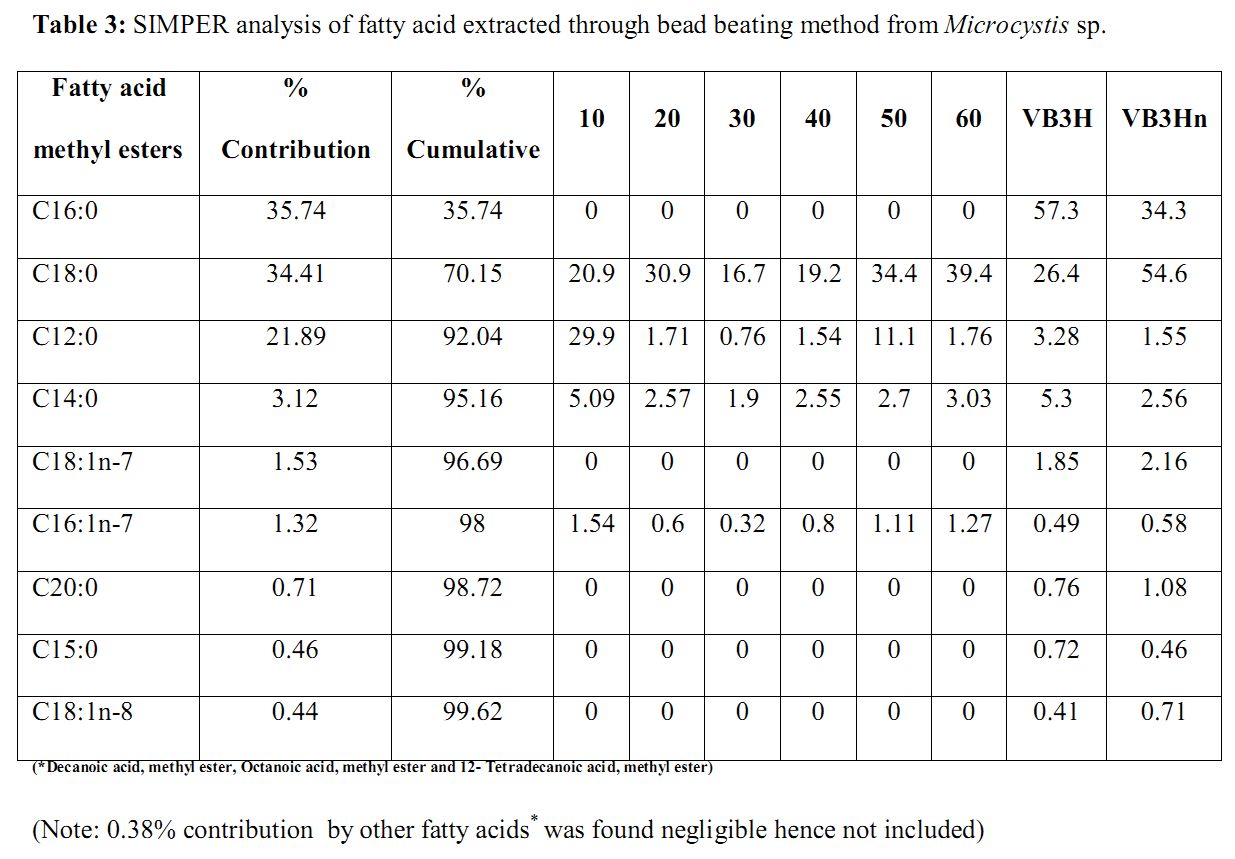
- Bead-beating: An overall average dissimilarity of 41.88% was observed within the bead beating disruption methods through SIMPER analysis. C16:0, C18:0 and C12:0 were the principal fatty acids contributing at least 50% of the difference between the fatty acid methyl esters in all the methods. High percentage dissimilarity was found in the fatty acids C16:0 and C18:0 with highest mean abundance for the former fatty acid of 57.3% being in the bead beating method with hexane solvent subjected for 60 minutes and the latter having 54.6% in the bead beating method with hexane solvent and liq. nitrogen subjected for 60 minutes. The hierarchical cluster analysis separated the methods into 3 clusters viz., cluster 1 consisting of B10, B30 and B40; cluster 2 consisting of B20, B60 and B50 and cluster 3 consisting of BH60 and BH60n based on the composition of fatty acids (Figure 2). SIMPER analysis showed these groupings had within group similarities except for cluster 1 (Table 4). The fatty acids C18:0 was dominant to form a single cluster of B30 and B40; C18:0 (<30.00%) was dominant to form a cluster of B20, B50 and B60 and C16:0, C18:0 was dominant to form a separate cluster of BH60 and BH60n. The results show that bead beating for 60 minutes of hexane solvent (BH60) and hexane solvent with liq. nitrogen for a period of 60 minutes (BH60n) contributes more amounts of fatty acids (Table 3).
Table 3: SIMPER analysis of fatty acid extracted through bead beating method from Microcystis sp.
| Fatty acid methyl esters |
% Contribution |
% Cumulative |
10 |
20 |
30 |
40 |
50 |
60 |
VB3H |
VB3Hn |
| C16:0 |
35.74 |
35.74 |
0 |
0 |
0 |
0 |
0 |
0 |
57.3 |
34.3 |
| C18:0 |
34.41 |
70.15 |
20.9 |
30.9 |
16.7 |
19.2 |
34.4 |
39.4 |
26.4 |
54.6 |
| C12:0 |
21.89 |
92.04 |
29.9 |
1.71 |
0.76 |
1.54 |
11.1 |
1.76 |
3.28 |
1.55 |
| C14:0 |
3.12 |
95.16 |
5.09 |
2.57 |
1.9 |
2.55 |
2.7 |
3.03 |
5.3 |
2.56 |
| C18:1n-7 |
1.53 |
96.69 |
0 |
0 |
0 |
0 |
0 |
0 |
1.85 |
2.16 |
| C16:1n-7 |
1.32 |
98 |
1.54 |
0.6 |
0.32 |
0.8 |
1.11 |
1.27 |
0.49 |
0.58 |
| C20:0 |
0.71 |
98.72 |
0 |
0 |
0 |
0 |
0 |
0 |
0.76 |
1.08 |
| C15:0 |
0.46 |
99.18 |
0 |
0 |
0 |
0 |
0 |
0 |
0.72 |
0.46 |
| C18:1n-8 |
0.44 |
99.62 |
0 |
0 |
0 |
0 |
0 |
0 |
0.41 |
0.71 |
(*Decanoic acid, methyl ester, Octanoic acid, methyl ester and 12- Tetradecanoic acid, methyl ester)
(Note: 0.38% contribution by other fatty acids* was found negligible hence not included)
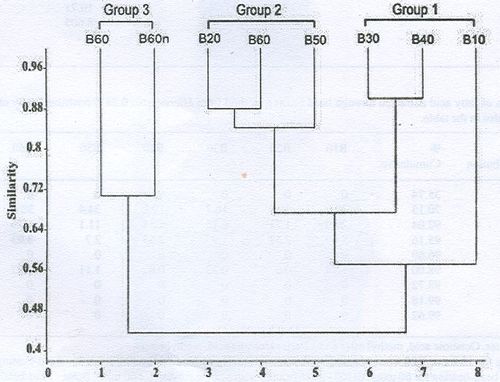
Figure 2: Hierarchical cluster analysis of fatty acid composition (%) of the triacylglycerol extracted through bead beating method from Microcystis sp.
Table 4: Results of SIMPER analysis: within-group similarity (% in parenthesis) and average dissimilarity (%)
| Average dissimilarity |
Cluster 1
(0.29) |
Cluster 2
(56.59) |
Cluster 3
(70.6) |
| Cluster 1 |
- |
30.96 |
51.18 |
| Cluster 2 |
- |
- |
36.87 |
| Cluster 3 |
- |
- |
- |
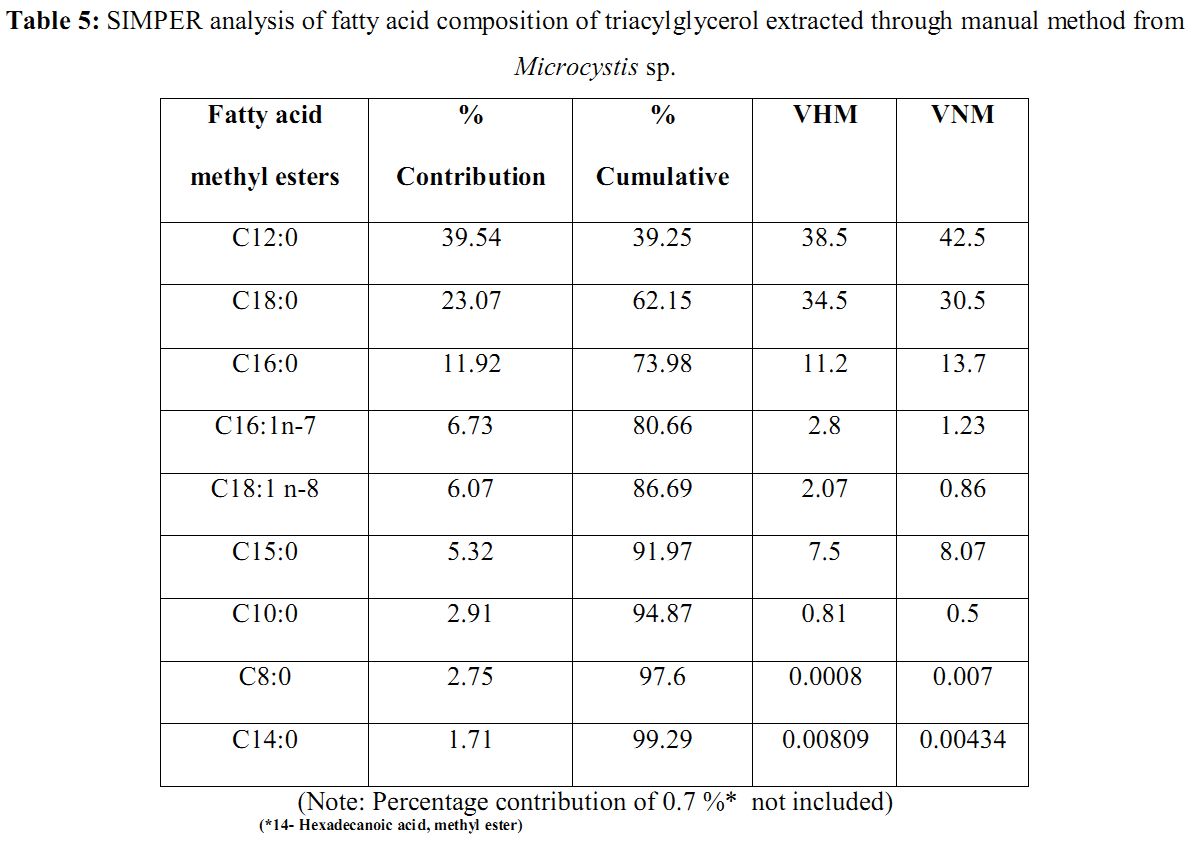
- Manual disruption: The differences between the amounts of fatty acid compositions obtained by manual methods were less than 3% for any fatty acid. The analysis of variance (one way ANOVA) showed that the differences were not statistically significant for any fatty acid (P> 0.05). An overall average dissimilarity of 11.21 % was observed within the manual method through SIMPER analysis where, C12:0, C18:0 and C16:0 contributed at least 50 % of the difference between the fatty acid methyl esters in all the methods. High percentage dissimilarity was found in the fatty acids C12:0 and C18:0 with highest mean abundance for the former fatty acid of 42.5 % being in the manual method subjected for 60 minutes with hexane solvent and liq. nitrogen and the latter having 38.5 % in the manual method subjected for 60 minutes with hexane solvent (Table 5). Method MH60 recovered slightly greater quantities of almost all identified fatty acids (Table 5).
Table 5: SIMPER analysis of fatty acid composition of triacylglycerol extracted through manual method from Microcystis sp.
| Fatty acid methyl esters |
% Contribution |
% Cumulative |
VHM |
VNM |
| C12:0 |
39.54 |
39.25 |
38.5 |
42.5 |
| C18:0 |
23.07 |
62.15 |
34.5 |
30.5 |
| C16:0 |
11.92 |
73.98 |
11.2 |
13.7 |
| C16:1n-7 |
6.73 |
80.66 |
2.8 |
1.23 |
| C18:1 n-8 |
6.07 |
86.69 |
2.07 |
0.86 |
| C15:0 |
5.32 |
91.97 |
7.5 |
8.07 |
| C10:0 |
2.91 |
94.87 |
0.81 |
0.5 |
| C8:0 |
2.75 |
97.6 |
0.0008 |
0.007 |
| C14:0 |
1.71 |
99.29 |
0.00809 |
0.00434 |
(Note: Percentage contribution of 0.7 %* not included)
(*14- Hexadecanoic acid, methyl ester)
Optimal cell disruption technique
Sonication and bead beating methods are efficient for the extraction of Microcystis sp. as the manual method is complicated, time-consuming and difficult to scale up. Comparison of bead beating and sonication methods for lipid extraction, show that sonication is the most efficient method due to cavitation effects (Lee et al. 1998, Engler 1985). Lee et al. 1998 has demonstrated higher lipid content from Botryococcus braunii through bead-beating method. However, efficiency of the bead-beating method is not easy to scale-up (Lee et al. 2010).. Even though sonication with liquid nitrogen is as efficient as in the absence of liquid nitrogen, the latter method can be optimized as liquid nitrogen is dangerous to handle. Hence, this study confirms that, the sonication method was the most simple, easy, and efficient method for the tested microalgae. In conclusion, the sonication method for 60 minutes was found to be the most applicable for large-scale lipid extraction from a microalgal biomass.
Fatty acid composition: The major fatty acid composition of the tested microalgae Microcystis sp. for all the methods was determined using GC-MS (Table 1; Table 3 and Table 5). In the three methods tested, palmitic acid (C16:0) and stearic acid (C18:0) were commonly dominant. Palmitic acid was higher (53.89%) in the sonication method for 30 minutes, while stearic acid was highest (56.27%) in the sonication method for 60 minutes, further supporting that sonication for 60 minutes can be used as an effective method for disruption of microalgae and hence extraction of lipids. Palmitic, stearic, oleic, and linolenic acid were observed as the most common fatty acids contained in biodiesel (Knothe 2008).
|
