|
RESULTS
Figure 4 shows the LU maps derived from the classification of remote sensing data. Table 2 and 3 depicts the area of the various LU types in ha and percentages. The results reveal that evergreen forests are dominating in sub basin 2, 3, 4, 5, 9 and 10 while sub basin 6, 7 and 8 have more than 70% of the LC as evergreen forest. Water class is dominating in sub basin 4 and 8 with 14.62 and 7.25% respectively. Semi-evergreen is majorly present in sub basin 2, 6, 7 and 10 while sub basin 3 has major semi-evergreen cover of 31.18%. Agriculture class is present in subbasin1 and subbasin9 as 47.54% and 13.93%.
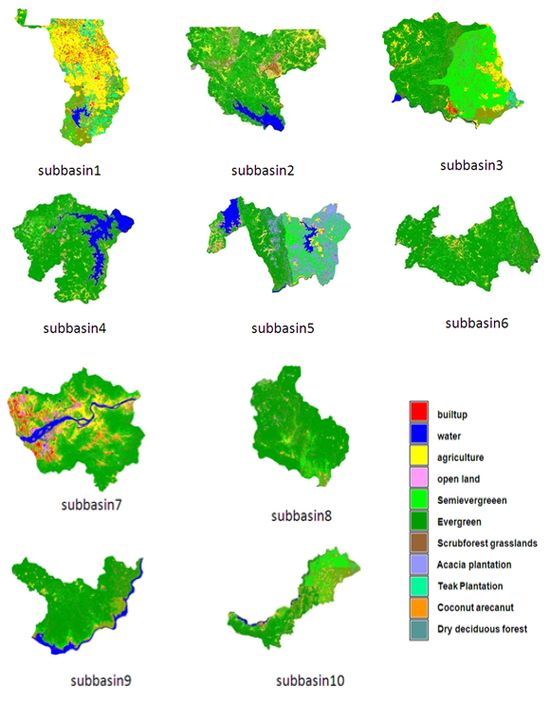
Figure 4: LULC of the 10 kali subbasins
Table 2: LULC in hectares (area) of the 10 subbasins
Class |
Area in hectares |
| Sb1 |
Sb2 |
Sb3 |
Sb4 |
Sb5 |
Sb6 |
Sb7 |
Sb8 |
Sb9 |
Sb10 |
| Builtup |
4736.53 |
366.44 |
473.45 |
57.68 |
129.26 |
80.12 |
24.56 |
92.68 |
1589.61 |
226.54 |
| Water |
1943.27 |
3332.50 |
389.98 |
4288.84 |
3301.63 |
40.73 |
6.69 |
2687.41 |
1672.85 |
977.97 |
| Agriculture |
39216.35 |
6959.04 |
3235.04 |
939.15 |
2047.27 |
1375.29 |
187.11 |
692.01 |
4831.72 |
2525.10 |
| Open land |
1346.86 |
3397.94 |
249.81 |
974.01 |
350.85 |
483.29 |
295.00 |
379.54 |
2133.25 |
602.54 |
| Semi evergreen |
2795.36 |
10215.23 |
13591.5 |
2721.57 |
8143.19 |
2863.30 |
1648.00 |
2598.08 |
4296.36 |
10489.95 |
| Evergreen |
4109.08 |
28142.97 |
16154.24 |
17896.36 |
12039.49 |
34044.09 |
13539.09 |
27102.22 |
15476.34 |
17242.58 |
| Scrubforest grasslands |
2405.83 |
5318.92 |
1484.98 |
955.43 |
2502.32 |
1071.65 |
580.51 |
746.99 |
615.03 |
3225.89 |
| Acacia plantation |
12590.66 |
3573.13 |
5930.26 |
1156.64 |
11752.39 |
1953.88 |
903.51 |
1690.49 |
1758.70 |
9047.17 |
| Teak Plantation |
11039.54 |
- |
1215.12 |
- |
2278.18 |
134.41 |
- |
94.02 |
- |
1593.29 |
| Coconut arecanut |
836.00 |
392.35 |
740.61 |
339.78 |
586.63 |
813.70 |
165.77 |
1001.31 |
2319.98 |
1862.14 |
| Dry deciduous forest |
1469.78 |
- |
129.02 |
- |
5.94 |
- |
- |
- |
- |
- |
| Total |
82489.25 |
61698.51 |
43593.99 |
29329.47 |
43137.15 |
42860.49 |
17350.26 |
37084.74 |
34693.84 |
47793.19 |
Table 3: Percentage cover of LULC of the 10 subbasins
Class |
Percentage cover |
| Sb1 |
Sb2 |
Sb3 |
Sb4 |
Sb5 |
Sb6 |
Sb7 |
Sb8 |
Sb9 |
Sb10 |
| Builtup |
5.74 |
0.59 |
1.09 |
0.2 |
0.3 |
0.19 |
0.14 |
0.25 |
4.58 |
0.47 |
| Water |
2.36 |
5.4 |
0.89 |
14.62 |
7.65 |
0.1 |
0.04 |
7.25 |
4.82 |
2.05 |
| Agriculture |
47.54 |
11.28 |
7.42 |
3.2 |
4.75 |
3.21 |
1.08 |
1.87 |
13.93 |
5.28 |
| Open land |
1.63 |
5.51 |
0.57 |
3.32 |
0.81 |
1.13 |
1.7 |
1.02 |
6.15 |
1.26 |
| Semievergreeen |
3.39 |
16.56 |
31.18 |
9.28 |
18.88 |
6.68 |
9.5 |
7.01 |
12.38 |
21.95 |
| Evergreen |
4.98 |
45.61 |
37.06 |
61.02 |
27.91 |
79.43 |
78.03 |
73.08 |
44.61 |
36.08 |
| Scrubforest_grasslands |
2.92 |
8.62 |
3.41 |
3.26 |
5.8 |
2.5 |
3.35 |
2.01 |
1.77 |
6.75 |
| Acacia plantation |
15.26 |
5.79 |
13.6 |
3.94 |
27.24 |
4.56 |
5.21 |
4.56 |
5.07 |
18.93 |
| Teak Plantation |
13.38 |
- |
2.79 |
1.16 |
5.28 |
0.31 |
- |
0.25 |
- |
3.33 |
| Coconut_arecanut |
1.01 |
0.64 |
1.7 |
- |
1.36 |
1.9 |
0.96 |
2.7 |
6.69 |
3.9 |
| Dry deciduous forest |
1.78 |
- |
0.3 |
- |
0.01 |
- |
- |
- |
- |
- |
| Total |
100 |
100 |
100 |
100 |
100 |
100 |
100 |
100 |
100 |
100 |
Figure 5 shows the forest fragmentation maps of the 10 sub basins in Kali river. The statistics are given in Table 3 and 4 (in ha and percentages). Subbasin1 has edge forest as the most dominating class (34.36%) while in all other sub basins the interior forest is the most dominating class. Sub basin 6, 7 and 8 consists of more than 80% of interior forest.
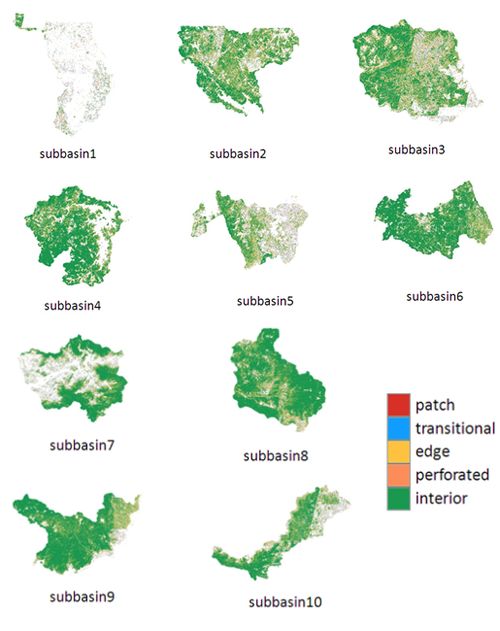
Figure 5: Forest Fragmentation of the 10 kali subbasins.
Table 3: Forest Fragmentation in hectares of the Kali subbasins
| Class |
Area in hectares |
| Sb1 |
Sb2 |
Sb3 |
Sb4 |
Sb5 |
Sb6 |
Sb7 |
Sb8 |
Sb9 |
Sb10 |
| Patch |
1810.8 |
456.43 |
570.3 |
140 |
1301.5 |
218.3 |
63.3 |
199.1 |
565.8 |
784.0 |
| Transitional |
2559.8 |
1983.6 |
1956.6 |
570.4 |
2556.8 |
817 |
313.5 |
617.1 |
1433.4 |
1723.8 |
| Edge |
3654.2 |
12672 |
9420.3 |
3784.3 |
8069.2 |
6244 |
2534.9 |
4990 |
4306.8 |
8550.6 |
| Perforated |
335.3 |
594.19 |
464 |
162.3 |
511.7 |
241 |
89.9 |
159 |
223.8 |
373.8 |
| Interior |
2275.4 |
27821 |
18844 |
16814.3 |
10374.3 |
30427 |
12726.5 |
24451.7 |
13937.4 |
23094.0 |
| Total |
10636 |
43528 |
31255 |
21471.4 |
22813.4 |
37946 |
15728.2 |
30416.4 |
20467.1 |
34526.2 |
Table 4: Forest Fragmentation in percentage of Kali subbasins
| Class |
Percentage cover |
| Sb1 |
Sb2 |
Sb3 |
Sb4 |
Sb5 |
Sb6 |
Sb7 |
Sb8 |
Sb9 |
Sb10 |
| Patch |
17.03 |
1.05 |
1.82 |
0.65 |
5.7 |
0.58 |
0.4 |
0.65 |
2.76 |
2.27 |
| Transitional |
24.07 |
4.56 |
6.26 |
2.66 |
11.21 |
2.15 |
2.11 |
2.03 |
7 |
4.99 |
| Edge |
34.36 |
29.11 |
30.14 |
17.62 |
35.37 |
16.45 |
16.02 |
16.41 |
21.04 |
24.77 |
| Perforated |
3.15 |
1.37 |
1.48 |
0.76 |
2.24 |
0.63 |
0.57 |
0.52 |
1.09 |
1.08 |
| Interior |
21.39 |
63.92 |
60.29 |
78.31 |
45.47 |
80.18 |
80.87 |
80.39 |
68.1 |
66.89 |
| Total |
100 |
100 |
100 |
100 |
100 |
100 |
100 |
100 |
100 |
100 |
RAINFALL DATA ANALYSIS
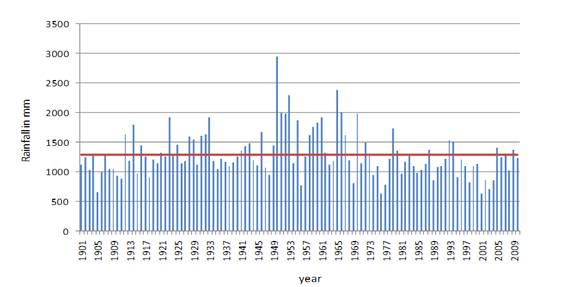
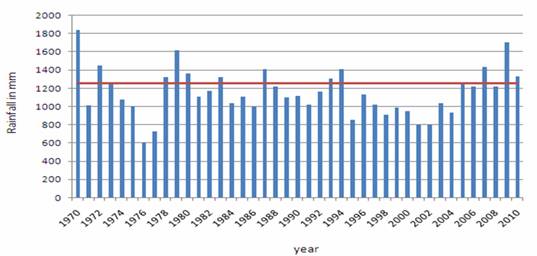
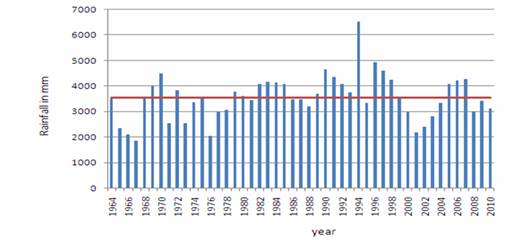
Kali river basin is divided further into 9 sub basins and annual rainfall was analysed for each of them. Figure 6 shows 100 years rainfall pattern for the 9 sub basins and Figure 7 shows rainfall in Kali River basin for the year 2010.
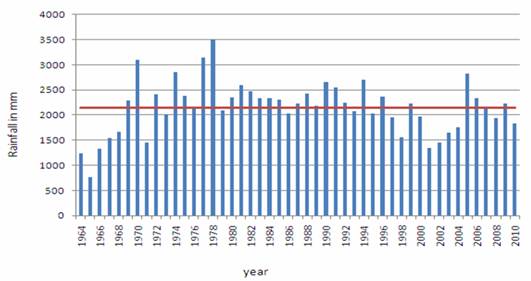
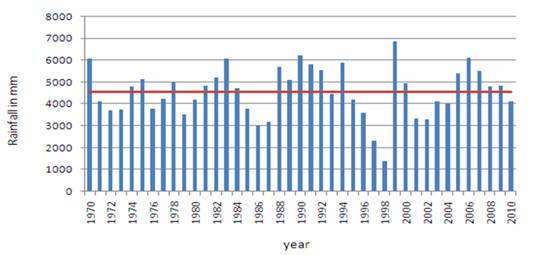
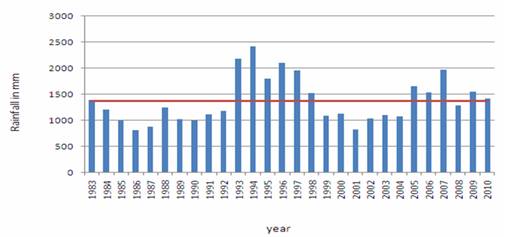
Rainfall data of 1950 and 1953 showed maximum rainfall and the year 1965 and 1966 showed above average rainfall in subbasin1 (6a). In subbasin2, 1962 and 1994 received the highest rainfall and the rainfall was above the average rainfall in the year 1978, 1990, 1996 (6b). The years such as 1970, 1978, 1986, 1993, 1994, 2009, 2010 received more than average annual rainfall in subbasin3 (6c). In subbasin4, the rainfall in the year 1970, 1972, 1978, 1980, and 2009 etc were higher than the annual average rainfall (6d). More than average rainfall was experienced in the year 1970, 1981,1988, 1989, 1990, 1991, 1992, 1994 and 1999 etc. in subbasin5 (6e). In the year 1974, 1975, 1978, 1983, 1984, 1985, 1994, 2005, 2009 etc. there were more than average rainfall in the subbasin6 (6f).
Figure 6: 100 year of rainfall in the Kali subbasins
(a) |
(b) |
(c) |
(d) |
(e) |
(f) |
(g) |
(h) |
(i) |
(a) subbasin 1, (b) subbasin 2, (c) subbasin 3, (d) subbasin 4, (e) subbasin5, (f) subbasin 6, (g) subbasin 7, (h) subbasin 8, (i) subbasin 9
 |
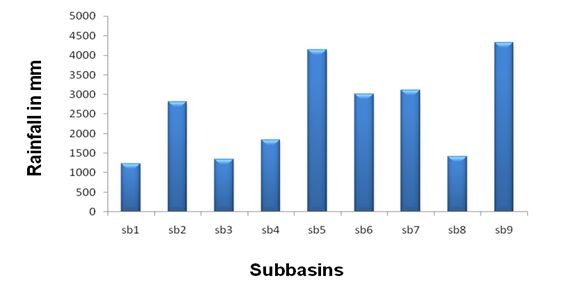
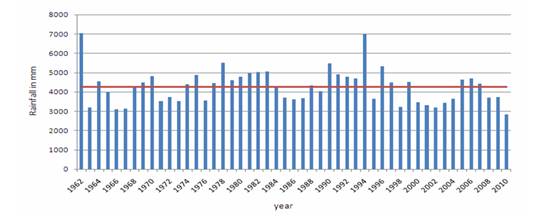
Figure 7: Rainfall in Kali River basin for the year 2010
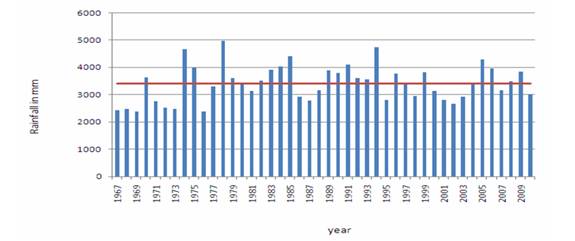
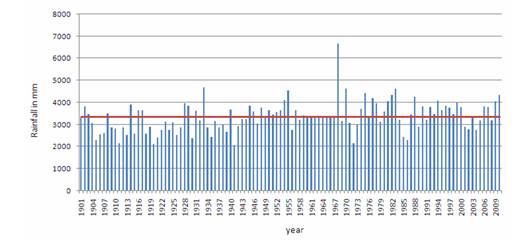
Year 1993 has the highest rainfall as the shown by the peak in the graph in subbasin7 (6g). 1971, 1972, 1981, 1982, 1983, 1984 and 1985 had above average rainfall in subbasin7 (6g). In subbasin8, the rainfall is above average in the year 1993, 1994, 1995, 1996, 1997, 2005, 2007 etc (6h). In the hundred year rainfall history of Kali sub basin 9, the year 1968 showed maximum rainfall and year 1933, 1940, 1954, 1955, 1970, 1973, 1974 etc. showed above average rainfall (7i). In the year 2010, sub basin 9 received the maximum rainfall while subbasin1 received minimum among the nine sub basins (Fig 7). Among all the Kali sub basins sb1, sb3, sb4, sb8 received minimum rainfall while sb2, sb5, sb6, sb7 and sb8 received maximum rainfall in the year 2010.
STATISTICAL ANALYSIS (MULTIPLE REGRESSION)
Multiple regression was carried out taking the surface runoff values as a function of classified LU categories, fragmentation results along with the annual rainfall for each subbasins. The regression (correlation) coefficient was (r) was 0.901325716 (p=0.05), showing a strong positive relationship between surface runoff and various factors like rainfall, built-up, perforated and interior forest.
|
