|
METHODS
The overall method is depicted in Figure 3. IRS data of the year 2010 were used to classify the Kali river basin into eleven LU categories (builtup, water, agriculture, open land, semievergreeen, evergreen, scrubforest_grasslands, acacia plantation, teak plantation, coconut_and arecanut gardens, and dry deciduous forest). Subbasins were delineated from the digitized layer of Kali basin and numbers of streams were counted (first, second, third and fourth order) to find the total number of streams belonging to each order. Perennial streams were identified from Google Earth for the entire river basin.
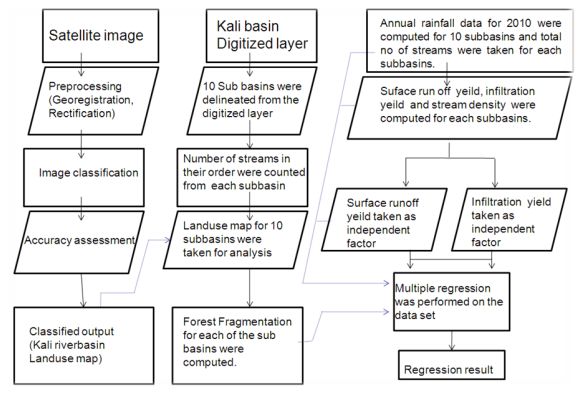
Figure 3: Method of the study shown in Flow chart
Forest fragmentation model was used on the derived LU information to obtain fragmentation indices, which gives forest continuity values. These values are used in conjunction with the total proportion of forest for a given area (excluding water) to produce an index of forest fragmentation (Hurd et.al, 2002). This was done for each of the sub-basins in order to get the proportion of patch, transitional, edge, perforated and interior forest. Average rainfalls for the year 2010 were calculated taking rain gauge stations present in the villages of each sub-basin. The yield of the catchment is the net quantity of water available for storage, after taking in to account all losses for the purpose of water resources utilization and planning like irrigation, water supply etc. Surface runoff yield of the catchment assuming a suitable runoff coefficient is expressed as:
Surface runoff yield = C*A*P
- A= Area of the catchment
- P= Precipitation
- C=runoff coefficient
Here, the drainage area was divided into a number of subbasins, and the runoff contribution of each area is determined. Similarly, infiltration runoff yield is computed by taking runoff coefficient value as (1-C).
The stream density of the drainage basin is expressed as the number of streams per square kilometer. Stream density = number of streams / area of the basins. Table 1 shows the perennial and seasonal streams in the Kali river basin.
Table 1: Perennial and seasonal streams in the subbasins
| Subbasin |
Number of perennial streams |
Number of seasonal Streams in Order |
Total No. of Streams |
Catchment area (m2) |
Stream Density
(m-2) |
| 1 |
2 |
3 |
4 |
5 |
| Subbasin1 |
3 |
2520 |
435 |
119 |
37 |
|
3114 |
824892470 |
3.78E-06 |
| Subbasin2 |
3 |
2155 |
482 |
109 |
18 |
2 |
2769 |
616985070 |
4.49E-06 |
| Subbasin3 |
2 |
996 |
213 |
53 |
11 |
|
1275 |
435939850 |
2.92E-06 |
| Subbasin4 |
1 |
1171 |
248 |
50 |
18 |
1 |
1489 |
293294700 |
5.08E-06 |
| Subbasin5 |
2 |
932 |
189 |
48 |
10 |
|
1181 |
431371540 |
2.74E-06 |
| Subbasin6 |
1 |
1258 |
256 |
62 |
11 |
|
1588 |
428604850 |
3.71E-06 |
| Subbasin7 |
1 |
879 |
172 |
47 |
16 |
3 |
1118 |
173502600 |
6.44E-06 |
| Subbasin8 |
1 |
1328 |
281 |
58 |
7 |
|
1675 |
370847390 |
4.52E-06 |
| Subbasin9 |
1 |
1220 |
258 |
73 |
18 |
|
1570 |
346938410 |
4.53E-06 |
| Subbasin10 |
1 |
1389 |
270 |
69 |
8 |
1 |
1738 |
477931910 |
3.64E-06 |
|
