|
Results
The land cover analysis was done by computing NDVI at temporal scale reveals the transition of vegetation from 1973 to 2010. Year 1973 shows 97.82% of the area was under vegetation whereas in 2010 it is 89.92%. The non-vegetated areas have increased by 10.08% (2010) from 2.18 % (1973). The temporal variation of land cover is shown in table 1 and figure 3.
Table 1: temporal change in land cover
| Year |
% vegetation |
%non-vegetation |
| 1973 |
97.82 |
2.18 |
| 1989 |
96.13 |
3.87 |
| 1999 |
94.33 |
6.67 |
| 2010 |
89.92 |
10.08 |

Figure 3: Land cover analysis – NDVI
The status of land and its transition is accounted by land use analysis at different time scales. The analysis clearly depicts he loss of vegetation cover from 1973 to 2010. The primeval evergreen forest cover is reduced from 87.11% (1973) to 35.42% (2010). This is mainly due to anthropogenic activities than natural processes. The built-up area has increased from 0.19% (1973) to 2.64% (2010). The intensified agriculture activities also aggravating the deforestation rate in this region. The table 2 and figure 4 (a) clearly describes the transition of landscape from 1973 to 2010. The increase in plantation of exotic species led to removal of primeval forest cover. The accuracy assessment was included in table 3. The field data and Google earth data sets are used for analysing accuracy and the analysis shows that accuracy ranges from 87 to 93%.
Table 2: temporal change in land use
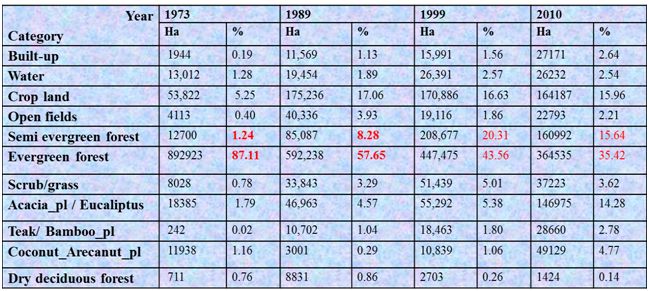
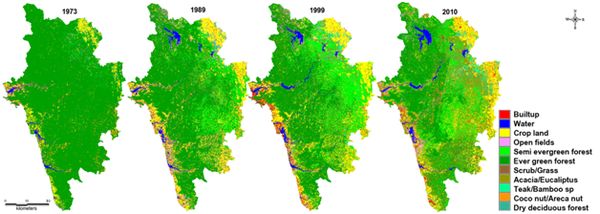
Figure 4 (a): Land use analysis from 1973 to 2010
Table 3: Accuracy assessment
| Overall Accuracy |
Kappa |
| 87.38 |
0.81 |
| 91.25 |
0.86 |
| 92.47 |
0.88 |
| 87.88 |
0.82 |
The forest loss is not uniform across the district since the effects of anthropogenic activities vary across different regions. To account these variations the zone wise analysis was considered. The change at temporal scale is accounted to investigate the effect of drivers for the change with respect to each zone. The figure 5 (a, b) explains temporal variation of deforestation from 1973 to 2010 in coastal region. Population growth and consequent changes in land use (forest to agriculture) and developmental activities have led to the decline in forest cover in this region. The hydroelectric projects in Karwar, Honnavar taluks and Nuclear power generation as well as Seabird novel base projects in Karwar taluk can be attributed for this change. It is evident from this study the built-up area is increased from 0.32% (1973) to 3.74% (2010) at the loss of evergreen forest from 80.16% (1973) to 49.16% (2010).
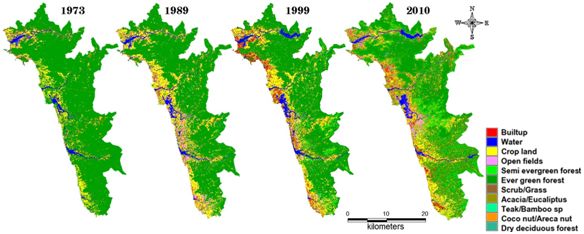
Figure 5 (a): temporal change of land use in Coastal zone
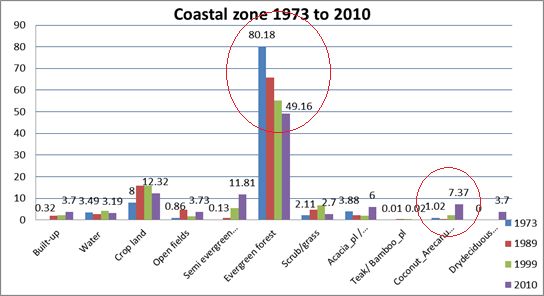
Figure 5 (b): the land use dynamics of Coastal zone
The Sahyadri interior region is having the major forest cover and undulating terrain. The region has tropical evergreen forest and semi-evergreen forest to moist deciduous forest cover with protected areas for endemic flora and fauna. The temporal analysis reveals of changes due to due to the hydroelectric projects situated at Supa taluk and intensive horticulture activities in Siddapur, Sirsi taluks. The evergreen forests are lost from 95.45% (1973) to 40.71% (2010) due to induced changes (figure 6a, b). The intensified agriculture activities are observed due to perennial water availability. The eastern and north-western parts Uttara Kannda district comprises of extensive teak planted area tending to scrub type at the border of Dharwad district. The forests towards the west yield high quality timber (teak and hardwoods). There are patches of evergreen forests towards the western side in the lower portion of the river valleys. It is observed that the plains are more prone to anthropogenic interaction than any other regions of the district (figure 7(a, b)). The loss of evergreen forest cover from 73.2% (1973) to 6.5% (2010) shows the severity in deforestation pattern. The intensified agriculture activities can be observed as 14.08% (1973) to 36.56% (2010).
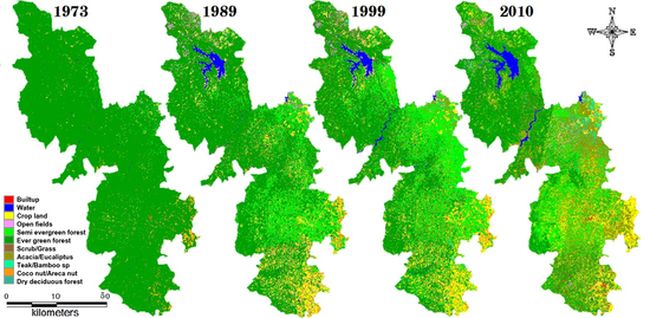
Figure 6 (a): temporal change in land use of Sahyadri Interior
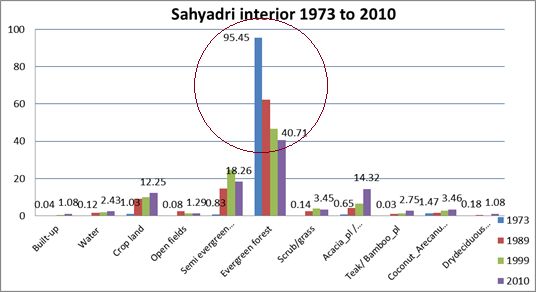
Figure 6 (b): the land use dynamics of Sahyadri Interior
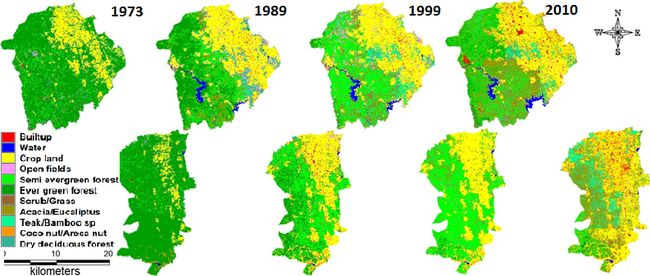
Figure 7 (a): temporal change in land use of Plains
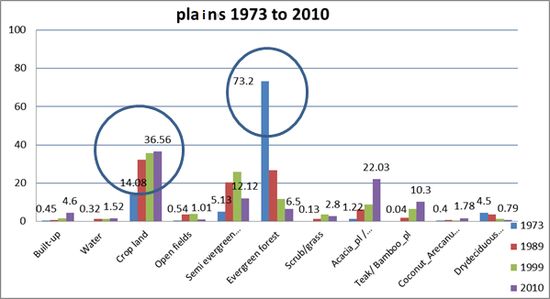
Figure 7 (b): the land use dynamics of Plains
To understand the causal factors of land cover, dynamics, land use changes due to the implementation of various developmental projects in the Uttara Kannda district (figure 8) were considered Figure 8 explains the major infrastructure developments of this region which are showing impact on local ecology. To provide overview of changes, the temporal analysis was done by considering there major projects. The buffer based analysis was considered to explain how these major projects influences on the surrounding areas. The Project sea bird is considered in coastal zone, Supa hydroelectric project is considered in Sahyadri zone and West coast paper mill is considered in eastern region.
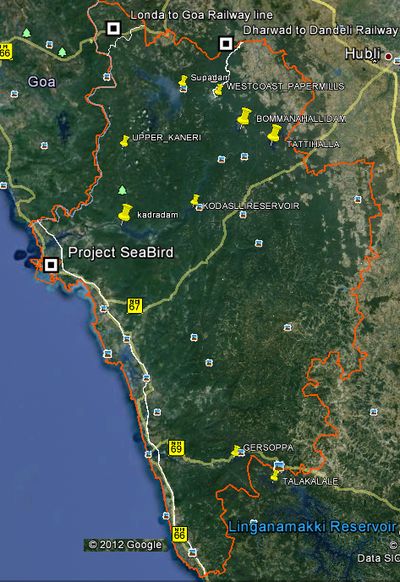
Figure 8: Developmental projects of Uttara Kannada district
-
Project Seabird (INS Kadamba) is an Indian Navy base located near Karwar in Karnataka, a larger naval base in Asia and has an exclusive military harbour. Spread over 11,200 acres and with a 26km-long coastline.
-
Supa Dam is the second largest dam in the state of Karnataka,built across the Kali river in Joida Taluk of Uttara Kannada District in India. The construction started in 1974 and ended in 1987. It has a catchment area of 1057 Sq.Kms and the live storage capacity is 145 Tmcft. (Thousand Million Cubic Feet). The reservoir has two saddle dams of length 705 Mtrs and 940 Mtrs. The power house at the foot of the dam has two electricity generators of fifty megawatt each.
-
The West Coast Paper Mills, Dandeli situated in the heart of thick forests on the banks of Kali river and getting required supply of raw materials, perennial availability of water. Started in 1955 in the vicinity of rail and road linkages and the assurance of state government of Maharashtra for continued supply of forest-based raw materials, availability of water from the perennial Kali river, assured power supply from the state grid,. The mill was originally designed to produce 18,000 tpa (tonnes per annum) of writing, printing and packaging paper in 1959 and periodically expanded to reach current production levels of 178500 tpa.
The spatio temporal analysis provides how these developmental projects changing the landscape from 1973 to 2010 figure (9 (a, b, c)) and table (4 (a, b, c)). The built-up area is increased from 1.87% (1973) to 33.74% (2010) within project area. With respect to 2km and 4km buffers also it shows the increasing trend. The evergreen forest is decreased from 35.01%(1973) to 5.79% (2010) within project area, even the 2km, 4km buffer areas also showing drastic changes in the evergreen forest cover. The region shows increase in scrub forest because of removal of primeval forest.
Table 4(a): temporal change in Project sea bird Area (Project area, 2km Buffer, 4km Buffer)
Land use category
Year |
Project area |
2km |
4km |
| 1973 |
2010 |
1973 |
2010 |
1973 |
2010 |
| Built-up (%) |
1.72 |
33.85 |
0 |
5.17 |
0.12 |
3.54 |
| Water |
14.84 |
0.99 |
0 |
0 |
0 |
0.02 |
| Agriculture |
12.87 |
16.87 |
5.53 |
8.08 |
1.62 |
0.79 |
| Open space |
35.56 |
15.98 |
4.33 |
3.81 |
6.09 |
2.33 |
| Semi ever green to moist deciduous |
0 |
4.83 |
0.10 |
13.49 |
0 |
12.72 |
| Evergreen forest |
35.01 |
5.79 |
90.04 |
55.94 |
92.17 |
63.72 |
| Scrub forest/Grass lands |
0 |
11.25 |
0 |
0.26 |
0 |
0.77 |
| Acacia Plantations |
0 |
2.90 |
0 |
4.43 |
0 |
9.97 |
| Teak / Bamboo plantations |
0 |
0 |
|
0 |
0 |
0 |
| Coco nut/Areca nut plantations |
0 |
7.53 |
0 |
8.82 |
0 |
6.14 |
| Dry deciduous forest |
0 |
0 |
0 |
0 |
0 |
0 |
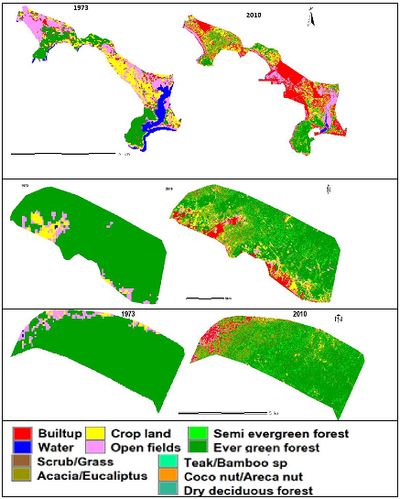
Figure 9(a): temporal change in Project sea bird Area (Project area, 2km Buffer, 4km Buffer)
The Supa hydroelectric project was implemented in Sahyadri Interior region. This region is thick evergreen patches in 1973 and the construction was started in 1974. The spatio temporal analysis shows of the evergreen forest cover loss and increase in built-up area. The 1km, 5km, 10km buffer is considered to account these changes with respect to surroundings. The built-up area is increased from 0.18% (1973) to 3.24(2010) because of establishment of work force colonies. The evergreen forest cover has decreased from 94.32% (1973) to 32.23% (2010) within the 1km buffer. This degradation can also clearly identified in 5km, 10km buffer regions.
Table 4(b): temporal change in Supa hydroelectric power project area (1km, 5km Buffer, 10km Buffer)
Land use category
Year |
1km |
5km |
10km |
| 1973 |
2010 |
1973 |
2010 |
1973 |
2010 |
| Built-up (%) |
0.18 |
3.24 |
0.05 |
0.13 |
0.16 |
0.65 |
| Water |
4.55 |
42.57 |
0.75 |
37.8 |
0.45 |
17.9 |
| Agriculture |
0.96 |
0.48 |
1.62 |
1.03 |
1.27 |
4 |
| Open space |
0 |
2.32 |
0 |
0.58 |
0.07 |
1.71 |
| Semi ever green to moist deciduous |
0 |
7.28 |
2.86 |
6.14 |
3.71 |
11.11 |
| Evergreen forest |
94.32 |
32.23 |
94.72 |
48.15 |
94.34 |
51.07 |
| Scrub forest/Grass lands |
0 |
6.28 |
0 |
1.65 |
0 |
3.66 |
| Acacia Plantations |
0 |
5.12 |
0 |
4.33 |
0 |
8.06 |
| Teak / Bamboo plantations |
0 |
0 |
0 |
0 |
0 |
0.28 |
| Coco nut/Areca nut plantations |
0 |
0.48 |
0 |
0.19 |
0 |
1.56 |
| Dry deciduous forest |
0 |
0 |
0 |
0 |
0 |
0 |
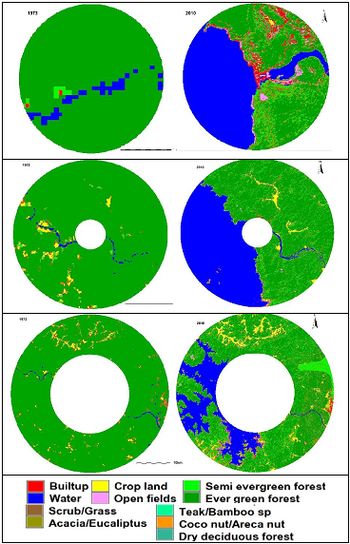
Figure 9(b): temporal change in Supa hydroelectric power project area (1km, 5km Buffer, 10km Buffer)
The west coast paper mills region is considered and the project area with its surroundings were analysed at temporal scale. The result clearly shows changes in this region because of anthropogenic activities. The figure 9 (c) shows with in 1km of project area shows intensified built-up area and even with in 5km. The temporal analysis shows that there is loss of semi evergreen and evergreen forest cover. It is observed that to meet the demand of raw material for the paper mills in and around area was converted to plantations, which is shown 4.47% with in 1km and 24.74% within 5km region.
Table 4(c): temporal change in West coast paper mill area (1km, 5km Buffer)
Land use category
Year |
1km |
5km |
| 1973 |
2010 |
1973 |
2010 |
| Built-up (%) |
3.04 |
32.63 |
0.2 |
1.85 |
| Water |
5.01 |
2.57 |
4.75 |
1.38 |
| Agriculture |
2.48 |
10.42 |
0.69 |
4.59 |
| Open space |
0 |
1.57 |
0 |
0.5 |
| Semi ever green to moist deciduous |
48.13 |
34.12 |
7.11 |
33.73 |
| Evergreen forest |
41.35 |
2.44 |
87.25 |
24.09 |
| Scrub forest/Grass lands |
0 |
3.76 |
0 |
3.8 |
| Acacia Plantations |
0 |
4.77 |
0 |
24.74 |
| Teak / Bamboo plantations |
0 |
1.07 |
0 |
3.63 |
| Coco nut/Areca nut plantations |
0 |
6.65 |
0 |
1.69 |
| Dry deciduous forest |
0 |
0 |
0 |
0 |
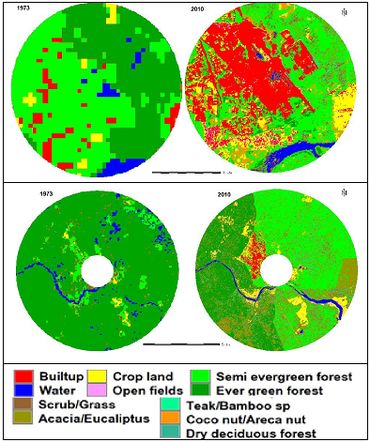
Figure 9(c): temporal change in West coast paper mill area (1km, 5km Buffer)
|
